Analysis of the 2007-08 Budget Bill: Perspectives and Issues
Both the U.S. and California experienced continued economic expansion with modest inflation in 2006. The pace of growth varied considerably within the year, however. Growth was strongest early on, then slowed as expected, reflecting a sharp decline in real estate activity. The good news is that the softness in housing has not spread to the rest of the economy to any significant degree, as economic growth outside of housing-related industries continued at a moderate pace during 2006. The year ended on a positive note, with preliminary fourth-quarter national growth estimated to be above expectations. Whether this initial estimate will hold up when it is revised in late February and again in late March remains to be seen, however, as many think it is possible that a lower figure is more consistent with other more recent economic data.
For 2007, like most other economists at this time, we forecast that growth will continue but be modest for the nation and California. For the year as whole, 2007 growth will be somewhat less than it was in 2006, with the first half of the year the weakest. Throughout the year, however, growth should accelerate, as the housing sector stabilizes, especially in the second half of 2007. We expect that the state’s performance will generally be similar to the nation’s.
It should be noted that the current economic expansion has lasted five years and, thus, is comparatively old by historical standards. In addition, past experience tells us that predicting economic turning points is very difficult and expansions do not last forever. It also is important to be aware that there are a number of risks and uncertainties in the outlook, as discussed below. However, despite these considerations, most economists anticipate that the expansion will continue in 2007 and 2008, and think the odds of a pronounced slowdown or outright downturn are relatively low. We share this view.
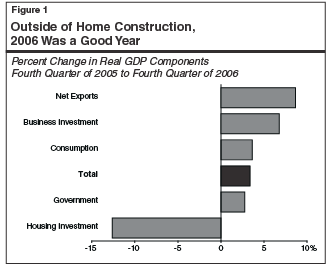
Figure 1 shows that most gross domestic product (GDP) categories experienced moderate to healthy growth in real (inflation-adjusted) terms on a fourth-quarter to fourth-quarter basis during the year. The one exception is residential construction—primarily housing—which fell sharply. Specifically:
-
Net exports—which equals exports minus imports—had the greatest percentage improvement and accounted for about one-sixth of GDP growth. Although net exports remain negative, reflecting the nation’s trade deficit, they became less negative in the fourth quarter of 2006. This was due to the combination of healthy economic growth abroad (which increases foreign demand for our domestically produced exports), a declining dollar (which also stimulates our exports and discourages imports), and the decline in oil prices. This in turn led to a modest decline in the U.S. trade deficit late in the year and, thus, less of a drag on our economy.
-
The next-fastest-growing output category was business spending on computers, software, networks, other equipment, and new facilities (referred to as nonresidential investment). This category increased by nearly 7 percent in real terms.
-
Consumer spending, driven by good job growth and wage gains, increased 3.7 percent during the year. This moderate increase partly reflects a somewhat better-than-expected holiday shopping season in late 2006.
-
Government spending rose 2.8 percent, reflecting modest increases at the federal, state, and local levels.
-
On the downside, home construction (technically referred to as residential investment) fell by over 12 percent during 2006, reflecting major declines in single-family home construction and more-moderate declines in construction of apartments.
World crude oil prices, which rose from around $30 per barrel in early 2004 to a peak of over $75 in mid-2006, began falling in late summer. As shown in Figure 2, prices retreated from $73 in August to near $60 as of the close of 2006. Prices dropped further during the first three weeks of January, into the low $50s, before returning to about $60 as of mid-February.
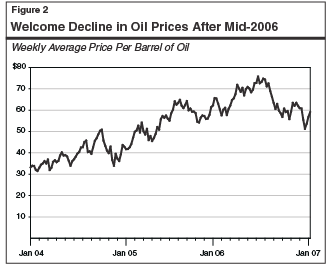
Factors contributing to the 2006 decline include: (1) increases in worldwide production and declines in worldwide consumption; (2) fewer-than-expected supply disruptions from hurricanes and other factors; and (3) a mild early winter in the U.S, which depressed demand for heating fuel.
The oil price drop has given a much-needed boost to the U.S. economy. The resulting reduction in prices of gasoline and other energy-related products is boosting disposable incomes and confidence levels of consumers. It has also reduced upward pressures on inflation and reduced the cost of oil imports, thereby improving the nation’s trade balance. Finally, the lower energy costs have reduced cost pressures faced by airlines and other energy consuming businesses, leading to stronger profit growth in these sectors.
Given the recent volatility in the world oil markets, a key question for both the U.S. and California economic outlooks is whether the 2006 oil price decline will be sustained, or whether it will be reversed in the months ahead as economic growth picks up. There is currently a wide range of forecasts for future oil prices. Some energy analysts believe that the recent factors driving prices downward are largely transitory, related to mild weather and temporary slowdowns in consumption. Others, however, believe that the current declines may be related to more fundamental factors, such as sensitivity to high prices and slowing underlying growth in worldwide demand. In 2006, for example, global oil demand grew only 0.6 percent (with reduced demand in most places other than China and the Middle East) compared to 1.5 percent in 2005 and 3.9 percent in 2004. Our forecast takes a middle road. Although short-term oil price volatility is likely throughout the year, we are assuming that prices will average around $60 per barrel, down about 25 percent from the mid-2006 peak.
One of the major concerns in early 2006 was that the rise in energy prices was beginning to spill over into the rest of the economy. Businesses, no longer able to absorb higher energy costs, were starting to raise the prices of their products and services. Figure 3 shows that “core” inflation (as measured by the Consumer Price Index (CPI) excluding food and energy costs) was accelerating in early 2006, rising from a year-to-year monthly gain of 2.1 percent at the beginning of the year to 2.9 percent as of September. This raised concerns that the Federal Reserve would need to further raise interest rates in order to constrain the economy and thereby hold down inflation, potentially aggravating the economic slowdown that was already occurring.
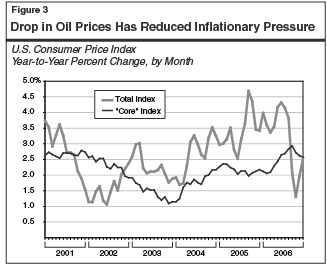
The drop in oil prices beginning in mid-summer provided a much-needed respite from rising inflationary pressures. As shown in Figure 3, year-to-year monthly growth in the overall CPI (including food and energy costs) moderated from 4.3 percent in mid-2006 to a low of 1.3 percent in October, before partially rebounding to 2.5 percent at the close of the year. Meanwhile, the core rate fell from 2.9 percent in September to 2.6 percent by the end of the year. This enabled the Federal Reserve to halt interest rate increases late last year.
For the year as a whole, comparing December 2006 to December 2005, overall CPI inflation came in at 2.5 percent, down from 3.4 percent for the prior year. By comparison, core inflation increased 2.6 percent over the same period, versus 2.2 percent for the prior year. The CPI’s inflation benefited in 2006 from a slowdown in the medical care component, which normally has been steadily increasing. For example, both physician charges and prescription drug prices experienced very small gains. This slowdown, however, was due to special circumstances, including price cuts by major retailers and several major drugs that came off patent protection during the year, allowing cheaper generic versions to be sold. Thus, medical care inflation will be returning to a higher level in 2007.
After soaring 33 percent in 2005, U.S. after-tax profits increased by 19 percent in 2006, reflecting major gains in a wide variety of industries. These gains, which were considerably greater than expected, reflect major increases in oil-related profits, as well as the ongoing benefits of high productivity and sales growth on businesses’ bottom-line earnings. As noted in the
“Part III”
revenue section of this volume, California profits appear to be somewhat less robust than what the national figures would indicate, possibly reflecting the greater negative impact that the housing downturn is having in our state.
Recent indicators suggest that, after slowing through much of the year, the U.S. economy experienced a modest pick-up late in the year, which appears to have set the stage for continued growth in 2007. For example:
-
Preliminary estimates are that real GDP growth in the fourth quarter of 2006 was at an annualized rate of 3.5 percent, which was above expectations. Whether this initial estimate will hold up when it is revised in late February and again in late March, however, remains to be seen, as many economists think it possible that a lower figure is more consistent with other more recent economic data.
-
Monthly retail sales jumped by 0.6 percent in November and 0.9 percent in December. The year-end rebound reflected a healthy holiday shopping season—particularly for electronic goods—especially when the delayed tabulation of receipts from December online purchases and gift-cards are counted. Weekly sales reports for January suggest that spending remained healthy into the early weeks of 2007.
-
After dropping in both October and November, industrial production rebounded 0.4 percent in December. Manufacturing output rose an even stronger 0.7 percent during the month. For the full year, industrial production was up a moderate 3 percent.
-
After declining for much of the year, housing starts jumped 4.5 percent in December, with most regions of the country sharing in the increase. Permits for new construction were also up by 5.5 percent during the month, the strongest gain in over one year.
-
Wage and salary employment increased by 206,000 jobs in December, or slightly better than the average gains for 2005 and 2006. The share of the population employed edged up at year-end to over 63 percent, the highest level since late 2001. In a related development, the unemployment rate trended down to 4.5 percent in December. In January, employment growth dropped, however, to 111,000.
-
Productivity rose significantly in the fourth quarter of 2006, following a slight decline in the third quarter. Although productivity growth for all of 2006 was only 2.1 percent—the slowest in ten years—the year-end gain was a positive development.
Concerns over the impacts of the housing downturn on overall economic growth were of particular importance to California in 2006. This is because the greater-than-average run-up in prices and real estate activity that occurred in California between 2001 and 2005 left this state particularly vulnerable to a dramatic drop in home prices, sales, and construction.
Regarding housing prices, these have been relatively flat statewide thus far, with median prices about the same at year-end 2006 compared to one-year earlier, and down a bit over 3 percent from their 2006 peak in August. There have been certain geographic areas where housing prices have experienced greater softening, however, such as Santa Barbara (down 23 percent over the year).
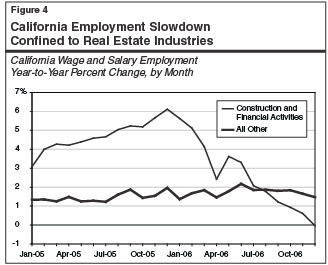
Regarding housing activity, at this point, it appears that the reductions in housing construction and sales, while greater than expected, did not have major adverse impacts on the rest of the economy. As shown in Figure 4, employment growth in the construction and related finance industries slowed from 6.1 percent in 2005 to near zero by the end of 2006, but growth in all other sectors combined remained relatively steady during this period. Retail spending on automobiles, home furnishings, and other durable goods has been soft (due both to the housing slowdown and high gasoline prices throughout most of the year). However, the majority of the non-real estate sectors of the economy expanded at a solid pace in 2006. The relatively healthy performance reflected a variety of factors, such as:
-
Continued growth in California’s high-tech and related professional services industry. This high-paid sector includes software development, computer systems and design, biotechnology, and pharmaceuticals.
-
Continued strength in information-related industries (including
motion pictures, broadcasting, sound recordings, publishing, and
Internet service providers).
-
Solid growth in international trade, which is benefiting California manufacturers and farmers that sell abroad, as well as transportation, warehousing, and distribution activities associated with trade activity passing through California’s ports.
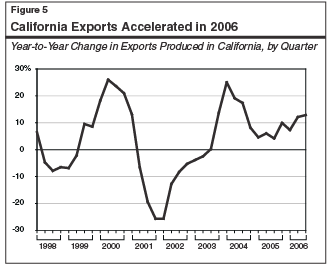
As shown in Figure 5, exports of goods produced in California accelerated in 2006, and were up about 13 percent in the third quarter of the year. The third-quarter growth reflected an over-30 percent increase in shipments to China, and more moderate, but still healthy, growth in shipments to other California trading partners.
A key factor in the outlook is whether the real estate downturn has run its course, or whether further reductions are in store. This is the real wild card in the forecast, given that history has shown that housing market corrections have typically lasted a couple of years. The recent news is mixed, but there are some tentative signs that at least the worst of the real estate decline is over. For example, after plunging from over 650,000 (annual rate) in mid-2005 to around 450,000 in mid-2006, sales of existing homes stabilized near the 450,000 range in recent months. Similarly, inventories of unsold homes, while up sharply from 2005 levels, also appear to have
leveled off. Finally, interest rates have stabilized in recent months, while job and income growth continues in the state.
While there may be signs that real estate is bottoming out, we do not expect a significant turnaround any time soon. Affordability remains a major problem, and the large inventory of homes for sale that are on the market means that builders will remain cautious about committing to new developments. The flattening in housing prices will also financially squeeze recent home purchasers that have used variable rate loans with low teaser rates to finance home purchases, as recent reports about foreclosures already indicate. This is of particular concern for the large proportion of homebuyers in 2004 and 2005 that financed the rising costs of homes with nontraditional or “exotic” mortgages, many of which had low initial payments that are scheduled to adjust upward over the next several years. The flattening in home prices implies that homeowners facing large payment increases when these loans reset will not have sufficient equity to refinance their loans and avoid higher monthly payments. Given the considerable dollar size of the mortgages involved, the anticipated rise in applicable interest rates for these particular homeowners implies large monthly payment increases. This suggests that less discretionary income will be left over for other purchases. It also raises the risk of “distress sales” and foreclosures, which in turn will depress home prices and, potentially, new construction activity during the next few years.
The bottom line regarding housing is that, while the worst of the real estate declines may be over, we do not expect the sector to make contributions to economic growth until 2008 or later, and even then the contributions will be only modest. However, even a mere stabilization of activity in this sector implies that it will be less of a drag on the overall economy in 2007 than in 2006.
Nonresidential Construction Is Strong. Although nonresidential construction is only about one-third the size of the residential sector, its positive performance during 2006 offset a significant share of the drop in the residential side of the market. Total nonresidential construction jumped nearly 19 percent in 2006, reaching a total of $20 billion during the year. The increases were widespread, encompassing industrial buildings, office buildings, and hotels. Current indicators, such as strong corporate earnings, falling vacancy rates, and rising office rents, suggest that nonresidential construction activity will remain strong in 2007.
Consumer Confidence Is Up. After falling in each of the prior three quarterly surveys, the index of consumer confidence, as measured by the Survey and Policy Research Institute at San Jose State University, jumped by about 7 percent in January. The increase reflected both rising perceptions about current conditions as well as improved expectations about future conditions. While confidence levels can change rapidly, and are often influenced by transitory factors, such as gasoline price spikes, the recent increase is nevertheless a positive indicator that consumers remain confident and willing to spend.
In summary, California’s economy clearly slowed over the course of 2006, but the reduction in growth was primarily concentrated in real estate-related industries. While softness in the real estate sector will continue to drag down growth in early 2007, the overall economy appears to have been in relatively good shape as the new year began.
The budget’s forecast assumes that the recent economic slowdown will persist through the first half of 2007 before stabilizing real estate markets provide support for a mild upturn beginning in the second half of the year. The budget’s economic forecast for the nation and state is displayed in Figure 6. On an annual average basis, U.S. GDP growth is projected to slow from 3.3 percent in 2006 to 2.4 percent in 2007, before partially rebounding to 2.9 percent in 2008. The forecast assumes that U.S. inflation, as measured by the CPI, will slow from 3.2 percent in 2006 to annual increases of about 2 percent in both 2007 and 2008.
|
|
|
Figure 6
Summary of the Budget’s Economic Outlook |
|
|
|
Estimate |
|
Forecast |
|
|
2005 |
2006 |
|
2007 |
2008 |
|
U.S. Forecast |
|
|
|
|
|
|
Percent change in: |
|
|
|
|
|
|
Real gross domestic product |
3.2% |
3.3% |
|
2.4% |
2.9% |
|
Personal income |
5.2 |
7.2 |
|
5.4 |
5.3 |
|
Wage and salary employment |
1.5 |
1.4 |
|
1.1 |
1.2 |
|
Consumer Price Index |
3.4 |
3.2 |
|
2.0 |
2.1 |
|
Unemployment rate (%) |
5.1 |
4.6 |
|
4.8 |
4.9 |
|
Housing starts (000) |
2,073 |
1,845 |
|
1,586 |
1,619 |
|
California Forecast |
|
|
|
|
|
|
Percent change in: |
|
|
|
|
|
|
Personal income |
5.4% |
6.6% |
|
5.7% |
5.4% |
|
Employment: |
|
|
|
|
|
|
Payroll survey |
1.8 |
1.8 |
|
1.2 |
1.6 |
|
Household survey |
2.1 |
0.8 |
|
1.2 |
1.4 |
|
Taxable sales |
7.4 |
4.5 |
|
3.1 |
5.4 |
|
Consumer Price Index |
3.7 |
3.9 |
|
2.6 |
2.4 |
|
Unemployment rate (%) |
5.4 |
4.8 |
|
4.9 |
5.1 |
|
Housing permits (000) |
209 |
168 |
|
152 |
165 |
|
|
The administration’s forecast assumes that California’s economy will generally grow in line with the rest of the nation. It projects that personal income—a broad measure of state-level economic activity—will slow from a growth rate of 6.6 percent in 2006, to 5.7 percent in 2007, and further to 5.4 percent in 2008. The annual growth rates for personal income are affected by the administration’s assumption that significant one-time bonuses related to the stock market will bolster personal income early in 2007. Absent these one-time bonuses, the growth rate in 2007 would be less and the growth rate in 2008 would thereby be greater than shown. The forecast assumes continued softness in construction-related activity, but solid growth in other sectors of the California economy.
Our updated economic outlook is for continued expansion in 2007, with the first half of the year the weakest and accelerating as the year progresses.
As shown in Figure 7, we forecast that real GDP growth will ease from 3.4 percent in 2006 to 2.5 percent in 2007, before partially rebounding to 3.1 percent in 2008. The 2007 slowdown reflects large reductions in housing activity, and a slightly slower pace in consumer spending and nonresidential investment activity. Specifically:
-
Housing-related investment, after declining by 4 percent in 2006, is projected to fall by 14 percent in 2007, before stabilizing in 2008. On a quarterly basis, this sector has been in decline since late 2005, and is expected to continue declining sharply through the first half of 2007 before steadying itself by year end.
-
Real consumer spending is expected to slow from 3.2 percent in 2006, to about 3.1 percent in 2007, and 3 percent in 2008. These increases are slightly less than the projected growth in real disposable income for the same period, reflecting small declines in sales of light vehicles and other durable goods.
-
Business-related fixed investment growth is expected to ease from 7.4 percent in 2006 to around 5 percent over the next three years. The forecast reflects steady growth in business spending on structures and computers, but more-moderate increases in telecommunications spending. A key positive factor in the investment outlook is the recent strength in corporate earnings, which have provided businesses with large amounts of cash to support new spending on equipment and buildings. The spending on information technology (IT) equipment is a positive force in California’s outlook, because many high-tech products are designed in California.
-
The trade deficit is projected to decline in both 2007 and 2008, reflecting the positive impacts of a weaker dollar on exports and lower prices for oil imports. (Nevertheless, despite this improvement, the trade deficit still will remain in the range of $800 billion over the forecast period, suggesting that there will be further downward pressures on the dollar.)
|
|
|
Figure 7
Summary of the LAO’s Economic Outlook |
|
|
Estimate |
|
Forecast |
|
|
2006 |
|
2007 |
2008 |
2009 |
|
U.S. Forecast |
|
|
|
|
|
|
Percent change in: |
|
|
|
|
|
|
Real gross domestic product |
3.4% |
|
2.5% |
3.1% |
3.4% |
|
Personal income |
6.4 |
|
5.3 |
5.5 |
6.1 |
|
Wage and salary employment |
1.9 |
|
1.2 |
1.4 |
1.6 |
|
Consumer Price Index |
3.0 |
|
2.2 |
2.3 |
2.5 |
|
Unemployment rate (%) |
4.6 |
|
4.9 |
4.9 |
4.6 |
|
Housing starts (000) |
1,809 |
|
1,513 |
1,613 |
1,712 |
|
California Forecast |
|
|
|
|
|
|
Percent change in: |
|
|
|
|
|
|
Personal income |
6.1% |
|
5.6% |
5.7% |
6.2% |
|
Employment: |
|
|
|
|
|
|
Payroll survey |
1.9 |
|
1. 4 |
1.7 |
1.8 |
|
Household survey |
0.8 |
|
1.6 |
1.2 |
1.3 |
|
Taxable sales |
4.8 |
|
3.5 |
5.2 |
6.2 |
|
Consumer Price Index |
3.7 |
|
2.7 |
2.5 |
2.7 |
|
Unemployment rate (%) |
4.9 |
|
4.9 |
4.8 |
4.6 |
|
Housing permits (000) |
164 |
|
138 |
155 |
170 |
|
|
We expect that inflation will continue subsiding over the next year from its current pace. The U.S. CPI is projected to slow from slightly over 3 percent in 2006 to slightly over 2 percent in 2007 and 2008. Aside from the expected stabilization in oil prices, factors holding down inflation include continued business productivity growth, moderate wage increases, and intense international competition.
Regarding interest rates, we forecast that short-term rates will remain fairly stable in 2007 and 2008, and long-term rates will drift up by about one-half a percentage point over the two-year period.
We forecast that the recent slowdown in California’s economy will continue through the first half of 2007, reflecting ongoing softness in real estate and some sluggishness in retail spending. By mid-year, real estate-related sales and construction are expected to have bottomed out, providing a foundation for a partial rebound in economic growth in the second half of the year. In terms of our specific forecast:
-
Personal income growth is projected to slow from 6.1 percent in 2006 to 5.6 percent in 2007, before accelerating slightly to 5.7 percent in 2008. The 2007 slowdown reflects a decline in jobs, wages, and profits related to real-estate activity.
-
Wage and salary employment is projected to slow from 1.9 percent in 2006 to 1.4 percent in 2007, in line with overall economic activity, before rebounding to 1.7 percent in 2008. The main factor behind the dip in job growth is slowing construction activity. Growth in most other sectors is expected to remain steady. (A discrepancy continues to exist between the employment pattern associated with the payroll survey that deals with wage and salary employment versus the household survey that deals with civilian employment. This year, the payroll series appears to be more consistent with other economic indicators.)
-
Taxable sales are projected to slow from 4.8 percent in 2006 to 3.5 percent in 2007, before rebounding to 5.2 percent in 2008. The dip in sales growth reflects softness in the second half of 2006 and early 2007 related to sales of building-related materials, home furnishings, and light vehicles.
-
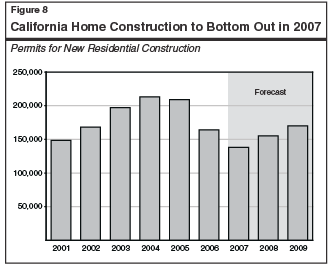
Housing permits issued in California, a key measure of forthcoming residential construction activity, are expected to decline from 164,000 units to 138,000 units in 2007, before rebounding to 155,000 units in 2008 (see Figure 8).
-
We expect dollar value of nonresidential building permits to continue expanding through 2007 and 2008, reflecting continued strength in construction of industrial and office buildings.
Our forecast takes into account the impacts of both California’s recently enacted minimum wage increase and voter passage of the $42.7 billion in infrastructure bonds on the November 2006 ballot.
Minimum Wage Increase. In 2006, the state enacted a two-step increase in the state’s minimum wage—from $6.75 to $7.50 per hour effective on January 1, 2007, and further to $8 per hour on January 1, 2008. The increase will raise earnings of workers in a variety of occupations. It will also have a number of other impacts on the California economy, including price increases in restaurants, fast food establishments, and certain other sectors that employ a significant number of low-paid workers, and some reductions in employment. However, we expect the impacts on overall economic growth and income to be modest (see nearby box).
|
On January 1, 2007, California’s minimum wage was raised from $6.75 to $7.50 per hour, and on January 1, 2008 it will become $8 an hour. We estimate that about 7 percent of California workers were probably directly affected by the January 2007 increase, and an additional 2.5 percent could be affected by the additional increase next year.
California’s minimum wage is now significantly greater than the current federal minimum wage of $5.15. However, it is not much higher than the increase to $7.25 currently being contemplated in Congress. Five other states currently have state minimum wages equal to, or greater than, California’s, with some scheduled for future increases.
The 18.5 percent total increase in the state minimum wage between 2006 and 2008 is large but far from unprecedented. Over the past 20 years, California has experienced three minimum wage increases of similar or greater magnitude over a period of one year or less. For example, in 1988 the minimum wage increased by almost 27 percent. Likewise, between October 1996 and September 1997, the state’s minimum wage was raised by over 21 percent, followed by an additional 12 percent increase in 1998.
One reason why these periodic changes to the minimum wage tend to be large is that inflation significantly erodes the real purchasing power of the minimum wage over time. After adjustment for inflation, California’s new minimum wage will have a purchasing power roughly equal to that of the minimum wage in 1988.
Economic theory suggests that a higher minimum wage could cause some increase in certain prices and some reduction in certain types of employment. This will occur if employers are able to incorporate some of their increased wage costs into the prices of the goods and services they sell, and thereby shift these costs to consumers. If this is not possible, some firms may end up cutting back on employment because of reduced sales or other factors, or be forced to absorb the higher costs themselves, thereby realizing fewer profits. The economic effects of these changes would be at least partially offset, however, as workers receiving the increased wages spend them on goods and services.
Although there is some controversy over what the actual effects of previous minimum wage increases have been, the new increases will probably not cause widespread reverberations. However, particularly vulnerable groups—such as teenagers and adult high school dropouts—may see some more significant long-run employment declines, and various businesses will be adversely affected.
|
Bond Package. Our estimates also take into account added spending from the bonds approved by the voters in November 2006 as well as the bonds proposed by the Governor in the 2007-08 budget. In addition to the long-term benefits from infrastructure related investments—such as improved transportation networks and flood control—spending on construction projects supported by the bond funds will have positive impacts on the economy over the next several years in the form of added employment, income, corporate profits, and taxable sales. However, while the new spending is significant in dollar terms, it is important to remember that (1) it will occur over a decade or more and (2) the annual increases (generally between $5 billion and $10 billion) will be only a modest fraction of California’s overall economy. Thus, the added growth that can be expected from this spending is similarly modest—less than one-quarter of 1 percent per year.
The Early-Year Freeze. In January 2007, California experienced extremely cold temperatures throughout much of the state. In many of California’s prime agricultural areas, significant damage to a variety of crops and plants occurred, including oranges, lemons, lettuce, asparagus, strawberries, blueberries, and certain other fruits and vegetables. Initial estimates are that California’s farmers have lost in the range of $1 billion in receipts. As of late January, higher prices for many of these items had already started to show up in stores. The cold temperatures also resulted in significantly higher utility bills for heating costs than normal for this time of the year for both residences and businesses.
Although the freeze clearly will have adverse effects on the state’s economy, its negative impacts in terms of reducing incomes and jobs will tend to be concentrated in those regions and amongst those individuals and firms most directly affected. For some parties, these losses will be devastating. However, relative to the large size of the overall California economy—over $1.6 trillion—the aggregate losses will be relatively modest. And, in terms of its impact on consumers, increased reliance on imported fruits and vegetables will in some cases help mitigate the effects of limited domestic supplies and higher prices.
To help deal with the adverse impacts of the freeze, Congress is considering adopting a disaster relief package including low-interest farm loans, grants, and other forms of aid. Measures to provide freeze-related tax relief also have been introduced in the Legislature.
The key risks to our current national and state economic forecasts remain the same as the past two years—housing and energy prices. Although there are some tentative signs that housing is stabilizing, there remains a risk that home sales, construction, and prices will fall considerably further before the market starts to rebound. Similarly, despite recent improvements, world oil markets remain tightly balanced, and supply disruptions or faster-than-anticipated growth in energy demand could result in a more dramatic rebound in oil prices than we are anticipating.
Not all of the risks in the current forecast are on the downside. In particular, our forecast assumes that oil prices will remain near $60 per barrel over the next year as some of the transitory factors depressing demand fade—such as mild early winter weather in the U.S. However, if prices were to return to early January levels (approximately $52 per barrel), we would expect more economic growth, less inflation, and lower interests over the next two years than we are currently predicting.
Figure 9 compares our economic forecasts for the nation and California to our November 2006 forecast, as well as to a variety of other economic projections made in recent months by other forecasters. These include the projections made by the University of California, Los Angeles (UCLA) Business Forecast Project in December 2006, the consensus forecast published in the Blue Chip Economic Indicators (January 2007), the consensus outlook forecast in the Western Blue Chip Economic Forecast (February 2007), and the 2007-08 Governor’s Budget forecast.
|
|
|
Figure 9
Comparisons of Recent Economic Forecastsa |
|
(Percent Changes) |
|
|
Forecast |
|
|
2006 |
2007 |
2008 |
|
United States Real GDP: |
|
|
|
|
LAO November |
3.3% |
2.2% |
3.3% |
|
UCLA December |
3.2 |
2.0 |
3.1 |
|
DOF January |
3.3 |
2.4 |
2.9 |
|
Blue Chip "Consensus"b
January |
3.3 |
2.4 |
3.0 |
|
LAO February |
3.4 |
2.5 |
3.1 |
|
California Payroll Jobs: |
|
|
|
|
LAO November |
1.8% |
1.3% |
1.6% |
|
UCLA December |
1.5 |
0.5 |
1.0 |
|
DOF January |
1.8 |
1.2 |
1.6 |
|
Blue Chip "Consensus"c
January |
1.5 |
1.1 |
1.2 |
|
LAO February |
1.9 |
1.4 |
1.7 |
|
California Personal Income: |
|
|
|
|
LAO November |
6.5% |
5.4% |
5.9% |
|
UCLA December |
7.2 |
4.3 |
4.6 |
|
DOF January |
6.6 |
5.7 |
5.4 |
|
Blue Chip "Consensus"c
January |
5.8 |
5.3 |
5.6 |
|
LAO February |
6.1 |
5.6 |
5.7 |
|
California Taxable Sales: |
|
|
|
|
LAO November |
4.6% |
4.7% |
5.8% |
|
UCLA December |
6.2 |
4.2 |
4.7 |
|
DOF January |
4.5 |
3.1 |
5.4 |
|
Blue Chip "Consensus"c
January |
5.3 |
4.4 |
5.0 |
|
LAO February |
4.8 |
3.5 |
5.2 |
|
|
|
a Acronyms used apply
to Legislative Analyst's Office (LAO); University of California, Los
Angeles (UCLA); and Department of Finance (DOF). |
|
b Average forecast of
about 50 national firms surveyed in January by Blue Chip Economic
Indicators. |
|
c Average forecast of
organizations surveyed in February by Western Blue Chip Economic
Forecast. |
|
|
Our 2007 projections for most variables shown are slightly more optimistic than our November forecast. The same is true relative to most other forecasts prepared in recent months, except for UCLA, which is significantly below us. To varying degrees, however, all of the projections shown in Figure 9 call for slowing growth in 2007 and a partial rebound in 2008.
One significant difference between our current forecast and most of the other forecasts shown in Figure 9 is that we now estimate less growth in California personal income during 2006. This lower estimate is based on recent historical revisions by the U.S. Department of Commerce to its data on personal income.
California’s demographic trends both directly and indirectly affect the state’s economy, revenue collections, and expenditure levels. For example, they influence the size of the labor force, the demand for homes and automobiles, the volume of taxable sales, and the amount of income taxes paid. Similarly, the population and its age distribution affect school enrollments and public programs in many other areas, such as health care and social services. Consequently, the state’s demographic outlook is a key element both in estimating economic performance and in assessing and projecting the state’s budgetary situation.
Figure 10 summarizes our updated state demographic forecast. We project that California’s total population will rise from an estimated 37.9 million in 2007 to 38.4 million in 2008, and 38.9 million in 2009. These population projections use as their starting point published 2000 Census data for California, and incorporate developments since then regarding births, deaths, and migration flows.
|
|
|
Figure 10
Summary of LAO's California Demographic Forecast |
|
(Population in Thousands) |
|
|
2007 |
2008 |
2009 |
|
Total population (July 1 basis) |
37,904 |
38,378 |
38,876 |
|
Changes in population: |
|
|
|
|
Natural increase (births minus deaths) |
315 |
314 |
313 |
|
Net in-migration (in-flows minus outflows) |
145 |
160 |
185 |
|
Total Changes |
460 |
474 |
498 |
|
Percent changes |
1.2% |
1.2% |
1.3% |
|
|
Slight Slowing Projected. The state’s population is projected to grow at an average rate of 1.3 percent annually over the next three years. This is down slightly from the 1.5 percent average for the 2002-through-2005 period. Birth rates are forecast to stabilize at historically low levels, and net in-migration is projected to turn slightly upward after having fallen for the past several years.
In numeric terms, the number of new Californians being added each year—about 477,000 people over the forecast interval—is about the size of such cities as Long Beach, Fresno, and Sacramento, and very similar to many smaller states.
California’s population growth can be broken down into two major components—natural increase (the excess of births over deaths) and net in-migration (persons moving into California from other states and countries, minus people leaving the state for other destinations). The population growth associated with natural increase accounts for about two-thirds of California’s projected annual growth over the forecast period and is assumed to be fairly stable. Net in-migration accounts for the other one-third of the growth over the period, but has historically varied in response to changing economic conditions in the state and, in previous years, has accounted for as much as one-half of the state’s annual growth.
Natural Increase. We project that the natural increase component will contribute an average of 314,000 new Californians annually over the forecast period. This reflects stable birth rates, but growth in the female population of child-bearing age groups.
Net In-Migration. This component dropped from 388,000 in 2001 to 145,000 in 2006, due mainly to changes in net domestic migration patterns between California and other states. Specifically, net domestic in-migration from other states fell from a positive 97,000 in 2001 to a negative 55,000 in 2006, meaning that in 2006 more people left California for other states than moved into California from them. This reversal in net domestic in-migration in recent years appears to reflect, to some degree, the impact of high home prices and a slower rate of hiring in California compared to past expansions. We expect net domestic in-migration to slowly turn positive during the next several years, but remain well below the levels realized in past economic expansions. Combined with our projections for steady rates of immigration from other countries, the slow net increase in inflows from other states will result in a modest rise in total in-migration over the next several years.
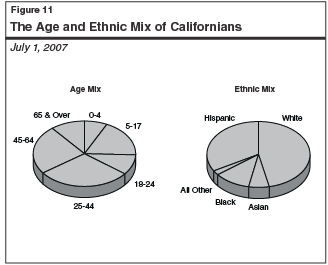
The implications of demographic trends for the budget depend not only on the total number of Californians, but also on their characteristics. California is well known for having one of the world’s most dynamic and diverse populations, including an increasingly rich ethnic mix and a large number of in-migrants. The state’s age and ethnic mix are shown in Figure 11.
The age-related characteristics of California’s population growth are especially important from a budgetary perspective, given their implications for such program areas as education, health care, and social services. Figure 12 shows our forecasts for both the percentage and numeric changes in different population age groups. The 45-to-64 age group (largely representing baby boomers) continues to be the fastest growing segment of the population. About 801,000 more people are expected to move into this age category over the next three years, as the tail-end of the baby boom generation moves into its mid-40s. In contrast, the leading edge of the baby boomers will be only 63 years of age by the end of the forecast period, and thus still are occupants of this age category.
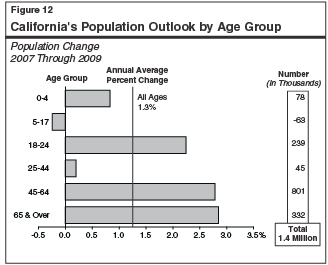
California’s continued population growth—including its age, ethnic, and migratory characteristics—can be expected to have many implications for the state’s economy and public services in 2007-08 and beyond. For example, strong growth of the 45-to-64 age group generally benefits tax revenues since this is the age category in which people normally earn their highest wages and salaries. Alternatively, the lack of growth statewide in the 5-to-17 age group translates into significant declines in enrollment for many school districts.
More general examples of demographic influences include the following:
-
Economic growth will benefit from an expanded labor force, due to a stronger consumer sector and the increased incomes that accompany job growth.
-
However, overall demographic growth will also produce additional strains on the state's physical and environmental infrastructure, including demands on the energy sector, transportation systems, parks, and water-delivery systems.
-
Similarly, the "graying" of the baby boomers will eventually place strains on the state's health programs and related services, including the portion of Medi-Cal related to the elderly and disabled.
-
The increasing ethnic diversity of the state's population will also mean that many public institutions, especially schools, will serve a population that speaks a multitude of languages and has a wide range of cultural backgrounds. Currently, for example, more than one-third of students in kindergarten and first grade are English-language learners.
Return to Perspectives and Issues Table of Contents,
2007-08 Budget Analysis