The Governor's budget provides total K–12 per–pupil funding (PPF) of $11,626 for 2008‑09. This is roughly $300, or 2.6 percent, less than total PPF for 2007–08. In inflation–adjusted terms, the reduction is about double—roughly $600, or 5 percent. This per–pupil amount is calculated by dividing total proposed funding for K–12 education from all sources by the estimated average daily attendance (ADA). This particular calculation is only one of many ways to look at PPF. In this chapter, we (1) describe various factors that should be considered when calculating PPF, (2) compare PPF across states, and (3) compare PPF over time in California.
The basic PPF formula appears simple—divide the total amount spent on K–12 students in a year by the total number of students taught that year. The complexity in comparing PPF comes from the various types of funding that can be included and the various ways students can be counted. In this section we explore these issues.
Consider Funding Source. Funding for K–12 education comes from numerous sources. Funding can be provided by federal, state, or local government. Each of these categories, in turn, has several funding sources. For example, state funding sources include Proposition 98 General Fund monies, Non–Proposition 98 General Fund monies, and Lottery funds. Occasionally other sources are also used to fund K–12 activities. For example, in 2007–08 Public Transportation Account funds were used to pay for a portion of Home–to–School transportation costs. The PPF will appear relatively low if only Proposition 98 monies are included and much higher if all funding sources are included.
Consider Nature of Funding. Funding can also be of a one–time or ongoing nature. One–time funding for K–12 education includes: unspent funds from prior years (carryover), one–time grants for special activities or projects, one–time payments to schools due to court case rulings, and one–time payments related to unmet prior–year Proposition 98 obligations. By comparison, ongoing funding typically is used to support school districts’ ongoing education programs. The PPF will be somewhat lower if only ongoing funds are counted and higher if both ongoing and one–time fund are counted. Including one–time funds, however, can skew year–to–year PPF comparison.
Consider Purpose of Funding. Finally, one also needs to consider the purpose of the monies. For instance, if funds are spent on an activity that does not directly serve students in the classroom, should that count toward PPF? Should state operations expenses at the California Department of Education count? Should payments to the teachers’ retirement fund count? Should debt–repayment monies count toward PPF? Whereas funds used for classroom instruction presumably would be included in virtually any PPF calculation, including funds used for other related educational purposes would depend on one’s particular objective. For example, debt–service payments would not be included in a PPF calculation designed only to reflect schools annual operating costs but would be included in a calculation designed to reflect all annual costs incurred in serving a K–12 student.
Consider Student Count. Counting students typically is done one of two ways: enrollment or ADA.
- Enrollment. Enrollment is a point–in–time count of the number of students enrolled in the public school system. Official enrollment counts in California are typically taken on a given day in October. All students enrolled as of that day are included in the count regardless of attendance. The enrollment for the state is the sum of the enrollment for each school.
Average Daily Attendance. As the name implies, ADA is the aggregate attendance divided by the number of school days in session. Only days on which the student is under the guidance and direction of teachers are considered “days in session.” The ADA for the state is the sum of the ADA for each school.
Because enrollment counts are higher than ADA counts, PPF calculations based on enrollment counts result in lower per–pupil rates.
A Final Consideration—PPF Levels Do Not Shed Light on Actual Support Per Pupil. Regardless of the formula used, PPF calculations represent averages. None of these numbers reflects the actual amount of money that was spent on a particular student in a particular district. Funding is distributed to districts in varying amounts (due to categorical formulas and historical allocation factors) and districts may make different choices in spending. Thus, actual spending per student varies significantly across districts and school sites.
One of the most commonly cited sources of PPF is the National Center for Education Statistics (NCES), which is a division of the United States Department of Education. The NCES calculates PPF for each state and publishes the comparisons. The total PPF reflected for each state includes two components: (1) student support expenditures, and (2) other expenditures. The student support category includes teacher salaries, staff development, instructional materials, libraries, health services, nutrition, operations, and maintenance. The “other” category includes capital outlay and school debt. The NCES excludes funding for direct support of state educational agencies. The NCES uses enrollment as the measure of student counts.
California Ranks Right in the Middle of the Pack. Figure 1 shows the NCES PPF rankings by state for 2003–04 (the most recent data available). As shown in the figure, California provided $9,266 per pupil in 2003–04. Excluding capital outlay and interest on debt, it provided $7,673 per pupil. It ranked 25th among the states, spending slightly less than the national average.
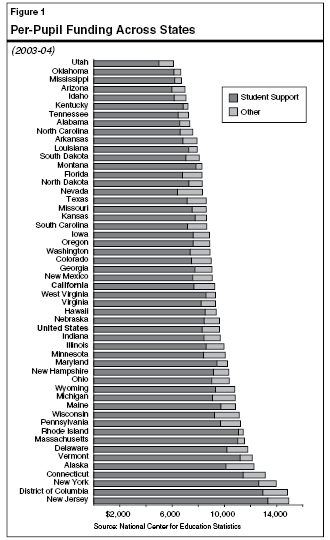
Figure 2 shows PPF by funding source for 2008‑09 (as proposed by the Governor) and the two preceding years. Proposition 98 funding (both state and local shares) totals $8,368 per pupil using anticipated ADA for 2008‑09. (This amount is lower than the Governor's reported Proposition 98 PPF of $8,458 because it does not include one–time funding for the Quality Education Investment Act.) By adding in other state funding, federal funds, and other local funds, a total PPF of $11,626 is proposed.
|
|
|
Figure 2
Detailed Breakdown of Per-Pupil Funding (PPF) in California |
|
|
Actual 2006‑07 |
Revised 2007‑08 |
Proposed 2008‑09 |
Changes From 2007‑08 |
|
Amount |
Percent |
|
Proposition 98 |
|
|
|
|
|
|
State General Fund |
$6,261 |
$6,327 |
$6,018 |
-$309 |
-4.9% |
|
Local property tax revenue |
1,975 |
2,186 |
2,351 |
164 |
7.5 |
|
Subtotals, Proposition 98 |
($8,235) |
($8,513) |
($8,368a) |
(-$145) |
(-1.7%) |
|
Other
Funds |
|
|
|
|
|
|
State General Fund, Non-Proposition 98 |
$517 |
$817 |
$760 |
-$57 |
-7.0% |
|
State Lottery funds |
164 |
158 |
159 |
1 |
0.5 |
|
Federal funds |
1,148 |
1,131 |
1,072 |
-59 |
-5.2 |
|
Other local funds |
1,214 |
1,315 |
1,267 |
-48 |
-3.7 |
|
Subtotals, Other Funds |
($3,044) |
($3,421) |
($3,258) |
($164) |
(-4.8%) |
|
K-12 Totalsb |
$11,279 |
$11,935 |
$11,626 |
-$308 |
-2.6% |
|
Inflation-Adjusted Totalsc |
$12,099 |
$12,232 |
$11,626 |
-$606 |
-5.0% |
|
|
|
a The
Governor reports a Proposition 98 PPF of $8,458. The $90
difference is due primarily to the treatment of Quality
Education Investment Act (QEIA) funding. Whereas the
Governor reflects the QEIA appropriation in his
Proposition 98 level, we include it in the
Non-Proposition 98 category, as it technically is provided
in addition to ongoing Proposition 98 funding level. |
|
b Totals may
not add due to rounding. |
|
c Reflects
2008‑09 dollars. |
|
|
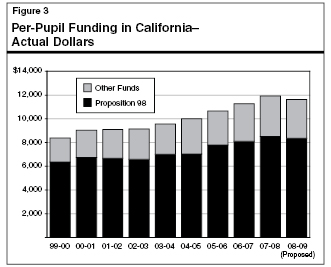
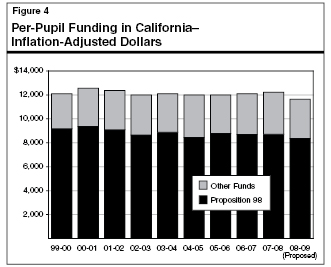
Adjusting for Inflation, PPF Has Been Relatively Flat. Figure 3 shows that PPF in California has increased nearly $3,000 over the last ten years. Adjusting for inflation, however, allows for more meaningful comparisons of PPF over time, as this demonstrates purchasing power in present dollar terms. Figure 4 shows that PPF in California in adjusted terms has remained relatively flat over the last decade.
Return to Education Table of Contents, 2008-09 Budget AnalysisReturn to Full Table of Contents, 2008-09 Budget Analysis