As part of the February and July 2009 budget packages, the state adopted various proposals designed to provide school districts with additional flexibility. During the same period, the federal government provided California with substantial stimulus funding that could be used for K–12 education. In the fall of 2009, we distributed a survey to all public school districts in California to better understand the effect of these recent state and federal actions. Most significantly, we sought information regarding the degree to which school districts were making use of the newly granted flexibility to shift funds among, as well as away from, approximately 40 state–funded categorical programs. In addition, we asked how districts were changing services as a result of having freedom from the associated state program requirements. We also asked when and how districts were spending their federal stimulus funds. Finally, we asked districts to identify additional types of flexibility they would find helpful.
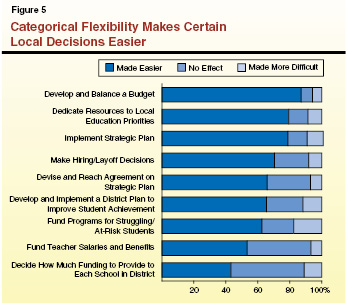
Categorical Flexibility Having Positive Impact on Local Decision Making. We found that the newly granted categorical flexibility was having a positive impact on many school districts’ ability to make certain decisions. Specifically, two–thirds of responding districts reported that categorical flexibility made developing and reaching agreement on a strategic plan easier, with three–fourths of districts indicating that categorical flexibility made implementing their strategic plan easier. The vast majority of districts also reported that categorical flexibility made it easier to develop and balance a budget, dedicate resources to local education priorities, make staffing decisions, and fund programs for struggling students.
Districts Relying Heavily on Categorical Flexibility. Most districts also indicated that they were relying heavily on their newly granted authority to shift funds away from the “flexed” categorical programs. In particular, districts reported shifting some funds away from flexed programs that did not support direct K–12 classroom instruction (such as adult education, deferred maintenance, professional development, and school safety) as well as from flexed programs that might be considered enrichment or supplemental student support (such as art and music, gifted education, supplemental instruction, and counseling). Few districts reported shifting funds into flexed programs. Thus, the majority of districts generally appear to be using freed–up categorical funds to support core classroom instruction.
Some Flexed Programs Already Discontinued, Others Protected. Apart from the general trend of shifting some funds from flexed programs to the core instructional program, some districts already have discontinued (that is, entirely defunded) some flexed programs while protecting other flexed programs. Most significantly, one in three responding districts reported that they discontinued Ninth–Grade Class Size Reduction (CSR) in 2009–10. One in five responding districts discontinued programs for art and music, counseling, and adult English tutoring. One in ten responding districts discontinued programs for struggling veteran teachers, professional developments institutes, gifted education, and general school and library improvement activities. In notable contrast to these programs, about half of responding districts reported making no programmatic changes and shifting no funds away from Community Day Schools, a program for teenage mothers, and an alternative pathway program for teachers.
Districts Differ Regarding When, but Generally Not How, They Are Spending Federal Stimulus Funding. Given the more than $6 billion in federal stimulus funding for K–12 education that California received last year, our survey also contained questions intended to help the Legislature better understand how this funding affected districts’ overall staffing levels and categorical activities. The survey contained associated questions relating to both timing and use of these monies. With regard to timing of expenditures, our survey revealed notable differences among districts. While districts, on average, reported using 20 percent of federal stimulus funds in 2008–09 and 60 percent in 2009–10, with 20 percent reserved for 2010–11, the survey revealed that about 40 percent of districts were spending virtually all their stimulus funding in 2009–10 alone. In contrast, about a quarter of districts were splitting stimulus funds about evenly between 2009–10 and 2010–11. Despite differences in the timing of expenditures, the survey revealed that most districts were using the stimulus funds for generally the same purposes—with roughly two–thirds of the funds being used to minimize teacher layoffs and the remainder used to backfill reductions to categorical programs and make various one–time purchases.
Recommend Providing School Districts With Additional Flexibility. Based on our survey findings, coupled with our ongoing assessment of the state’s categorical programs and statutory requirements, we conclude this report by laying out several recommendations for providing school districts with more flexibility. Specifically, we recommend the Legislature convert three now stand–alone programs (K–3 CSR, Home–to–School (HTS) Transportation, and After School Safety and Education) into flexed programs. As is the case with the other currently flexed categorical programs, this would allow districts to use associated funding for any high priority and exempt them from the programs’ underlying statutory requirements. We also recommend consolidating two other stand–alone programs—merging the smaller, more narrowly focused English Language Acquisition Program (ELAP) into the much larger, more broad–based Economic Impact Aid (EIA) program. In addition, we recommend consolidating five K–12 career technical education programs and eliminating the associated programmatic requirements in favor of monitoring related student outcomes. Furthermore, we recommend the Legislature remove certain statutory restrictions that relate to contracting out for noninstructional services, substitute teaching, state school improvement activities, and mandated education activities. Each of these recommendations is designed to give school districts additional flexibility not only to help weather the economic downturn but also to help maximize program effectiveness and eliminate inefficiencies.
This report highlights the major findings of a survey we distributed to all California public school districts in the fall of 2009. The survey was designed to gather information about the impact of recent state and federal actions affecting school district finance and operations. Below, we (1) provide background information on these recent developments, (2) present major findings from the survey, and (3) offer recommendations that the Legislature could implement in 2010–11 to provide school districts with additional flexibility. The report also has an Appendix that contains a complete listing of survey questions and results.
As part of the February and July 2009 budget packages, the Legislature adopted several proposals that provided school districts with temporary relief from certain state requirements. By offering districts more flexibility, the Legislature was trying to help districts adjust to reduced state funding while also streamlining the state’s complex system of K–12 categorical funding. At the federal level, actions also were taken to help states and school districts weather the recession. Most significantly, the federal government provided California with considerable stimulus funding for K–12 education—much of which could be used by districts to mitigate reductions in state funding. Below, we describe the flexibility options the state recently granted to districts and discuss the federal stimulus funding for K–12 education. We then provide some basic information on our survey and the districts that responded to it.
Last year, the state temporarily suspended various statutory and regulatory requirements affecting school districts. Each of the major changes is discussed in more detail below.
February 2009 Budget Package Suspends Many Categorical Program Requirements. Prior to 2008–09, the state separately funded approximately 60 K–12 categorical programs. For each of these categorical programs, school districts were required to use program monies to meet associated program requirements. Chapter 2, Statutes of 2009 (ABX4 2, Evans), essentially combined approximately 40 of these categorical programs into a “flex item” (see Figure 1). That is, a single statutory code section referenced all 40 programs and allowed school districts to shift funds among the 40 categorical programs or redirect the funds and use for any other educational purpose. (Colloquially, these programs are sometimes referred to as Tier 3 programs.) Local governing boards are required to discuss and approve the proposed use of these flexed funds at a regularly scheduled open public hearing. From a fiscal perspective, the flex item effectively converted $4.5 billion, or 38 percent of all categorical funding, from restricted to unrestricted monies. School districts are granted this flexibility from 2008–09 through 2012–13. The state continues to separately fund the remaining approximately 20 categorical programs (see Figure 2)—reflecting $7.5 billion, or 62 percent, of all categorical funding. (Colloquially, these programs are sometimes referred to as Tier 1 programs, if they were not subject to funding reductions in recent years, or Tier 2 progams, if they were subject to reductions.) Funding for these excluded programs remains linked to all associated program requirements.
Figure 1
K–12 Categorical Programs in Flexibility Item
(In Millions)
|
Program
|
2009–10
Funding
|
|
Targeted Instructional Improvement Block Grant
|
$855
|
|
Adult education
|
635
|
|
Regional Occupational Centers and Programs
|
385
|
|
School and Library Improvement Block Grant
|
370
|
|
Supplemental instruction
|
336
|
|
Instructional Materials Block Grant
|
334
|
|
Deferred maintenance
|
251
|
|
Professional Development Block Grant
|
218
|
|
Grade 7–12 counseling
|
167
|
|
Charter schools categorical block grant
|
136
|
|
Teacher Credentialing Block Grant
|
90
|
|
Arts and Music Block Grant
|
88
|
|
School Safety Block Grant
|
80
|
|
Ninth–Grade Class Size Reduction
|
79
|
|
Pupil Retention Block Grant
|
77
|
|
California High School Exit Exam supplemental instruction
|
58
|
|
California School Age Families Education
|
46
|
|
Professional Development Institutes for Math and English
|
45
|
|
Gifted and Talented Education
|
44
|
|
Community Day Schools
|
42
|
|
Community Based English Tutoring
|
40
|
|
Physical Education Block Grant
|
34
|
|
Alternative Credentialing/Internship programs
|
26
|
|
Peer Assistance and Review
|
24
|
|
School Safety Competitive Grants
|
14
|
|
California Technology Assistance Projects
|
14
|
|
Certificated Staff Mentoring
|
9
|
|
County offices of education Williams audits
|
8
|
|
Specialized Secondary Programs
|
5
|
|
Principal Training
|
4
|
|
American Indian Education Centers
|
4
|
|
Oral health assessments
|
4
|
|
Advanced Placement fee waivers
|
2
|
|
National Board certification incentive grants
|
2
|
|
Bilingual teacher training assistance program
|
2
|
|
American Indian Early Education Program
|
1
|
|
Reader services for blind teachers
|
—a
|
|
Center for Civic Education
|
—a
|
|
Teacher dismissal apportionments
|
—a
|
|
California Association of Student Councils
|
—a
|
|
Total
|
$4,529
|
Figure 2
K–12 Categorical Programs Excluded From Flexibility Item
(In Millions)
|
Program
|
2009–10
Funding
|
|
Special education
|
$3,150
|
|
K–3 Class Size Reduction
|
1,485
|
|
Economic Impact Aid
|
1,008
|
|
After School Safety and Education
|
547
|
|
Home–to–School Transportation
|
496
|
|
Quality Education Investment Act
|
355
|
|
Child nutrition
|
134
|
|
Student assessments
|
69
|
|
English Language Acquisition Program
|
51
|
|
Year–Round school grants
|
47
|
|
Charter school facility grants
|
45
|
|
Partnership Academies
|
19
|
|
Apprentice programs
|
16
|
|
Foster youth programs
|
15
|
|
Adults in correctional facilities
|
15
|
|
County office oversight
|
9
|
|
K–12 High–Speed Network
|
8
|
|
Agricultural vocational education
|
4
|
|
Total
|
$7,473
|
District Allocations “Locked In” for Next Few Years. Prior to 2008–09, funding for the categorical programs that are now flexed was allocated to school districts based mostly on program–specific factors. For example, a district’s Teacher Credentialing Block Grant allocation was based on its number of first– and second–year teachers, its Peer Assistance and Review allocation was based on 5 percent of its total certificated classroom teacher count, and its Art and Music Block Grant allocation was based on its K–12 pupil count. Under the provisions of the 2009 budget package, districts’ allocations for the next few years will not be linked to these program–specific factors. Instead, a district’s allocation for each flexed program will be based on its share of total program funding either in 2008–09 or 2007–08 (the earlier year was used for certain participation–driven programs). As a result, total funding provided for the flexed programs could change over the next few years depending on state actions, but districts’ proportional share of the total allocation will not change. That is, an individual district’s allocations will not be linked to changes in its demographics or program participation rates.
February and July Budget Packages Contain Several Additional Flexibility Options. In addition to freeing up substantial categorical funding, the state adopted various other flexibility provisions last year (see Figure 3). Similar to categorical flexibility, these other flexibility options largely are intended to provide districts some relief during a difficult fiscal climate, with most of the options operative only through 2012–13.
Figure 3
Other Flexibility Options Contained in Recent Budget Packages
2008–09 to 2012–13 (Unless Otherwise Noted)
|
Provision
|
Description
|
|
Eases K–3 Class Size Reduction requirements
|
Allows districts to exceed 20 students per K–3 classroom without losing as much funding as under previous rules (2008–09 through 2011–12).
|
|
Reduces requirement for routine maintenance deposit
|
Lowers the percentage districts must set aside for maintenance of school buildings from 3 percent to 1 percent of expenditures. Districts with facilities in good repair are exempt from any set–aside requirement.
|
|
Eliminates local spending requirement to qualify for state deferred maintenance match
|
Eliminates requirement that districts spend their own funds on deferred maintenance in order to qualify for state dollars.
|
|
Allows access to categorical fund balances
|
Allows districts to spend ending categorical balances (except in seven programs) for any purpose (2008–09 and 2009–10 only).
|
|
Postpones instructional materialpurchase timeline
|
Postpones requirement that districts purchase new instructional material packages.
|
|
Reduces instructional time requirements
|
Provides school districts option to reduce length of school year by as many as five days.
|
|
Allows revenue from sale of surplus property to be retained
|
Allows districts to use the proceeds of surplus property sales for any purpose if property was purchased entirely with local funds.
|
The American Recovery and Reinvestment Act (ARRA) of 2009 provided California with approximately $6 billion in federal stimulus funding designated for various K–12 purposes. Most significantly, ARRA provided California with roughly $3 billion in State Fiscal Stabilization Funding for K–12 education, $1.5 billion in Title I funding, and $1.3 billion in Individuals With Disabilities Education Act (IDEA) funding. The stabilization funding was generally shared among all districts to help mitigate reductions in state funding. The Title I funding provided additional support to districts with low–income students. (Most districts receive some Title I funding.) The IDEA funding provided additional support for districts’ special education costs. All of the federal stimulus funding is one–time in nature, with districts required to obligate the funds by September 30, 2011.
Federal Stimulus Funding Intended to Serve Multiple Purposes. The federal stimulus funding was intended to help school districts in several ways. One of the federal objectives was to minimize districts’ need to lay off teachers and other school staff. The other primary federal objective was to stimulate the economy by encouraging districts to use their one–time ARRA funding to make various one–time purchases, such as upgrading computers, purchasing instructional materials, or buying new buses. Additionally, under the IDEA provisions, districts were allowed to reduce their own contributions to special education by up to half of the federal IDEA increase. In essence, this allowed districts to free up some existing special education monies and redirect them to core classroom functions.
While the flexibility provisions are operative, we plan to distribute an annual school district finance and flexibility survey to learn how districts are responding to them. In the fall of 2009, we distributed our first survey—sending every superintendent of a California public school district an email containing a link to the survey. Of California’s 1,043 public school districts, 231 school districts responded, representing 37 percent of the state’s total average daily attendance (ADA). We received responses from five of the ten largest school districts in California. We plan to administer comparable surveys in the fall of 2010, 2011, and 2012.
Survey Respondents Reflective of State. Figure 4 lists several demographic factors and compares our survey respondents with the statewide average. As shown, the socioeconomic composition of districts that responded to our year–one survey is fairly representative of the socioeconomic composition of all students in the state. The percentage of African–Americans, Asians, and English Learner students represented by districts in our survey are within 1 percent of the total percentage statewide. Whites, however, were slightly under–represented whereas Latinos and students eligible for free or reduced–price lunches were slightly overrepresented in our survey.
Figure 4
Survey Respondents Fairly Representative of State
|
|
Percent of Student Population:
|
|
Student Characteristic
|
Survey Respondents
|
Total Statewide
|
Difference
|
|
African–American
|
8.0%
|
7.3%
|
0.7%
|
|
Asian
|
9.3
|
8.4
|
0.9
|
|
White
|
24.9
|
27.9
|
–3.0
|
|
Latino
|
50.8
|
49.0
|
1.8
|
|
English Learners
|
25.2
|
24.2
|
1.0
|
|
Eligible for Free and Reduced–Price Meal program
|
57.6
|
53.6
|
4.0
|
This section highlights eight major findings from the survey.
Positive Impact on Local Decision Making. Many districts reported that the newly granted categorical flexibility had positive effects on local decision making (see Figure 5). For example, two–thirds of responding districts indicated that categorical flexibility made developing and reaching agreement on a strategic plan easier, with three–fourths indicating that it was easier to implement their strategic plan. The vast majority of districts also reported that categorical flexibility made it easier to develop and balance a budget, dedicate resources to local education priorities, make staffing decisions, and fund programs for struggling students.
Significant Funds Being Shifted Away From Many Categorical Programs in Flex Item, Likely to Classroom Instruction. The vast majority of responding districts reported shifting funds away from programs in the flex item (see Figure 6). In particular, districts reported shifting funds away from categorical programs that did not fund direct K–12 classroom instruction. For example, more than 60 percent of responding districts reported they were shifting funds away from deferred maintenance, professional development, school safety, and adult education. Additionally, districts reported shifting funds away from categorical programs that might be considered enrichment or supplemental student support. For example, more than 60 percent of responding districts reported shifting funds away from the Art and Music Block Grant, Gifted and Talented Education (GATE), supplemental instruction for struggling students, and Grade 7–12 School Counseling. Ninth–Grade CSR and instructional materials also were significantly affected, with almost three–fourths and two–thirds of responding districts, respectively, shifting away funds. Few districts reported shifting funds to categorical programs—suggesting funds shifted away from categorical programs were used to cover core instructional costs.
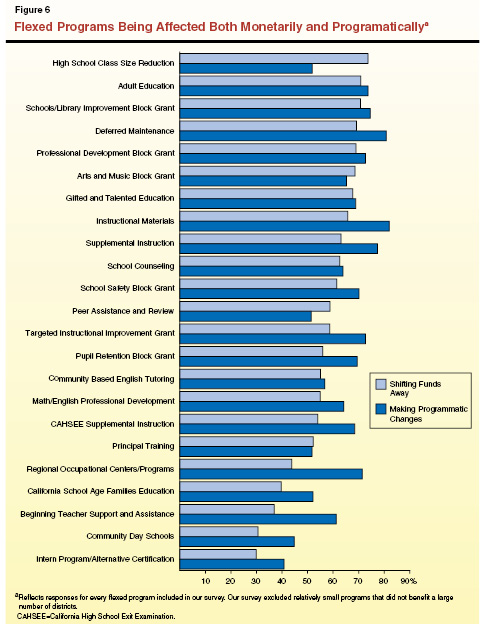
Programmatic Changes Also Occurring. Not only are many districts shifting funds away from flexed programs, but many also reported they were making changes to the associated services they were providing (see Figure 6). For example, more than 70 percent of responding districts reported that they were making major or minor programmatic changes to adult education, Regional Occupational Centers and Programs (ROC/Ps), supplemental instruction, the Professional Development Block Grant, the School Safety Block Grant, the School and Library Improvement Block Grant, Targeted Instructional Improvement Grant, instructional materials, and deferred maintenance. These are many of the same programs for which districts shifted away funds.
Some Districts Discontinuing Certain Categorical Activities. For the 2009–10 school year, some districts decided to stop operating a few of the programs included in the flex item. (As described in the background section, this is allowable under the provisions of the flex item.) Most notably, more than one–third of responding districts discontinued Ninth–Grade CSR. Roughly one in every five responding districts stopped adhering to the program requirements associated with the Art and Music Block Grant, Grade 7–12 School Counseling, and Community Based English Tutoring. Roughly one in every ten responding districts discontinued Peer Assistance and Review, GATE, activities associated with the School and Library Improvement Block Grant, and their participation in the Math and Reading Professional Development Institutes.
Some Districts “Protecting” A Few Flexed Programs. Though no program in the flex item was entirely unaffected from a statewide fiscal or program perspective, a few programs appear less affected than others. Most notably, more than half of responding districts reported making no funding reductions to the Alternative Certification/Internship program, Community Day Schools, and the California School Age Families Education program. Similarly, about half of responding districts reported making no substantive changes to these three programs.
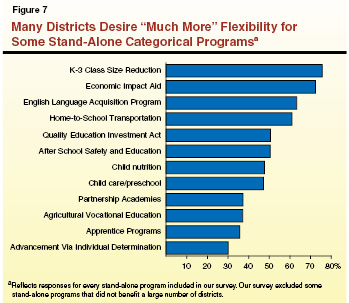
More Than Half of Districts Want Much More Flexibility for Some Categorical Programs Now Excluded From the Flex Item. In addition to gathering information regarding how districts were responding to the new categorical flexibility, our survey asked districts if they desired more flexibility to operate the categorical programs currently excluded from the flex item. Most notably, as shown in Figure 7, more than half of responding districts reported that they desired much more flexibility to operate the K–3 CSR program, EIA, ELAP, HTS Transportation, After School Safety and Education (ASES), and the Quality Education Investment Act (QEIA).
Federal Stimulus Funds Help Mitigate Layoffs and Categorical Reductions. Our survey also asked districts both when and how they were using federal stimulus funding. These questions were intended to help the Legislature better understand how the federal stimulus funding affected districts’ decisions regarding both overall staffing levels and categorical activities. In response to our survey question on timing, districts reported they were using, on average, 20 percent of their federal stimulus monies in 2008–09, 60 percent in 2009–10, and 20 percent in 2010–11. Districts reported that they were using, on average, 62 percent of their federal stimulus dollars for preventing teacher layoffs, 19 percent for backfilling reductions to categorical programs, 12 percent for one–time investments, 7 percent for various other purposes, and less than 1 percent for increasing teacher compensation.
Notable Differences in Districts’ Timing of Federal Stimulus Spending, Not Use. These average response rates, however, appear to mask two common types of districts. One group (reflecting about 40 percent of responding districts) spent the bulk of the federal stimulus monies in 2009–10 alone. The other group (reflecting about a quarter of responding districts) split the federal stimulus funding roughly in half across 2009–10 and 2010–11. Despite this difference in timing of expenditures, the two groups of districts spent the stimulus funds in similar ways. Among both groups, more than two–thirds of federal stimulus was used to minimize teacher layoffs, with the remainder used largely to backfill categorical reductions and make one–time investments. (No major trends emerged across the other 35 percent of districts. For example, relatively small numbers of districts reported using the bulk of stimulus funds in 2008–09, splitting the funds between 2008–09 and 2009–10, or dividing the funds somewhat evenly across all three years.)
In this section, we make various recommendations for providing school districts with additional flexibility. Our recommendations are based on our survey findings as well as our ongoing assessment of the state’s categorical programs and statutory requirements. Figure 8 summarizes these recommendations, each of which is discussed in more detail below. (In addition, in the nearby box, we discuss existing problems with districts’ flex–funding allocations and offer a solution that would link district allocations with ADA.)
Figure 8
Summary of LAO Recommendations for Providing Additional Flexibility
|
Recommendations
|
Affected Programs
|
|
Add three programs to flex item
|
|
|
|
- Home–to–School Transportation
|
|
|
- After School Safety and Education
|
|
Consolidate one program into Economic Impact Aid
|
- English Language Acquisition Program
|
|
Consolidate five Career Technical Education programs
|
- Regional Occupational Centers and Programs
|
|
|
- Specialized secondary programs
|
|
|
|
|
|
|
|
|
- Agricultural vocational education
|
|
Ease or remove state restrictions in four areas
|
- Contracting out for noninstructional services
|
|
|
- Hiring/pay rates for substitute teachers
|
|
|
- Quality Education Investment Act requirementsa
|
|
|
- Certain mandated activities
|
|
Align CDE staffing levels with flex decisions
|
- Cut $10 million and eliminate 150 positions
|
|
Uncertainty Over Access to Flexed Categorical Funding for New Schools. In establishing the flex item, the state “froze” each district’s and charter school’s funding allocation at its respective share of the 2008–09 appropriation for each categorical program. (The 2007–08 appropriation was used for a handful of categorical programs.) Associated legislation allowed newly opened schools (either new charter schools or new schools in growing districts) to apply prospectively for individual programs within the flex item—contingent upon additional funds being provided in the budget—but it explicitly prohibited districts from receiving additional funds if they established a new school simply by redirecting enrollment from existing schools. The legislation, however, leaves several questions unanswered:
- How should the state determine whether a school consists of redirected enrollment or “new” students?
- Are new schools eligible for all 40 categorical programs in the flex item? At what rate(s) should they be funded? (Some allocations for programs in the flex item vary widely among districts and few districts receive funding for every program.)
- Will new schools have immediate flexibility over the funds, or do they need to run the programs based on former categorical rules for some length of time to justify eligibility? If the latter, how will compliance be monitored given the state has stopped tracking program compliance for existing schools and districts?
Allocation Methodology for Existing Districts Also Problematic. Not only does uncertainty exist over how to fund new schools, but the distribution of flexed funds for existing districts also is problematic. Because the legislation “locks” districts into receiving the share of categorical funds they received in 2008–09, no adjustments are to be made over the next few years for changes in a district’s student population. This policy benefits districts with declining enrollments, which get to keep funding originally provided based on students they no longer serve, at the expense of growing districts, which have to serve additional students without receiving any additional funding. The only way a growing district can qualify for more funding to serve their new students is to physically open a new school—not an incentive that the state wants to provide. Moreover, disconnecting funding from student demand leads to uncertainty over how individual program funding formulas will be resurrected if categorical program rules return when flexibility provisions expire in 2013–14. Will allocation formulas resume based on higher per–pupil rates for the districts that have had declining enrollment and lower per–pupil rates for those districts that have experienced enrollment growth? Or, alternatively, will funding suddenly revert to equal per–pupil rates, creating a funding cliff for those districts whose allocations remained artificially high during the flex period?
Recommend Allocating Flex–Item Funding Based on Changes in ADA. To address existing ambiguity over how to fund new schools as well as equity issues for existing districts, we recommend the Legislature modify the methodology used to allocate flex–item funding. Specifically, we recommend the Legislature develop a per–pupil rate for each district by dividing the amount it received for each program in 2008–09 by its total ADA. Moving forward, each district would receive funds based on this per–pupil rate multiplied by its annual ADA, meaning overall funding would increase or decrease based on changes in its student population. (To better estimate funding amounts at the time the budget is enacted, we recommend basing allocations on prior–year ADA.) New charter schools could be funded based on a statewide average rate for the programs in the flex item (similar to the way charter schools have traditionally received categorical funding). New district schools would be accounted for as part of the district’s overall ADA count, eliminating the need to determine whether enrollment had been “redirected.” Additionally, if the Legislature chooses to resurrect individual program formulas and rules in 2013–14, the associated funding adjustments would be less disruptive as the going rates would be better aligned with changes in districts over the next few years. |
As discussed in more detail below, we recommend adding K–3 CSR, HTS Transportation, and ASES to the flex item. Relaxing restrictions on these three programs would provide districts with discretion over roughly $2.5 billion in previously restricted categorical funds.
K–3 CSR Good Candidate for Flex Item. In the February 2009 budget package, the state significantly eased K–3 CSR requirements—applying relatively small funding reductions, or “penalties,” even if K–3 classes increased substantially above the program’s original cap of 20 students per class. For example, under the new rules, a K–3 class with 25 or more students is eligible to receive 70 percent of full funding. (Districts are allowed to increase kindergarten classes up to a statutory maximum of 33 students and grade 1–3 classes up to 32 students and still receive 70 percent of full funding.) Additionally, whereas original funding allocations were linked to the number of classrooms actually participating, districts are now capped at the number of K–3 classes participating as of January 31, 2009. Given these changes, the K–3 CSR program is now only very tenuously linked to its original intention of providing fiscal incentives for schools to decrease particular K–3 classes to no more than 20 students. In addition, more than three–fourths of our survey respondents indicated that they wanted “much more” flexibility over K–3 CSR funds. For all these reasons, we recommend adding the program and its associated funding (roughly $1.5 billion) to the flex item. While many districts already plan to increase K–3 class sizes in 2010–11, this change would allow for more straightforward budgeting, offer districts somewhat more flexibility, and eliminate the need to impose a new round of already questionable CSR penalties.
HTS Transportation Now Good Candidate for Flex Item. Last year, the state excluded the HTS Transportation program from the flex item because at the time the program was being funded with special funds that had to be used for transportation purposes. Under the Governor’s 2010–11 proposal, the HTS Transportation program is funded with Proposition 98 monies. Thus, from a fiscal perspective, we see no reason to continue treating this program differently from most other categorical programs. Moreover, like several other K–12 categorical programs in the flex item, the existing HTS Transportation funding formula is highly problematic, as it is based on historical allocations that have little correlation to districts’ current needs or circumstances regarding the transporting of students to and from school. The existing formula also contains a “use it or lose it” provision that discourages districts from implementing more cost–effective practices, as decreasing costs in one year means losing funding the next year. Furthermore, our survey results suggest districts would benefit from loosening restrictions for this program—with more than 60 percent of respondents indicating that they want much more flexibility over HTS Transportation funds. For these reasons, we recommend adding the program and its associated funding (roughly $500 million) to the flex item. Districts for whom transporting students is a high priority could continue to use funds for this purpose. (Federal law would continue to require that all districts transport special education students who have transportation specified in their individual education plans.)
ASES Continues to Be Good Candidate for Flex Item. Currently, Proposition 49 (which created ASES) requires roughly $550 million in K–12 funds be spent solely on after school programs, without regard to the state’s fiscal condition or other state and local budget priorities. As a result, some districts are having to make changes to core academic services—including increasing class sizes and decreasing instructional days—while supplemental after school activities remain untouched. Given limited resources, after school services might not be the highest instructional priority for many districts. Indeed, more than half of our survey respondents indicated they wanted much more flexibility over ASES funds. For these reasons, we continue to recommend the Legislature place a measure on the ballot to repeal the automatic ASES funding requirement and allow the state to make annual decisions regarding how much to spend on after school services. Should such a measure pass, we recommend the Legislature treat the ASES program consistent with most other K–12 categorical programs and place it in the flex item. This would provide districts the ability to weigh funding for after school activities against other local funding priorities.
Somewhat similar to adding three programs to the flex item, we recommend merging the funds from two programs currently excluded from the flex item and funded as separate programs. Specifically, we recommend merging ELAP and its associated funding ($50 million) into the more broad–based EIA program (almost $1 billion). Whereas ELAP funds must be used to provide services to English learner (EL) students in grades 4–8, EIA supports a broader array of activities benefiting EL and low–income students. While continuing to dedicate funds for the state’s most at–risk students, the merger would grant districts greater flexibility to address their areas of greatest need and allow them to spend associated funds on EL and low–income students of any grade level. It also would reflect districts’ preferences—with roughly two–thirds of our survey respondents indicating they want much more flexibility over ELAP and EL monies. In addition to easing these existing statutory requirements, we also recommend the Legislature free districts from certain regulatory and compliance–related requirements that California Department of Education (CDE) has developed to guide districts’ EIA expenditures. Over the last several years, many districts have reported that these regulations constrain their ability to use EIA funds effectively. By reaffirming statutorily that districts have broad discretion in how to use EIA funds to benefit EL and low–income students, we believe the Legislature could enhance program effectiveness and eliminate existing inefficiencies.
Streamline Funding for CTE. In 2008–09, the state allowed funds associated with two CTE programs serving high school students to be used for any educational purpose while maintaining detailed requirements for three other high school CTE programs. Specifically, the state placed the ROC/P and Specialized Secondary Programs in the flex item while excluding Partnership Academies, Apprenticeship programs, and agricultural vocational education. It was not clear why some CTE programs were included in the flex item while others were excluded. To better coordinate the state’s fractured CTE system and increase local flexibility, we recommend consolidating funding ($427 million) for all five CTE programs. (One such consolidation approach would be to roll the funds into high schools’ revenue limits.)
Focus on Student Outcomes. As part of the consolidation, we would further recommend eliminating most requirements associated with the five programs in favor of monitoring related student outcomes. Under this approach, districts receiving CTE funding would be held accountable for various student outcomes, including the percentage of high school students that enter postsecondary education or begin employment in a high–wage industry. By holding districts more accountable for student engagement and outcomes, the state could ensure students receive the positive benefits of CTE while providing more flexibility to districts in developing effective high school programs.
As discussed below, we also recommend removing certain statutory restrictions that relate to contracting out for noninstructional services, substitute teaching, state school improvement activities, and mandated education activities. We discuss each of these recommendations in more detail in two recent reports—The 2010–11 Budget: Proposition 98 and K–12 Education (February 2010) and Education Mandates: Overhauling a Broken System (February 2010).
Ease State Restrictions on Contracting Out for Noninstructional Services. Under current law, the state allows school districts to contract out for many noninstructional services (such as food service, maintenance, clerical functions, and payroll) only if certain conditions are met. For example, contracting for services cannot be done solely for the purpose of achieving savings. Contracting out also cannot result in the lay off or demotion of existing district employees. These restrictions make it very difficult for school districts to implement the most cost–effective options for providing noninstructional services. We recommend eliminating these restrictions on contracting out to help school districts achieve greater efficiencies in their noninstructional services.
Remove State Restrictions on Priority and Pay for Substitute Teachers. The state currently requires districts to hire substitute teachers based on seniority rankings, with the most senior laid–off teachers given highest priority. Additionally, if a formerly laid–off teacher serves as a substitute more than 20 days in a 60–day period, he/she must be paid at his/her pre–layoff salary rate. This is problematic for two main reasons. First, it reduces districts’ ability to hire the most effective substitute teachers. Second, it imposes a financial strain on districts by forcing them to hire the most expensive substitutes. In contrast, under our recommendation, districts would be able to choose from among the entire pool of substitute teachers and negotiate the wage rate at the local level. This could generate savings at the local level and afford districts a better opportunity to hire the most effective substitute–teaching candidates.
Remove State Restrictions for QEIA Schools Also Subject to Federal School Improvement Program. Currently, the state’s approach to school improvement requires many low–achieving schools to adhere to dozens of overlapping state and federal requirements all meant to achieve the same result. Specifically, QEIA schools are expected to meet certain state–imposed CSR and professional development requirements while simultaneously implementing certain federally imposed turnaround strategies. Perhaps unsurprising given these layers of requirements, more than half of our survey respondents indicated they wanted much more flexibility over QEIA funds. Rather than requiring these low–achieving schools to juggle multiple intervention plans and programs, we recommend aligning state and federal programs for low–achieving schools to the extent possible. Under our recommendation, QEIA schools otherwise subject to both state and federal turnaround requirements would be required only to meet the federal requirements. This would substantially reduce programmatic overlap, confusion, and administrative hassles; allow for more concerted, potentially targeted interventions; and hold affected districts financially harmless. (Reducing overlap between the state and federal programs also would generate substantial near–term savings—almost $700 million over three years.)
Undertake Major K–12 Mandate Reform. In addition to the state’s still–complicated K–12 categorical funding system, the state has an elaborate K–12 mandate system. Whereas the categorical system generally provides districts with funds upfront to meet certain statutory requirements, the mandate system funds districts after they have undertaken the activity and filed a specific type of reimbursement claim with the state. Despite the conceptual similarity between underlying categorical/mandated programmatic requirements, and despite the state’s efforts to streamline the categorical system, the state continues to impose over 40 mandates on K–12 school districts, with associated annual costs of almost $400 million. These mandates are linked with hundreds of specific statutory requirements—many of which do almost nothing to benefit students and educators. Additionally, as a result of how mandates are reimbursed, districts are often rewarded for performing activities inefficiently and ineffectively. Exacerbating matters, at the state level, funds are not allocated for mandates on a regular basis, but are instead deferred to future years. As a result of this practice, which a Superior Court deemed unconstitutional in 2008, the state owes roughly $3.2 billion in outstanding K–12 claims. For all these reasons, we recommend the state engage in comprehensive mandate reform. Specifically, we recommend the Legislature eliminate any K–12 mandate not serving a fundamental statewide interest (such as preserving public health and safety). Our recommended reform package would reduce total state K–12 costs by about $330 million annually.
Despite the state’s decision to essentially eliminate the programmatic requirements associated with the roughly 40 categorical programs in the flex item, the state has made no corresponding changes to the CDE’s staffing of those programs. As a result, CDE has about 150 staff members assigned to administering programs that the state is not now operating. (This disconnect would be amplified if the Legislature were to adopt a more expansive flexibility package this year.) To reflect the impact of consolidating categorical programs on state operations, we recommend decreasing CDE’s budget by $10 million and eliminating roughly 150 positions associated with programs in the flex item.
Given our fall 2009 survey came less than a year after the state and federal governments took major actions affecting K–12 education, our survey results are reflective only of districts’ initial responses. Presumably, changes and trends in district behavior will become more evident after districts have had longer to adjust to the new statutory rules and funding conditions. Changes in district behavior could become much more noticeable and pervasive this coming school year, as the federal stimulus funding that many districts are now using to minimize teacher layoffs and backfill for reductions in categorical funding will begin to dry up. Nonetheless, even the year–one survey responses provide the Legislature with important feedback on how school districts have begun adjusting their behavior.
Taken in their totality, these responses suggest school districts are finding that categorical flexibility is having a positive effect on local decision making and allowing them to make strategic redeployments of flexed dollars. Districts indicate, however, that they are extremely interested in obtaining additional flexibility. Given the state and school districts likely will continue to confront fiscal challenges over the next few years, exploring additional flexibility options is likely to be of critical importance for the Legislature. Each of the recommendations we present in this report would provide school districts with additional flexibility designed not only to help weather the economic downturn but also to help maximize program effectiveness and eliminate inefficiencies.