This report provides our projections of current–law state General Fund revenues and expenditures for 2011–12 through 2016–17.
One year ago, we wrote that the U.S. economic recovery was progressing more slowly than previously expected. Once again, we have to make the same observation. While the economy has some bright spots, including export growth and strength in technology–related service sectors (which are important to California), weakness in the housing market continues to affect both the construction industry and the financial services sector. The end of the federal fiscal stimulus program and declining governmental employment also are limiting economic growth. In this forecast, we project continuation of this slow, arduous recovery, with California's unemployment rate remaining above 10 percent through mid–2014 and above 8 percent through the end of 2017.
Our updated assessment of California's economy and revenues indicate that General Fund revenues and transfers in 2011–12 will be $3.7 billion below the level assumed in the 2011–12 budget package passed in June. Under provisions of the 2011–12 budget package, this revenue shortfall would translate into $2 billion of trigger cuts to various state programs. (This includes all of the "Tier 1" trigger cuts and about three–fourths of the "Tier 2" trigger cuts.) The Director of Finance will determine the actual amount of trigger cuts to K–14 education and several other programs next month based on the higher of this 2011–12 revenue forecast and the forecast of the administration. Our expenditure forecast assumes that this amount of trigger cuts is implemented in 2011–12 and maintained throughout the forecast period.
$3 Billion Deficit at End of 2011–12. The net effect of (1) the lower projected revenues for 2011–12, (2) the trigger cuts, and (3) the expected inability of the state to achieve about $1.2 billion of other budget actions—as well as a few other minor changes—would leave the General Fund with a $3 billion deficit at the end of 2011–12.
$10 Billion Operating Shortfall for 2012–13. In 2012–13, the state will face increased costs due, in part, to the expiration of a number of temporary budget measures adopted in recent years. Most notably, under our forecast methodology (which does not incorporate any effects from a possible November 2012 ballot measure concerning taxes), General Fund Proposition 98 costs—as well as "settle–up" payments to schools—are projected to rise by $6 billion in 2012–13. Moreover, in 2012–13, the state must repay the $2 billion Proposition 1A property tax loan that was used to help balance the budget in 2009. We forecast that the General Fund's 2012–13 operating shortfall (the difference between annual General Fund revenues and expenditures) will be $9.8 billion.
$13 Billion Budget Problem to Solve in 2012. Accordingly, we project that the Legislature and the Governor will need to address a $12.8 billion budget problem between now and the time that the state adopts a 2012–13 budget plan.
One year ago, the state faced ongoing budget imbalances of around $20 billion per year. Now, we forecast that the General Fund's operating shortfalls will be between $8 billion and $9 billion per year in 2013–14 and 2014–15 and then decline gradually to about $5 billion in 2016–17. By making very difficult budgetary decisions—including the trigger cuts—the Legislature and the Governor have strengthened the state's fiscal condition considerably.
Our forecast assumes no inflation increases for many state programs and assumes that the trigger cuts and most other recent program reductions remain in place in future years. Even under this modest budget scenario, the state faces an ongoing, multibillion dollar annual deficit, even as state revenues expand. Our forecast assumes that many billions of dollars of state budgetary and retirement obligations remain unpaid through at last 2017.
The Legislature now faces a much smaller budget problem than projected one year ago and the smallest projected out–year deficits since before the 2007–2009 recession. Unfortunately, there are few easy options left for balancing California's budget. Difficult program reductions already have been passed, and significant one–time budget actions may be more elusive than in prior years. Accordingly, the remaining work of eliminating the state's persistent, annual deficit will require more difficult cuts in expenditures and/or increases in revenues.
If, however, the Legislature and the Governor were to eliminate the state's ongoing annual budget deficit this year or over the course of the next few years, the focus of their efforts could finally shift away from short–term budget problems and turn to the serious long–term fiscal issues of the state's accumulated budgetary obligations and unfunded retirement liabilities.
This report provides our projections of the state's General Fund revenues and expenditures for 2011–12 through 2016–17. Our projections primarily reflect current–law spending requirements and state tax provisions, while relying on our independent assessment of the outlook for California's economy, demographics, revenues, and expenditures. This report aims to assist the Legislature with its fiscal planning as it begins to consider the 2012–13 budget. The basis of our estimates is described in the nearby box.
Basis for Our Estimates
Our revenue and expenditure forecasts are based primarily on the requirements of current law, including constitutional provisions (such as the Proposition 98 minimum guarantee for school funding), statutory requirements, and current state tax policies. The estimates incorporate effects of projected changes in caseloads, federal requirements, and other factors affecting program costs. The estimates are not predictions of what the Legislature and the Governor will adopt as policies and funding levels in future budgets. Instead, our estimates are intended to be a reasonable baseline of what would happen if current–law policies continue to operate in the future.
Impact of Future Ballot Measures Not Considered. Because our forecast is based primarily on current law, our projections do not consider the future effects of ballot measures scheduled or proposed for future statewide elections. For example, we have not assumed passage of a November 2012 measure increasing General Fund revenues, as referenced in the budget package. As described in the "Proposition 98" section of Chapter 3, this results in the creation of additional Proposition 98 payment obligations during the forecast period.
No COLAs or Inflation Adjustments Assumed. Consistent with the state's policies in recent years, we generally have not assumed annual cost–of–living adjustments (COLAs) or price increases over the forecast period. There are, however some exceptions. For example, the state is required to maintain specific benefits in its health programs, which include inflationary increases. If, by contrast, our forecast included COLAs and price increases for all programs, General Fund costs would be higher by around $3 billion by 2016–17.
Assumption That State Prevails in Court Cases. Any multiyear state budget forecast involves various legal uncertainties. Our forecast generally assumes that the state prevails in active, budget–related court cases. The state faces an array of active cases, including ones related to redevelopment agencies, health and social services reductions, and the exclusion of sales tax revenues from Proposition 98 calculations. Our projections, however, do not reflect a transfer of $1 billion from Proposition 10 early childhood education programs to reduce General Fund spending, to be consistent with the treatment of these funds in the 2011–12 budget package.
Trigger Cuts Ongoing. Our projections include the impact of the trigger cuts beginning in 2011–12 and continuing through the forecast period.
Federal Tax and Spending Policies Uncertain. The activities of the congressional "super committee" charged with developing a deficit reduction plan—as well as various soon–to–expire temporary federal tax policies—mean that there is an unusually large element of uncertainty about future federal policies. As described in "Chapter 2," we therefore must make a number of assumptions about these matters. In general, our expenditure forecasts assume continuation of current federal policies. Future federal actions that are contrary to these assumptions could affect various elements of our forecast positively or negatively.
Chapter 41, Statutes of 2011 (AB 121, Committee on Budget), specifies that the Department of Finance (DOF) will compare the Legislative Analyst's Office's (LAO's) November 2011 revenue forecast with its December 2011 revenue forecast to determine the extent to which midyear expenditure reductions (referred to as the "trigger cuts") will be put in place. Figure 1 shows our estimate of the condition of the General Fund through the end of 2012–13 assuming no additional corrective budgetary actions. As we discuss in more detail below, our forecast assumes that most of the trigger cuts are implemented in 2011–12 and remain in effect through the rest of our forecast period.
Figure 1
LAO Projections of General Fund Condition If No Corrective Actions Are Taken
(In Millions)
|
|
2010–11
|
2011–12
|
2012–13
|
|
Prior–year fund balances
|
–$4,507
|
–$1,695
|
–$2,239
|
|
Revenues and transfers
|
94,292
|
84,764
|
86,038
|
|
Expendituresa
|
91,480
|
85,308
|
95,787
|
|
Ending fund balance
|
–$1,695
|
–$2,239
|
–$11,988
|
|
Encumbrances
|
770
|
770
|
770
|
|
Reserveb
|
–$2,465
|
–$3,009
|
–$12,758
|
The 2011–12 budget package assumed a year–end reserve of about $500 million. We now estimate that the General Fund will close the fiscal year with a $3 billion deficit. (Contributing to this deficit is an estimated $500 million drop in 2010–11 revenues compared with the level assumed in the budget package.) In 2012–13, expenditures are projected to exceed revenues by $10 billion. This would leave the state with a year–end deficit of about $13 billion, absent any additional budgetary corrections. Accordingly, the Legislature and the Governor will have to address this magnitude of problem between now and the time a 2012–13 state budget plan is approved.
Provision for Midyear Expenditure Reductions in the Enacted Budget. The 2011–12 budget package assumed a total of $88.5 billion of General Fund revenues and transfers. The budget also contained trigger cuts that would take effect if revenues for 2011–12 were forecast to be less than the amount assumed in the budget package by $1 billion or more. There are two tiers of potential trigger cuts: first, if revenues are forecast to be $1 billion or more below the budget level, and second, if revenues are forecast to be $2 billion or more below. The second tier of cuts—all of which affect K–14 education—is prorated depending upon how much revenues are below the budget level. All the trigger cuts may be put in place if revenues are $4 billion or more below the level assumed in the budget.
Under Our Forecast, Most Trigger Cuts Assumed to Be Put in Place. We forecast that revenues will be $3.7 billion below the budget act amount in 2011–12. As such, under our forecast, a total of $2 billion of midyear expenditure reductions is assumed to be implemented by the Governor on January 1, 2012 (see Figure 2). This represents all of the "Tier 1" trigger cuts and three–fourths of the "Tier 2" trigger cuts. The assumed future effects of the trigger cuts are also shown in Figure 2. The ultimate magnitude of the trigger cuts will be determined by the administration after it compares our revenue forecast with its December forecast. The higher of the two forecasts will be used to determine the level of reductions. (The administration may implement less than the maximum amount of trigger cuts. Our forecast, however, assumes the maximum amount of trigger cuts based on our forecasted revenue levels.)
Figure 2
Trigger Reductions to General Fund Expenditures by Program Area
(In Millions)
|
|
2011–12
|
2012–13
|
2013–14
|
2014–15
|
2015–16
|
2016–17
|
|
Tier 1 Trigger Cuts
|
|
|
|
|
|
|
|
Reduce University of California budget
|
$100
|
$100
|
$100
|
$100
|
$100
|
$100
|
|
Reduce California State University budget
|
100
|
100
|
100
|
100
|
100
|
100
|
|
Reduce funding developmental services
|
100
|
100
|
100
|
100
|
100
|
100
|
|
Reduce service hours in IHSS by 20 percent and anti–fraud efforts
|
110
|
210
|
210
|
210
|
210
|
210
|
|
Increase charges to counties for youthful offenders sent to CDCR facilities and reduce CDCR budget
|
99
|
166
|
159
|
154
|
152
|
151
|
|
Reduce community college apportionmentsa
|
30
|
—
|
—
|
—
|
—
|
—
|
|
Reduce child care funding
|
17
|
17
|
17
|
17
|
18
|
19
|
|
Eliminate state grants for local libraries
|
16
|
16
|
16
|
16
|
16
|
16
|
|
Eliminate vertical prosecution grants
|
15
|
15
|
15
|
15
|
15
|
15
|
|
Extend Medi–Cal provider cuts and copayments to all managed care plans
|
15
|
15
|
15
|
15
|
15
|
15
|
|
Reduce preschool fundinga
|
6
|
—
|
—
|
—
|
—
|
—
|
|
Total Tier 1 Trigger Cuts
|
($608)
|
($739)
|
($732)
|
($727)
|
($726)
|
($726)
|
|
Tier 2 Trigger Cuts
|
|
|
|
|
|
|
|
Proposition 98 reductionsa
|
$1,436
|
—
|
—
|
—
|
—
|
—
|
|
Total Trigger Reductions
|
$2,044
|
$739
|
$732
|
$727
|
$726
|
$726
|
As a result of our lower 2011–12 revenue forecast ($3.7 billon lower than the budget package) and the offsetting level of trigger cuts we assume ($2 billion), the net deterioration in the General Fund condition in the current year due to our lower revenue estimate is $1.7 billion.
Other Budget Actions at Risk. In our forecast, we assume that the state will be unable to achieve $1.2 billion in planned 2011–12 budget solutions. Some of the major issues are:
- Medi–Cal. Higher Medi–Cal costs of around $400 million seem likely due, in large part, to delayed federal approval for cost–cutting measures.
- Redevelopment. Our forecast assumes that the state will not be able to realize the full amount of the budgeted savings from this year's redevelopment agency legislation. We estimate that the state will only be able to achieve $1.4 billion in savings—$300 million less than was budgeted.
- Savings From State Operational Efficiencies. The budget package assumed that the administration would reduce General Fund departmental costs by $250 million through efficiencies in departmental operations and other cost–reduction measures. Our forecast assumes that much of this savings is unachievable.
$3 Billion General Fund Deficit Forecast for 2011–12. As shown in Figure 1, given these various issues, we forecast that 2011–12 will end with a General Fund deficit of $3 billion.
Proposition 98 and Other Costs Contribute to Estimated $13 Billion Budget Problem. In 2012–13, the state will face increased costs due, in part, to the expiration of a number of temporary budget measures enacted in recent years. Most notably, under our forecast methodology (which does not incorporate any effects from a possible November 2012 ballot measure concerning taxes), General Fund Proposition 98 costs are projected to rise by $5.6 billion due to growth in the minimum guarantee, very weak property tax growth, and the loss of one–time funding for schools from the 2011 redevelopment legislation. In addition, the state will owe an additional $400 million in "settle–up" payments to schools. At the same time, in 2012–13 the state must repay the $2 billion Proposition 1A loan (which was used to help balance the budget in 2009). We also assume that the state repays $1 billion of loans to special funds. With the General Fund pressured by all of these factors, the state will be left with a 2012–13 operating shortfall (the difference between annual General Fund revenues and expenditures) of $9.8 billion. Accordingly—when combined with the projected "carry–in" deficit of $3 billion—the total budget problem that the state will need to address between now and the passage of the 2012–13 budget is estimated to be $12.8 billion, as shown Figure 1.
Structural Deficit Significantly Reduced. In our report last November, we were projecting a structural deficit of $20 billion that persisted over the forecast period. As a result of ongoing spending reductions adopted in the 2011–12 budget package and improvement in the state's revenue situation since last November, we are forecasting significantly lower operating shortfalls. As shown in Figure 3, our forecast shows an annual budget problem of over $8 billion in 2013–14 and 2014–15, declining gradually to about $5 billion in 2016–17. While these numbers are markedly improved from recent years, the state still faces daunting fiscal challenges.
The reduction in the ongoing deficit required difficult decisions by the Legislature and the Governor in developing the 2011–12 budget. Those included ongoing provider rate and service reductions in Medi–Cal, substantial grant reductions in income maintenance programs, a variety of cost–containment measures for community services for the developmentally disabled, and cuts to the budgets of the University of California (UC) and California State University (CSU), in addition to the trigger cuts.
In addition, the Legislature enacted two major pieces of legislation that changed the structure of California government: a measure related to redevelopment agencies (described in "Chapter 3") and measures that shifted various program responsibilities from the state to local agencies (described in the nearby box). Both of these measures had a significant positive impact on the state's General Fund budget in 2011–12, but—as currently structured—offer little direct state fiscal relief in future years. In addition, both of these measures are the subject of court challenges.
Funding the Proposition 98 Minimum Guarantee Will Be Difficult. Under our forecast, the 2012–13 Proposition 98 minimum guarantee is $4 billion higher than the revised 2011–12 spending level. With the loss of one–time funds related to the 2011 redevelopment legislation, General Fund Proposition 98 costs are projected to rise by $5.6 billion in 2012–13 under our forecast. Given the size of this projected increase, together with the other budget pressures facing the state, the Legislature will need to consider whether it can fund the minimum guarantee in 2012–13. If the Legislature determines it needs to suspend the guarantee, then it will need to decide how to reduce Proposition 98 spending. Over the last several years, the state has relied heavily on deferring school payments as a means of lowering Proposition 98 spending. Additional deferrals in 2012–13, however, could be unworkable for many districts given the magnitude of the existing deferrals (with 20 percent of Proposition 98 payments already made late).
State May Have to Reconsider Restoration of Prior–Year Cuts. In recent years, the state put into place a number of temporary reductions to health and social services spending that expire in the 2012–13 fiscal year. For example, in California Work Opportunity and Responsibility to Kids, there is over a $400 million restoration of prior–year cuts. Given the state's ongoing fiscal situation, the state may have to revisit these restorations in 2012–13.
Revenue Increases Also an Option. Given the potential consequences from the types of expenditure reductions discussed above, the Legislature will also want to consider revenue increases. For instance, the Governor has stated his desire to have certain increases in as yet unspecified taxes on the November 2012 ballot. We would recommend that the Legislature continue to review tax expenditure programs and reconsider various proposals from last year, such as modifications to enterprise zone programs and passage of a mandatory (rather than the current optional) single sales factor of corporate profit apportionment.
As noted above, our budget assumes no cost–of–living adjustments or price increases for many state programs. The impact of not adjusting for inflation means that the purchasing power of current state expenditures will be eroded by inflation over the forecast period, and the state will not be able to maintain the current level of services for many programs. Under this scenario, by 2016–17 many state employees will have received no net general salary increase (considering the net effect of both scheduled pay increases and recent pension contribution increases) for about a decade. Our forecast also assumes no restoration of recent budget reductions and trigger reductions. In other words, even with these modest funding assumptions, the state faces ongoing, multibillion dollar annual deficits, even as state revenues expand.
Forecast Does Not Account for Repayment of Most Budgetary Obligation. In recent years, the Legislature and Governor have used a number of different methods as part of balancing the budget. We estimate that the state will have accrued major budgetary obligations at the end of the forecast period, including: (1) $10 billion in interyear deferrals of payments to schools, (2) $10 billion of maintenance factor in Proposition 98, and (3) over $800 million in loans from special funds to the General Fund.
Solving the Ongoing Budget Deficit Would Not Address Massive Liabilities. Our forecast only includes current–law pension and retiree health payments by the state. It does not include added state payments to curb the massive (and growing) liabilities for retiree health benefits for state and CSU employees, teachers' pensions, and UC retirement benefits. Addressing the unfunded liabilities of just the teacher's retirement fund probably will require billions of dollars of additional payments annually over the coming decades.
The Legislature now faces a much smaller budget problem than projected one year ago, as well as the smallest projected out–year deficits since before the 2007–2009 recession. Unfortunately, there are few easy options left for balancing California's budget. Difficult program reductions already have been passed, and significant one–time budget actions may be more elusive than in prior years. Accordingly, the remaining work of eliminating the state's persistent, annual deficit will require more difficult cuts in expenditures and/or increases in revenues.
It is important to note that our forecast does not include funding to address some of the state's key long–term fiscal and policy problems. If, however, the Legislature and the Governor were to eliminate the structural deficit this year or over the course of the next few years, the focus of their efforts could finally shift away from short–term budget problems and turn to the serious long–term fiscal issues of the state's accumulated budgetary obligations and unfunded retirement liabilities.
Realignment
Background. As part of the 2011-12 budget plan, the Legislature enacted a major shift—or "realignment"—of state program responsibilities and revenues to local governments. In total, the realignment plan was intended to provide $6.3 billion to local governments (primarily counties) to fund various criminal justice, mental health, and social services programs in 2011–12, and increasing funding for these programs thereafter. The budget provides ongoing funding from three sources: (1) an ongoing shift of 1.0625 cents of the state sales tax rate, (2) an ongoing shift of vehicle license fee revenues that previously were allocated to the Department of Motor Vehicles and to cities and Orange County, and (3) a one–time shift of funds from the Mental Health Services Fund (established by Proposition 63 in November 2004).
Most of the state fiscal benefit from realignment in 2011–12 comes from Proposition 98 savings. Specifically, the budget assumes that, by depositing the sales tax revenue into a special fund for use by local governments for realignment, these funds are not available for the Legislature to spend for education purposes and thus are not counted as state revenue for purposes of calculating the Proposition 98 minimum funding guarantee. This action is estimated to reduce the Proposition 98 minimum funding guarantee by about $2 billion in 2011–12.
Realignment Revenues Could Outpace Program Costs. We project that the revenues dedicated to realignment in 2011–12 will total $6.3 billion, roughly equal to the administration's estimate of program costs for the realigned programs. Over the longer term, the relationship between realignment revenues and realigned program costs is not certain and will depend on many factors, including actual local costs to supervise the offenders transferred to their responsibility. Based on (1) the administration's estimates of costs to implement the realigned programs and (2) our estimates of growth in program caseload and program costs, we project that the growth in revenues dedicated to realignment could exceed local costs—potentially by hundreds of millions of dollars annually.
The extent to which realignment revenue growth outpaces program costs, however, is subject to significant uncertainty. Actual program caseloads and other costs could be higher than we estimate, depending in part on how local governments implement realigned programs and their success in containing costs. Also, the realignment legislation established allocation formulas to distribute the revenues among the affected programs and across counties. These formulas, however, were established only for 2011–12. Therefore, there is uncertainty as to whether the allocations provided to specific programs or individual counties will be sufficient to keep up with program costs in the future.
Risks to Achieving State Savings Estimate. Budget trailer bill language adopted by the Legislature specifies that the exclusion of the sales tax revenues from the calculation of the Proposition 98 minimum guarantee is contingent upon voter approval of a ballot measure in November 2012 providing additional funding for school districts and community colleges. If no ballot measure is adopted satisfying these requirements, (1) the state must repay K–14 education for the loss of about $2 billion for the 2011–12 year over a five–year period, and (2) the sales tax revenues dedicated to 2011 realignment would be included in the Proposition 98 calculation in future years. In addition, the assumption that the realignment revenues are excluded from the minimum funding guarantee is subject to some dispute. We note, for example, that a lawsuit has been filed by some school districts and education associations challenging the legality of the exclusion.
Legislative Implications. As we describe in our publication,
2011 Realignment: Addressing Issues to Promote Its Long–Term Success, there are several issues the Legislature should address before the end of the current fiscal year to increase the likelihood that realignment is implemented effectively and achieves the Legislature's objectives over the longer term. These include: establishing ongoing funding allocation formulas that are responsive to changes in program caseloads and costs over time, providing local governments with appropriate programmatic and financial flexibility to manage these new resources, and creating the right fiscal incentives to promote good program outcomes.
(Video)
California and the nation are recovering from the longest and most severe economic downturn since the Great Depression. The 2007–2009 recession was precipitated by the implosion of overheated housing and financial markets in California and throughout the United States, the resulting balance sheet deterioration of financial firms and households, and the near collapse of world credit markets.
Unemployment in California—under 5 percent as recently as 2006—has remained above 11 percent for over two years now. Over one million jobs have disappeared from the state's economy since early 2008.
The latest evidence suggests that the state and national economies continue a slow, arduous recovery from this staggering economic drop–off. Our economic forecast is summarized in Figure 1 and described in more detail below. Our forecast is that California's unemployment rate will remain above 10 percent through mid–2014 and remain above 8 percent through at least the end of 2017.
Figure 1
The LAO's Economic Forecast
(November 2011)
|
|
2010
|
2011
|
2012
|
2013
|
2014
|
2015
|
2016
|
2017
|
|
United States
|
|
|
|
|
|
|
|
|
|
Percent change in:
|
|
|
|
|
|
|
|
|
|
Real Gross Domestic Product
|
3.0%
|
1.8%
|
2.1%
|
2.8%
|
3.6%
|
3.4%
|
2.9%
|
2.6%
|
|
Personal Income
|
3.7
|
5.2
|
4.0
|
3.9
|
5.4
|
5.3
|
5.0
|
4.4
|
|
Wage and Salary Employment
|
–0.7
|
0.9
|
1.0
|
1.7
|
2.1
|
2.0
|
1.7
|
1.1
|
|
Consumer Price Index
|
1.6
|
3.1
|
1.5
|
1.9
|
2.1
|
1.9
|
1.7
|
1.6
|
|
Unemployment Rate (percent)
|
9.6
|
9.1
|
9.0
|
8.5
|
7.8
|
7.0
|
6.5
|
6.3
|
|
Housing Permits (thousands)
|
585
|
596
|
758
|
1,085
|
1,417
|
1,687
|
1,811
|
1,841
|
|
California
|
|
|
|
|
|
|
|
|
|
Percent change in:
|
|
|
|
|
|
|
|
|
|
Personal Income
|
4.0%
|
6.0%
|
4.1%
|
4.5%
|
5.6%
|
5.5%
|
5.0%
|
4.7%
|
|
Wage and Salary Employment
|
–1.4
|
1.2
|
1.3
|
2.1
|
2.2
|
1.9
|
1.6
|
1.4
|
|
Unemployment Rate (percent)
|
12.4
|
12.0
|
11.8
|
11.2
|
10.3
|
9.6
|
9.0
|
8.5
|
|
Housing Permits (thousands)
|
45
|
46
|
61
|
77
|
91
|
104
|
114
|
124
|
Recovery Even Slower Than Previously Expected. In November 2010, we wrote that the U.S. recovery was progressing more slowly than previously expected. Once again, we have to make the same observation. Figure 2 compares several key variables of the May 2011 economic forecasts of the administration and of our office to our updated November 2011 economic forecast. In 2011 and 2012, we forecast that the U.S. economy will grow more slowly than previously expected. In 2011, the lower–than–expected real gross domestic product (GDP) growth results largely from major downward revisions in July in estimates of GDP growth for the first quarter of the year. At the time of our May forecast, federal data estimated that real GDP in that quarter had grown at a 1.8 percent annual rate. In July, this estimate was revised downward to 0.4 percent. Subsequent quarters have seen higher reported GDP growth, but the effects of this first quarter weakness drag down our annual estimate. Similarly, consensus estimates for real GDP growth in 2012 are lower than they were earlier in the year.
Figure 2
Comparison of May and November Economic Forecasts
(Percent Change From Previous Year Unless Otherwise Indicated)
|
|
2011
|
|
2012
|
|
|
Administration Forecast
(May 2011)
|
LAO Forecast
(May 2011)
|
LAO Forecast
(November 2011)
|
|
Administration Forecast
(May 2011)
|
LAO Forecast
(May 2011)
|
LAO Forecast
(November 2011)
|
|
United States
|
|
|
|
|
|
|
|
|
Real gross domestic product
|
2.8%
|
2.8%
|
1.8%
|
|
2.9%
|
3.1%
|
2.1%
|
|
Employment
|
1.2
|
1.2
|
0.9
|
|
1.8
|
1.9
|
1.0
|
|
California
|
|
|
|
|
|
|
|
|
Personal incomea
|
4.4
|
5.4
|
6.0
|
|
4.5
|
3.8
|
4.1
|
|
Employment
|
1.3
|
1.6
|
1.2
|
|
1.9
|
2.0
|
1.3
|
|
Housing permits (thousands)
|
55
|
54
|
46
|
|
87
|
81
|
61
|
The employment outlook is somewhat weaker than we expected in May, and U.S. employment growth estimates included in our forecast are lower. There were some dismal job reports during the summer. The initial federal report of employment for August, for instance, said that there had been no net job growth for the nation during that month. Subsequently, however, this figure has been revised upward to 104,000.
What Parts of the Economy Are Doing Well? Over the last year, U.S. employment has grown most notably in the health services, leisure and hospitality, mining, trade, transportation/warehousing, and professional and technical services sectors. The latter sector (including technology and other services important to California's economy) has been among the strongest job producers—up 264,000 nationally over the past year. The manufacturing sector has gained 220,000 jobs over the last 12 months, buoyed, it appears, by healthy export growth, strong levels of equipment investment, and a revived domestic automobile market. Temporary help jobs are up 169,000 over the past year, including the past three months of 15,000 or greater growth—potentially a very good sign for the economy, as employers frequently convert many of these to permanent jobs.
What Parts of the Economy Are Not Doing Well? The U.S. and California economies continue to be dragged down by the construction sector. The weakness in the housing market continues to affect other sectors too, including the financial activities sector, which has seen weak job growth over the past year. Consumers are still showing signs of significant stress, with consumption pulled down sharply by their need to reduce debt and their difficulty in obtaining credit. Moreover, while the Federal Reserve continues to rely on aggressive monetary policy—with a multiyear commitment to near–zero interest rates—the effects of the 2009 federal fiscal stimulus now are wearing off, with real federal government purchases of goods and services declining from 2010 levels. The end of the federal fiscal stimulus and budgetary woes also are affecting the nation's local and state governments, among which employment has declined recently. Federal government employment also has been declining over the past year.
Slow Recovery Expected Throughout Our Forecast Period. Following the deep 1981–82 recession, the U.S. economy bounced back quickly—with real GDP growth of 4.5 percent in 1983 and 7.2 percent in 1984. As shown in Figure 1, however, no such bounce back appears to be in store for the U.S. economy. We forecast a slow, steady recovery through 2017 with annual real GDP growth ranging between 2.1 percent and 3.6 percent. Unemployment is expected to gradually decline for the U.S., reaching about 6 percent by the end of 2017. Housing permit activity is expected to grow—welcome news for the construction and other related sectors—even though the 1.8 million housing permits we forecast for the nation in 2017 remains 15 percent below the peak levels of 2005.
Weaker Job Growth Than Previously Expected. As shown in Figure 2, we have downgraded our forecast for California employment growth since May. We now forecast 1.2 percent employment growth in the state in 2011 and 1.3 percent in 2012—both down from prior forecasts. Housing permits—a key indicator for the state's very weak construction sector—are now forecast to be even lower than in our May forecast. State and local employment contraction also is expected to contribute to the weak labor market in the state.
Personal Income Surprisingly Strong Despite Weak Job Growth. Despite the state's weak job growth, personal income growth in California in 2010 and 2011 has proven to be fairly strong. This forecast incorporates somewhat stronger personal income estimates for the state in 2010 and a higher forecast for 2011, as shown in Figure 2. For 2012, this forecast for personal income growth in the state is higher than it otherwise would be due to our assumption that the federal employee payroll tax cut is extended to 2012. We made no such assumption in May. (Assumptions about federal policy are discussed further below.)
Federal Policy Is a Key Uncertainty in the Economic Forecast. Like other state revenue forecasters, we rely on national economic data provided to us by a major economic forecasting company. The data incorporate numerous assumptions about federal fiscal, monetary, regulatory, tax, and other policies. We use this information to inform many parts of our economic and revenue forecasts—utilizing our own judgment when appropriate.
For this forecast, however, there is considerable uncertainty about short–term and medium–term federal fiscal and tax policies. This uncertainty arises due to the activities of the congressional "supercommittee" charged with recommending substantial deficit–reduction measures in the coming weeks, the scheduled expiration of the 2011 employee payroll tax reduction and emergency unemployment insurance benefits, and the scheduled expiration of various tax cuts enacted under the prior federal administration (and extended under the current administration) at the end of 2012. Accordingly, current national economic forecasts must make many assumptions about what federal policy will be a few months and a few years from now. Our economic and revenue forecasts generally incorporate the following assumptions:
- The employee payroll tax cut and emergency unemployment insurance benefits will be extended for 2012 and then phased out over several years.
- There will be no sequestration (automatic federal spending cuts beginning in 2013) resulting from the failure of Congress to enact deficit–reduction measures now being considered by the supercommittee. Instead, Congress and the President will enact a package of deficit–reduction measures to replace sequestration that will begin to take effect in 2014. These measures are assumed to stabilize, but not reduce, the federal debt–to–GDP ratio.
- The various federal tax cuts originally enacted during the prior federal administration will be extended an additional year to 2013. (This produces changes in state revenue estimates since, in prior forecasts, we assumed these tax cuts' expiration at the end of 2012 caused some taxpayers to accelerate recognition of capital gains from 2013 to 2012. Instead, in this forecast, we assume that acceleration occurs from 2014 to 2013.)
Clearly, many of these assumptions may not come to pass, but they do seem to reflect a consensus of economists about a reasonable approach for forecasting the U.S. economy in the coming years. Compared to these assumptions, actual federal actions in the coming months could either produce additional short–term benefit for the economy (for example, by extending payroll tax reductions for the next few years to employers, as well as employees) or result in an additional short–term drag (for example, if the payroll tax reduction is not extended or sharp decreases in federal domestic and defense spending take effect through the sequestration process).
No Estate Tax Receipts Assumed for the State. In 2001, as a part of the tax reductions enacted during the prior federal administration, the federal government adopted reductions over several years to its estate tax and eliminated a tax code provision known as the "credit for state death taxes." The state credit was eliminated entirely for estates of those dying after December 31, 2004. In 2010, Congress and the President agreed to extend the temporary 2001 estate tax legislation—including elimination of the state death tax credit—until the end of 2012. Under current federal law, therefore, the pre–2001 estate tax regime will resume at the beginning of 2013, including the state death tax credit. Nevertheless, most observers believe that, no matter what Congress does to the estate tax in 2012, there will no longer be a credit for state–level estate taxes. Our forecast assumes that this consensus is correct. Pursuant to Proposition 6 (1982), the state may only collect estate taxes equal to the state death tax credit in federal law. Accordingly, our forecast assumes that the state receives no estate taxes during this forecast period. We advise the Legislature to assume no such revenues during its 2012–13 budget process unless there is a clear indication from Congress that a state death tax credit will be adopted.
If our assumption proves to be incorrect and Congress allows the state death tax credit to resume, the amount of revenues the state would receive beginning in 2012–13 is highly uncertain. The level of revenues in this scenario would depend, for example, on how many and how large the estates are that are subject to taxation. This could total several hundred million additional dollars for the General Fund in 2012–13 and perhaps over $1 billion per year thereafter. (These additional revenues, if they were to be received, also would increase the state's Proposition 98 minimum guarantee by an amount equal to around one–half of the revenue increase.)
Europe and the Financial Markets. Europe's woes—principally the feared default of Greece, Italy, Spain, and other nations on their national debt—have rattled investors in recent months. Recently, European leaders have taken actions intended to help stabilize the debt problems of heavily leveraged national governments there. Should the efforts of European leaders fail, some fear that the negative effects of national bond defaults could imperil European banks, thereby threatening credit markets and financial firms tied to those banks around the world. At the present time, we doubt that these issues will have a substantial effect on the U.S. economy. In California, for instance, European trade is a relatively small part of the state's imports and exports. Moreover, banks and other firms around the world now have had months to prepare themselves for European debt defaults.
A "Double–Dip" Recession? Probably Not. A double–dip recession in the U.S. now appears unlikely. Our forecast assumes that the economy grows slowly, but steadily, in the coming years. It is possible, however, that certain negative events in the coming months could precipitate one or more quarters of economic contraction not assumed in this forecast. For example, additional turmoil in the financial markets could cause such contraction. In addition, the effects of federal sequestration cuts or any major decline of consumer and business confidence due to failure of Congress and the President to agree on deficit reduction goals could affect the economy negatively.
Data Limitations. It takes time for the state's tax agencies to compile data from tax returns that is used by revenue forecasters. For our personal and corporate income tax forecasts, for example, we rely significantly on data compiled by the Franchise Tax Board (FTB) and presented on a routine biannual schedule to both our office and the administration—with the first set of data generally submitted each year in late April or May and the second set in late November or December. (The FTB also posts these "exhibit packages" on its website.)
The next FTB exhibit package likely will include some of the first solid data on 2010 California wages and salaries, capital gains, and other income tax information. By the time the administration completes its December revenue forecast, it may have the benefit of reviewing this or other FTB data that were not available for use in this forecast. Such FTB data could result in the administration's revenue forecasts being somewhat higher or lower than ours.
In addition, we note that since we prepared this economic forecast, federal job growth data has been revised upward for both August and September—by a total of 102,000 jobs over the two months. These upward adjustments (not reflected in our economic forecast) would have improved the 2011 employment levels assumed in our forecast—as well as state revenues—slightly.
California's General Fund is supported by revenues from a variety of taxes, fees, licenses, interest earnings, loans, and transfers from other state funds. Over 90 percent of the total, however, currently is derived from the state's "big three" taxes—the personal income tax (PIT), the sales and use tax (SUT), and the corporate income and franchise tax (CT). A summary of our revenue projections is shown in Figure 3. (Note that, beginning in 2011–12, this figure does not include SUT funds—estimated to total $5.1 billion in 2011–12—redirected from the General Fund to the Local Revenue Fund 2011 to pay for specified local programs.)
Figure 3
LAO General Fund Revenue Forecast
(Dollars in Millions)
|
Revenue Source
|
2010–11
|
2011–12a
|
2012–13
|
2013–14
|
2014–15
|
2015–16
|
2016–17
|
|
Personal income tax
|
$49,779
|
$50,812
|
$53,134
|
$55,692
|
$57,682
|
$61,811
|
$65,625
|
|
Sales and use tax
|
26,983
|
18,531
|
19,980
|
21,573
|
23,220
|
24,483
|
25,856
|
|
Corporation tax
|
9,838
|
9,483
|
9,432
|
9,958
|
10,806
|
11,316
|
11,492
|
|
Subtotals, "Big Three"
|
($86,600)
|
($78,826)
|
($82,546)
|
($87,223)
|
($91,708)
|
($97,610)
|
($102,973)
|
|
Percent change
|
7.3%
|
–9.0%
|
4.7%
|
5.7%
|
5.1%
|
6.4%
|
5.5%
|
|
Insurance tax
|
$2,070
|
$1,895
|
$1,989
|
$2,210
|
$2,326
|
$2,434
|
$2,536
|
|
Vehicle license fee
|
1,330
|
80
|
5
|
—
|
—
|
—
|
—
|
|
Other revenuesb
|
2,395
|
2,511
|
2,546
|
2,148
|
2,314
|
2,530
|
2,479
|
|
Net transfers and loans
|
1,897
|
1,451
|
–1,048
|
–1,126
|
–966
|
–235
|
–162
|
|
Total Revenues and Transfers
|
$94,292
|
$84,764
|
$86,038
|
$90,455
|
$95,382
|
$102,339
|
$107,826
|
|
Percent change
|
8.3%
|
–10.1%
|
1.5%
|
5.1%
|
5.4%
|
7.3%
|
5.4%
|
Figure 4 shows the differences between our forecasts of 2010–11 and 2011–12 revenues, as compared with those assumed in the 2011–12 budget package. For 2010–11, after including the most recent information available to us on accruals and other adjustments, General Fund revenues were approximately $500 million below budget act expectations, spread across all of the Big Three revenue sources. For 2011–12, our forecasted revenues are $3.7 billion less than those assumed in the budget package.
Figure 4
November 2011 LAO Revenue Estimates Compared With 2011–12 Budget Package
General Fund (In Millions)
|
|
2010–11
|
|
2011–12
|
|
Revenue Source
|
LAO November 2011 Forecast
|
Budget Package
|
Difference
|
|
LAO November 2011 Forecast
|
Budget Package
|
Difference
|
|
Personal income tax
|
$49,779
|
$50,027
|
–$248
|
|
$50,812
|
$50,408
|
$404
|
|
Sales and use tax
|
26,983
|
27,140
|
–157
|
|
18,531
|
19,009
|
–478
|
|
Corporation tax
|
9,838
|
9,963
|
–125
|
|
9,483
|
9,012
|
471
|
|
Subtotals, "Big Three"
|
($86,600)
|
($87,130)
|
(–$530)
|
|
($78,826)
|
($78,429)
|
($397)
|
|
Other revenuesa
|
$5,795
|
$5,754
|
$41
|
|
$4,486
|
$8,561
|
–$4,075
|
|
Net transfers and loans
|
1,897
|
1,897
|
—
|
|
1,451
|
1,465
|
–14
|
|
Total Revenues and Transfers
|
$94,292
|
$94,781
|
–$489
|
|
$84,764
|
$88,456
|
–$3,692
|
Under current law, our estimate of 2011–12 revenues will be compared with the coming December estimate of the Department of Finance (DOF). The higher of the two estimates will be used to determine the amount of any "trigger" reductions (as discussed in "Chapter 1").
At the end of 2010, temporary PIT rate increases and reductions in the dependent exemption credit expired. This is a major reason why PIT revenue is forecast to grow between 2010–11 and 2011–12 by only about 2 percent. (If, by contrast, there had been no such temporary PIT increases in 2010, the growth of the PIT would be about 7 percent between 2010–11 and 2011–12.) Our forecast assumes that PIT revenues grow by 5.2 percent per year between 2011–12 and 2016–17.
PIT Holding Up Well Despite Weak Economic, Financial Market News. Our PIT forecast for 2011–12 is higher than assumed in the budget act (excluding the $4 billion unallocated revenue assumption) despite the weaker outlook for the economy and financial markets. Income tax withholding and estimated payments have held up well since May, and overall revenue attributable to tax year 2010 appears to have been surprisingly high given the slow reported growth in personal income. We attribute this mainly to stronger growth in capital gains and some other categories of taxable income than we would typically expect based on the performance of asset markets and reported personal income growth. Specifically, some recent initial public offering (IPO) activity in the technology sector and extraordinary bonus income for some high–income earners may account for this unexpected strength.
Capital Gains Bounced Back From 2009 Low, but Slower Growth Forecast Ahead. Capital gains income consists of gains from sales of assets, such as stocks, bonds, and real estate. Taxable capital gains income is a very volatile part of PIT revenues—one that is virtually impossible to predict well, but can influence PIT receipts upward or downward by billions of dollars per fiscal year. Overall, as shown in Figure 5, we are assuming that taxable capital income (as a percent of personal income) has bounced back from its 2009 low—buoyed by strong investment markets in 2010—but will grow at a slower rate going forward.
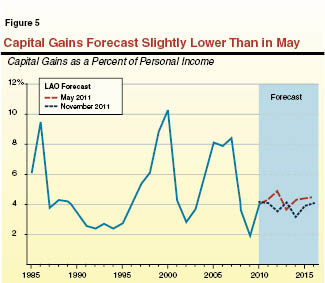
Since May, two factors have placed downward pressure on our capital gains forecast for 2011. First, our outlook for California real estate prices is even weaker now than it was in May. Second, this past summer's stock market slump caused stock prices—as measured by the Standard and Poor's 500 stock index—to be roughly 9 percent lower for the third quarter of 2011 than assumed in our May forecast. While we generally assume that stock prices will rise in the future, the effects of this summer slump result in our current assumptions of stock prices being lower throughout the forecast period than assumed in our May forecast.
Despite these dual downward pressures, our forecast assumes that capital gains income for California taxpayers will total $69 billion in 2011—down just 6 percent from our May forecast. This reduction is relatively small since we have incorporated in this forecast a positive adjustment to account for the healthy estimated PIT payments the state has received recently and current IPO activity in the technology sector.
While the factors described above have helped the recent rebound of capital gains, we do not forecast that California capital gains will rise to prerecession levels during the forecast period. As noted above and illustrated in Figure 5, capital gains generally are slightly lower over the forecast period than our May projections.
Capital gains forecasts—difficult as they are to forecast—can shift materially during the course of any fiscal year. Accordingly, it is possible that higher capital gains than we forecast could lead to PIT revenues being billions of dollars higher or lower than our forecast in 2011–12 or any future year.
Wages and Salaries—More Growth for High–Income Earners. In our report The 2011–12 Budget: Overview of the May Revision, we noted a significant PIT forecasting difference between our office and the administration related to high–income tax filers. Forecast differences for this group are important because of the higher marginal tax rates on their income. Specifically, prior to passage of the 2011–12 budget package, both our office and DOF had difficulty reconciling the very strong PIT results from last spring with the official economic data. Revenues were coming in much higher than the official labor and other economic data seemed to support. In the Governor's May Revision forecast, the administration assumed that higher PIT totals resulted in large part from huge growth in 2010 of salaries and wages for high–income wage and salary earners—those tax filers with over $200,000 of adjusted gross income (AGI). At the same time, the administration assumed that tax filers with less than $200,000 of AGI saw their wages and salaries fall by several percentage points. In our May forecast, we also assumed some higher growth for high–income wage earners—though not as much as the administration assumed—and small growth in wages for lower–income groups.
Since we lack hard data from PIT returns for 2010, we still must make a rough estimate of wage and salary growth for that income year. In this forecast, we assume higher 2010 wage and salary growth than we did in May for both higher–income and lower–income groups. Specifically, we assume that those with over $200,000 of AGI saw their wages and salaries grow by 7.5 percent in 2010, while those with under $200,000 of AGI saw their wages and salaries grow by 2.5 percent. In our forecast, higher–income earners' wage and salary growth outpaces that of lower–income earners throughout the forecast period.
We estimate that General Fund SUT revenues will total $18.5 billion in 2011–12, which is 2.5 percent, or $478 million, lower than the level assumed in the 2011–12 Budget Act. A large part of the decline is due to the so–called "Amazon compromise" that delays taxation of certain online purchases to 2012–13.
In 2012–13, we estimate that SUT will grow strongly to $20 billion, a 7.8 percent increase from 2011–12. Over the first three years of the forecast period, SUT revenues are expected to grow at an average rate of 7.8 percent—somewhat faster than personal income—before dropping to more modest growth during the remainder of the forecast period.
Recent Policy Changes Reduce General Fund SUT Revenues. In 2011–12, General Fund SUT revenues are projected to fall significantly from 2010–11 levels, reflecting the net effect of: (1) the "fuel tax swap" passed by the Legislature in 2010, under which the state no longer collects sales tax on gasoline, (2) the realignment of some state responsibilities to local government (which redirects $5.1 billion in state SUT receipts to cities and counties), (3) the expiration of the temporary 1 percent SUT rate increase adopted in 2009, and (4) projected growth in the SUT base of nearly 7 percent. Policy changes and underlying growth, taken together, reduce state General Fund SUT revenue from $27 billion in 2010–11 to an estimated $18.5 billion in 2011–12. Our forecast assumes that the 2011–12 SUT policies outlined above continue through the remainder of the forecast period.
Factors Affecting Forecast. The main determinant of SUT receipts is taxable sales. About two–thirds of taxable sales result from retail spending by consumers, including a significant portion on personal vehicles and large household purchases, both of which declined sharply during the recession. Other important categories of taxable sales are the purchase of building materials involved in new construction as well as business–to–business taxable transactions, where the purchasing business is the final consumer of the sold item.
Taxable Sales Fell Disproportionately During the Recession. From 2007 to 2009, taxable sales fell approximately 19 percent while personal income declined by just 2 percent. The reduction in taxable sales relative to income—illustrated in Figure 6—was the result of: (1) consumers and businesses curtailing costly purchases such as household appliances, new vehicles, and business machinery; (2) increased household savings rates; and (3) the long–term trend toward greater consumption of nontaxable goods (services and other products, such as those purchased online, for which the collection of SUT has been limited).
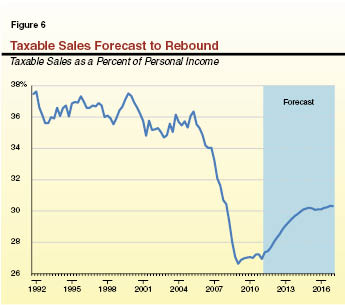
Taxable Sales Now Making Up Lost Ground. Since the start of the modest recovery, taxable sales have increased somewhat faster than personal income, signaling a correction to the decline in taxable sales discussed above. We expect this trend to continue through the first three years of our forecast, as illustrated in Figure 6 in the upward–sloping line beginning in 2011. We expect that consumers and businesses will gradually return to more normal levels of taxable spending relative to income during this period. Taxable sales in the final two years of the forecast grow approximately 5.5 percent annually as growth levels off over the remainder of the forecast period.
Uncertainties in the SUT Forecast Could Impact Actual Revenues. Taxable sales typically are influenced by (1) employment and income growth, (2) household savings rates, (3) the availability of consumer and business credit, and (4) overall confidence in the economy. These factors could differ substantially from our underlying assumptions in the following ways:
- Household Savings Rates, Incomes, and Employment Affect Spending Patterns. In recent months, national household savings rates have fallen to prerecession levels (savings tend to increase during recessions as consumers curb spending and pay down debt), likely indicating that savings built up over the past few years have supported recent growth in taxable sales. Should employment, income, or savings rates vary significantly relative to our expectations, actual taxable sales could differ substantially from our forecast.
- Consumer Credit Availability Influences Spending Decisions. The availability of consumer credit in the next few years (presently at historically low levels) is also significant, as credit generally allows consumers to finance large taxable purchases—such as vehicles, appliances, personal electronics, and home improvements.
- Consumer and Business Confidence May Affect Future Spending. National consumer confidence indicators are at their lowest levels since the end of the recession. Weak confidence about the economy, however, does not seem to have affected consumer spending—as evidenced by steady vehicle and retail sales in recent months. If current low consumer confidence about the economy drives Californians to spend less on taxable goods over the next several months, SUT receipts would grow more slowly than our forecast projects. In particular, we are concerned that possible congressional deadlock over the supercommittee's deficit reduction package could affect consumer behavior during the holiday spending season. Congressional deadlock could impair business confidence as well, which could lead businesses to postpone taxable investments—on machinery and other equipment, for instance.
Likely to Bottom Out in 2011–12 or 2012–13 Before Rebounding. Corporation tax revenues for 2010–11 are estimated to have totaled $9.8 billion, slightly higher than the previous fiscal year. We project CT receipts will be slightly lower in 2011–12 and 2012–13, but then grow steadily to $11.5 billion by the end of the forecast period.
Profits Forecast Stronger… Corporate profits—the main driver of our CT revenue forecast—now are projected to be higher than indicated in our last forecast in May 2011. Specifically, we now assume that before–tax national corporate profits will be $2 trillion in 2011, which is 15 percent higher than the value used in our previous forecast. The weak labor market, productivity growth, export expansion for certain U.S. products, and growing consumer demand all appear to be contributing to the strength in corporate profits.
…But Tax Credits Dampen Benefits of Profit Growth on CT Revenues. As profits increase, however, businesses will be more able to use new or previously earned state tax credits (such as research and development or enterprise zone credits) to reduce taxes owed.
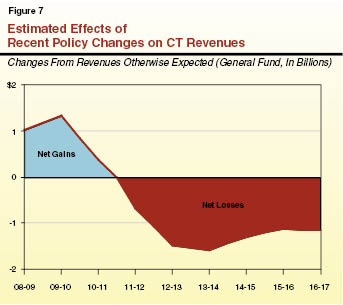
Net Impact of Recent Policy Changes Now Reducing Revenues. In addition to tax credits, various major CT policy changes of recent years affect the revenue outlook. In 2009–10 and 2010–11, these policy changes had the net impact of increasing CT revenues. The expected net effect of these recent changes to CT policies will be to lower revenues by around $700 million in 2011–12, compared to estimates of what revenues would have been had these policies not changed. This net negative effect is expected to grow, likely to over $1 billion annually for the remainder of our forecast period. This is shown in Figure 7. The recent major policy changes affecting the CT forecast are:
- Changes in Multistate Business Taxation. The elective single sales factor—the new option for businesses to annually choose which method is used to determine their California taxable income—and associated tax law changes are estimated to reduce CT revenues by around $1 billion per year.
- Major Revenue Accelerations. The Legislature has enacted several measures over the last few years that have accelerated revenue collections and delayed the use of tax deductions or credits. The actions include the suspension, for 2008 through 2011, of larger businesses' use of net operating loss deductions. This increased CT revenues. Since 2008, however, business losses have accumulated and will be deductible against income again starting in tax year 2012. Recently enacted—and modified—penalties on corporate taxpayers who are found to have significantly underpaid their taxes also serve to accelerate CT collections. This occurs as businesses try to avoid the penalties by paying upfront some of the tax they might have paid later following an audit.
- Expanded Credit Use. Recent legislation also affected the use of tax credits. The single largest change is that credits are now easier to use due to a law that allows transfers of certain credits between companies that are treated as parts of a single business group for tax purposes.
Uncertainties in the CT Forecast. Forecasting CT revenues is very difficult. Several factors could result in our forecast being too high or too low by large margins in any given fiscal year. Besides the usual uncertainties in forecasting corporate profits, there are some particularly difficult issues now for CT forecasting.
- Lags in Getting Certain Data. As there are long lags in getting certain data, developing our forecast requires us to estimate data associated with prior years. For example, the latest year for which we have firm data from FTB on California taxable profits is 2009. For CT revenues, this significantly impairs our ability to know how recent policy changes already have affected revenues. As described earlier, the administration may receive additional information on 2010 CT returns from FTB prior to releasing its December forecast.
- Recent Policy Changes Reduce the Reliability of Forecasts in the Near Term. Our forecast involves identifying patterns among economic variables and assuming these patterns will persist. In the past, for example, the ratio between California taxable profits and national profits has tended to return to a stable level after occasional increases or decreases. Due to recent CT policy changes in California, however, this ratio may be a much less useful guide for forecasting California profits. Accordingly, these policy changes—as well as the recent volatility of the economy during the recession and the current slow recovery—make it less likely that historical patterns will reemerge in the near term. This results in a need to incorporate a significant degree of judgment into our forecasts.
Our forecasting process also involves examination of population and other demographic trends in the California economy. This is our first forecast to incorporate 2010 Census results. Future forecasts will incorporate them more, as we have time to examine additional Census data. Our demographic forecast for 2010 through 2017 is summarized in Figure 8.
Figure 8
The LAO's Demographic Forecast
(In Thousands)
|
|
Estimated
|
|
Forecast
|
|
|
2010
|
2011
|
|
2012
|
2013
|
2014
|
2015
|
2016
|
2017
|
|
Totals (July 1st)
|
37,345
|
37,619
|
|
37,964
|
38,373
|
38,793
|
39,217
|
39,626
|
40,051
|
|
Change
|
268
|
274
|
|
345
|
408
|
421
|
424
|
409
|
425
|
|
Percent change
|
0.72%
|
0.73%
|
|
0.92%
|
1.08%
|
1.10%
|
1.09%
|
1.04%
|
1.07%
|
|
Births
|
512
|
511
|
|
513
|
528
|
544
|
561
|
576
|
579
|
|
Deaths
|
242
|
242
|
|
244
|
246
|
247
|
250
|
253
|
255
|
|
Net domestic migration
|
–88
|
–169
|
|
–93
|
–49
|
–51
|
–57
|
–79
|
–69
|
|
Net foreign migration
|
86
|
174
|
|
169
|
180
|
182
|
176
|
170
|
170
|
Population Growth Slowed Considerably in the Late 2000s. Population estimates for years between Censuses typically are subject to some uncertainty, but it now appears that California's population growth slowed considerably in the second half of the 2000s. Growth seems to have been especially low in 2005 and 2006 at the height of the housing bubble, as high housing prices may have discouraged new people from moving to the state and encouraged some outmigration. It also appears that large numbers of undocumented immigrants may have left the state at the end of the decade in response to the lack of job opportunities.
Population Growth Forecast to Pick Up Slightly in Future Years. We expect population growth to return to around 1 percent a year by 2013. Combined domestic and foreign net migration appears to have been negative from 2005 to 2010, but we expect it to turn positive beginning in 2012 due to lower housing prices and slowly expanding job growth in the state. We project California's population will reach 40 million in 2017.
Most of the state's population growth will come from natural increase. The state still has a relatively young population, and births consistently outnumber deaths by about 300,000 per year. Birth rates have been falling and should remain fairly low even as the job market improves. Death rates, meanwhile, are falling sharply, and we expect this to continue. This means that California's population—like the nation's—will become proportionately older in the coming years, presenting federal, state, and local governments with new challenges in service delivery and the funding of health, social services, social insurance, and pension programs.
In this chapter, we discuss our General Fund expenditure estimates for 2010–11 and 2011–12, as well as our projections for 2012–13 through 2016–17. Figure 1 shows our forecast for major General Fund spending categories for all of these years. Below, we first discuss general budgetary trends and then discuss in more detail our expenditure projections for major program areas.
Figure 1
Projected General Fund Spending for Major Programsa
(Dollars in Millions)
|
|
Estimates
|
|
Forecast
|
Average Annual Growth From
2011–12 to
2016–17
|
|
2010–11
|
2011–12
|
2012–13
|
2013–14
|
2014–15
|
2015–16
|
2016–17
|
|
Education
|
|
|
|
|
|
|
|
|
|
|
K–14—Proposition 98
|
$35,691
|
$31,664
|
|
$37,240
|
$39,649
|
$41,810
|
$44,556
|
$46,451
|
8.0%
|
|
Other Proposition 98 obligationsb
|
—
|
—
|
|
841
|
841
|
573
|
391
|
391
|
—
|
|
Child care
|
—
|
1,064
|
|
1,008
|
1,019
|
1,114
|
1,209
|
1,361
|
5.2
|
|
CSU
|
2,542
|
1,976
|
|
1,976
|
1,976
|
1,976
|
1,976
|
1,976
|
—
|
|
UC
|
2,711
|
2,072
|
|
2,071
|
2,070
|
2,069
|
2,068
|
2,067
|
—
|
|
Student Aid Commission
|
1,257
|
1,403
|
|
1,570
|
1,720
|
1,954
|
2,128
|
2,308
|
10.5
|
|
Health and Social Services
|
|
|
|
|
|
|
|
|
|
|
Medi–Cal
|
12,437
|
15,140
|
|
15,611
|
16,734
|
18,245
|
19,567
|
21,036
|
6.8
|
|
CalWORKs
|
2,079
|
1,065
|
|
1,448
|
1,468
|
1,360
|
1,250
|
1,234
|
3.0
|
|
SSI/SSP
|
2,861
|
2,752
|
|
2,815
|
2,888
|
2,968
|
3,055
|
3,151
|
2.7
|
|
IHSS
|
1,436
|
1,530
|
|
1,281
|
1,328
|
1,377
|
1,438
|
1,504
|
–0.3
|
|
Developmental Services
|
2,437
|
2,526
|
|
2,733
|
2,843
|
2,966
|
3,095
|
3,231
|
5.0
|
|
Mental Health
|
1,794
|
1,252
|
|
1,273
|
1,319
|
1,345
|
1,351
|
1,357
|
1.6
|
|
Other major programs
|
3,136
|
1,890
|
|
2,088
|
1,985
|
1,990
|
1,886
|
1,874
|
–0.2
|
|
Corrections and Rehabilitation
|
9,217
|
7,749
|
|
8,311
|
8,139
|
8,222
|
8,344
|
8,569
|
2.0
|
|
Judiciary
|
1,657
|
1,214
|
|
1,213
|
1,228
|
1,227
|
1,227
|
1,227
|
0.2
|
|
Proposition 1A Loan Costs
|
91
|
91
|
|
1,986
|
—
|
—
|
—
|
—
|
|
|
Infrastructure Debt Servicec
|
5,344
|
5,345
|
|
5,216
|
6,317
|
6,809
|
7,114
|
7,295
|
6.4
|
|
Other Programs/Costs
|
6,790
|
6,576
|
|
7,107
|
7,683
|
7,906
|
8,106
|
8,220
|
4.6
|
|
Totals
|
|
|
|
|
|
|
|
|
5.8%
|
|
Percent Change
|
|
–6.7%
|
|
12.3%
|
3.6%
|
4.7%
|
4.7%
|
4.1%
|
|
General Fund expenditures in 2011–12 are 6.7 percent below their 2010–11 levels, due for the most part to the shift of some $5.5 billion of expenditures from the General Fund to the Local Revenue Fund 2011 (as part of the realignment of state programs to local responsibility). In total, General Fund expenditures are forecast to be slightly (1 percent) lower than the budgeted amount due to the net effect of the trigger cuts and increased costs in some program areas.
Sharp Growth in 2012–13. In 2012–13, our forecast shows General Fund spending climbing by 12 percent. A large component of this is the additional $5.6 billion in Proposition 98 expenditure combined with the $2 billion Proposition 1A property tax loan that the state must repay.
Lower Growth Projected After 2012–13. Our forecast shows overall General Fund spending growing by 3.6 percent in 2013–14, 4.7 percent in 2014–15 and in 2015–16, and 4.1 percent in 2016–17. As shown in Figure 1, this equates to an average annual growth rate of 5.8 percent between 2011–12 and 2016–17. The period is characterized by consistently high growth rates in two areas that represent over half of the General Fund budget in 2016–17: (1) Proposition 98 spending for K–14 education and (2) Medi–Cal. The remainder of the budget is projected to grow at a modest 3.5 percent annually over the forecast period. This modest growth is due in part to the stated legislative policy of having no automatic inflation adjustments for many programs (as discussed in "Chapter 1"). For instance, our forecast assumes no growth in the General Fund appropriations to the universities or the courts after 2012–13.
(Video)
State budgeting for public education below the university level is governed largely by Proposition 98, passed by voters in 1988. The measure, modified by Proposition 111 in 1990, establishes a minimum funding requirement, commonly referred to as the "minimum guarantee." Both state General Fund and local property tax revenues apply toward meeting the minimum guarantee. Proposition 98 monies support K–12 education and the California Community Colleges (CCC), constituting about 70 percent of funding for these programs. These programs also receive support from the federal government, other state sources, and various local sources. Proposition 98 monies also subsidize preschool for low–income families.
Calculating the Minimum Guarantee. The Proposition 98 minimum guarantee is determined by one of three tests set forth in the State Constitution. These tests are based on several inputs, including changes in K–12 average daily attendance (ADA), per capita personal income, and per capita General Fund revenue. Though the calculation of the minimum guarantee is formula–driven, a supermajority of the Legislature can vote to suspend the formulas and provide less funding than the formulas require. This happened in 2004–05 and 2010–11. As a result of a suspension or a "Test 3" year (when the Proposition 98 guarantee grows more slowly than per capita personal income), the state creates an out–year obligation referred to as a "maintenance factor." When growth in state General Fund revenues is healthier (as determined by a specific formula also set forth in the Constitution), the state is required to make a maintenance factor payment, thereby accelerating growth in K–14 funding. Another type of Proposition 98 obligation is created when the finalized estimate of the minimum guarantee for a particular year ends up being higher than the Proposition 98 appropriation for that year. When this happens, the state needs to make a "settle–up payment" (or series of payments) to ensure the guarantee is met.
Figure 2 shows the major current–year Proposition 98 adjustments resulting from our forecast. Based upon updated 2011–12 information, the Proposition 98 calculations have changed in three ways, each of which is described below.
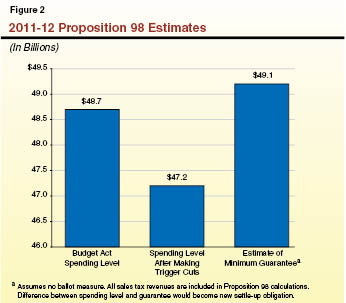
Unmet 2011–12 Revenue Projections Result in Proposition 98 Trigger Cuts of $1.5 Billion. The 2011–12 Budget Act appropriated $48.7 billion in Proposition 98 funding. Under our revised current–year General Fund forecast, revenues are $3.7 billion below 2011–12 budget assumptions, which would trigger $1.5 billion in corresponding Proposition 98 cuts. As a result, revised 2011–12 Proposition 98 spending would be reduced to $47.2 billion. Specifically, all the Proposition 98 Tier I reductions would be enacted—resulting in a $30 million cut to CCC apportionments (accompanied by a fee increase beginning in summer 2012) as well as a $6 million cut to the State Preschool program (with an additional $17 million non–Proposition 98 General Fund being cut from other child care programs). Additionally, almost all of the Tier II reductions would be enacted—resulting in the elimination of the Home–to–School Transportation program (for half–year savings of $248 million), an additional $72 million cut to CCC apportionments, and a $1.1 billion reduction to K–12 revenue limits. Whereas budget legislation authorizes a revenue limit reduction of $1.5 billion, we estimate a somewhat smaller reduction given our estimates of General Fund revenues and the Proposition 98 minimum guarantee. The reductions would be effective beginning January 1, 2012, except for the revenue limit reduction, which would take effect February 1, 2012.
Assume Higher Base and Large Settle–Up Obligation Moving Forward. The 2011–12 budget package proposed that a ballot measure be approved to raise additional revenue for schools and community colleges. The budget package, however, also contained a provision specifying that if no such ballot measure passed, the state would be required to provide an additional $2 billion in settle–up payments for K–14 education, reflecting the increase in the 2011–12 minimum guarantee if certain sales tax revenues had been included in the Proposition 98 calculations. To date, no such ballot measure has been adopted. Therefore, in calculating the minimum guarantee for 2012–13, our forecast assumes that all sales tax revenues are included in the Proposition 98 calculation, increasing the 2011–12 spending base by $2 billion. That is, even though the spending level with the trigger cuts would be $47.2 billion, we calculate the 2012–13 guarantee assuming a 2011–12 base of $49.1 billion. The budget package specifies that this settle–up obligation is to be paid in equal installments over a five–year period, beginning in 2012–13. We estimate annual payments of almost $400 million to satisfy this obligation.
Revisions in Redevelopment Savings Result in Higher General Fund Costs. The 2011–12 budget package also assumed the state would receive $1.7 billion in General Fund savings as a result of redevelopment agencies making "remittance payments" to school districts. As discussed in more detail later in this chapter, our forecast assumes the state will receive $300 million less than the initial estimate. As a result, the General Fund share of Proposition 98 costs for 2011–12 is up by about $300 million. (As specified in current law, we assume any increase in local redevelopment–related revenue for school districts would provide no General Fund benefit after 2011–12.)
Steady Increases in Proposition 98 Minimum Guarantee Throughout Period. The top part of Figure 3 shows our projections of the Proposition 98 minimum guarantee throughout the forecast period. For 2012–13, we project the minimum guarantee will be $51.3 billion, or 4.3 percent, higher than the revised prior–year level (of $49.1 billion). Thereafter, we project year–to–year increases in the minimum guarantee ranging from $2.3 billion to $2.9 billion, reflecting 4 percent to 5 percent annual increases. Although not reflected in the figure, the state's outstanding maintenance factor obligation would remain more than $10 billion throughout the forecast period. Also not shown in the figure, we assume the state continues to carry a $1.5 billion settle–up obligation from 2009–10 but makes no associated payments throughout the period. We also assume the state continues to make $450 million payments associated with the Quality Education Investment Act in 2012–13 and 2013–14 and then makes a smaller final payment to retire the obligation the following year.
Figure 3
Proposition 98 Forecast
(Dollars in Millions)
|
|
2012–13
|
2013–14
|
2014–15
|
2015–16
|
2016–17
|
|
Minimum Guarantee
|
|
|
|
|
|
|
General Fund
|
$37,240
|
$39,649
|
$41,810
|
$44,556
|
$46,451
|
|
Local property tax
|
14,023
|
14,159
|
14,295
|
14,459
|
15,067a
|
|
Totals
|
$51,263
|
$53,808
|
$56,105
|
$59,015
|
$61,518
|
|
Percent change
|
4.3%
|
5.0%
|
4.3%
|
5.2%
|
4.2%
|
|
Proposition 98 "Test"
|
2
|
1
|
1
|
2
|
2
|
|
Key Factors
|
|
|
|
|
|
|
K–12 average daily attendance
|
0.08%
|
–0.07%
|
–0.24%
|
–0.13%
|
0.01%
|
|
Per capita personal income (Test 2)
|
4.04
|
3.41
|
3.61
|
4.74
|
4.10
|
|
Per capita General Fund (Test 3)
|
4.28
|
5.29
|
4.81
|
5.85
|
4.74
|
|
Preschool through community colleges (P–14) cost–of–living adjustment
|
3.09
|
1.75
|
2.16
|
2.41
|
2.51
|
|
Year–to–Year Change in Guarantee
|
$2,127
|
$2,545
|
$2,297
|
$2,910
|
$2,503
|
|
Baseline Costs
|
|
|
|
|
|
|
P–14 attendance
|
$82
|
$18
|
–$54
|
$1
|
$71
|
|
P–14 COLA
|
873
|
669
|
888
|
1,146
|
1,249
|
|
Backfill of one–time actions
|
2,283
|
—
|
—
|
—
|
—
|
|
Totals
|
$3,238
|
$687
|
$834
|
$1,147
|
$1,320
|
|
Funds Available/Shortfall (+/–)
|
–$1,111
|
$1,858
|
$1,463
|
$1,763
|
$1,183
|
Except for 2012–13, Year–to–Year Growth in Guarantee to Exceed Growth in Baseline Costs. The middle part of Figure 3 shows some of the key factors that underlie the forecast and/or drive education costs. As shown, K–12 ADA is projected to be virtually flat throughout the period. Projected growth in per capita General Fund ranges from 4 percent to 6 percent whereas growth in per capita personal income is slightly less, ranging from 3 percent to 5 percent. The cost–of–living adjustment (COLA) for preschool through community colleges (P–14) hovers around 2 percent throughout the period. The bottom part of Figure 3 compares our projection of the year–to–year change in the Proposition 98 minimum guarantee with the amount needed to fund annual increases in baseline costs. As shown in the figure, except for 2012–13, the minimum guarantee would grow by more than is needed for the state to fund changes in enrollment and inflation. Over the last four years of the period, the guarantee would grow by a total of $6.2 billion more than needed to cover baseline costs. Nonetheless, as discussed in more detail below, the state still would face notable budget challenges.
We believe the Legislature should be mindful of several major issues as it begins to craft a Proposition 98 budget for the coming fiscal year.
Effect of Current–Year Trigger Cuts on School Districts Will Vary. Unsurprisingly, given the diversity among California's school and community college districts, the Proposition 98 trigger reductions will affect different types of districts differently. Understanding these impacts can help inform the Legislature's 2012–13 budget decisions.
- Some Districts Already Have Planned for Reductions. The districts that would be affected the least adversely by trigger cuts are those that built their 2011–12 budgets assuming some reduction in Proposition 98 per–pupil spending. These districts likely budgeted cautiously given the continued uncertainty regarding a tax package, concerns with the reliability of the $4 billion in additional revenue assumed late in budget negotiations, and the borrowing constraints they faced due to the new 2011–12 deferral of $2.1 billion. As a result of already making programmatic reductions, many of these districts are carrying relatively solid reserves. Thus, these districts likely will respond to trigger cuts by drawing down their reserves but make few, if any, midyear reductions.
- Other Districts Significantly Affected. In contrast, the districts likely to be the most affected by the trigger reductions are those that made few initial reductions in their 2011–12 programs. Instead, these districts were more optimistic in their budget assumptions—both assuming additional state revenue would materialize in 2011–12 and increasing their borrowing to sustain prior–year program levels. These districts will tend to be carrying less robust reserves. As a result of all these local decisions, these districts will face much more difficult options in response to the trigger cuts. They, like the districts described above, likely will first draw down their reserves. If their reserve levels, however, reflect only the minimum levels required by state law, they would not be adequate to absorb the entire cut. School districts also will face challenges given that collective bargaining and impasse processes likely will make negotiating additional furlough days difficult, despite being authorized in state law. Given school districts also cannot impose teacher layoffs midyear, these districts could need to make significant reductions in classified staff and/or service programs that rely on temporary teachers. Under a worst–case scenario, these districts could run out of cash the last few months of the year, be unable to make payroll, and require an emergency state loan (for which the district pays all associated costs and loses local control for a period of up to 20 years).
Given Size of Budget Problem, Legislature Needs to Consider Whether It Can Fund the Minimum Guarantee in 2012–13. Based upon our forecast, the 2012–13 minimum guarantee would be more than $4 billion higher than the revised 2011–12 spending level (after making the trigger cuts). With a projected 2012–13 overall state budget shortfall of $13 billion, the state will need to consider whether it can provide that large of an augmentation to school districts and community colleges. If the Legislature determined that such a sizeable Proposition 98 augmentation would make balancing the overall state budget too difficult, it could consider suspending the Proposition 98 minimum guarantee and providing either no or less growth in Proposition 98 funding. Retaining the revised 2011–12 spending level or providing a smaller–than–$4 billion augmentation would affect districts differently. As discussed above, some districts would be either keeping programmatic support flat or making slight programmatic increases. In contrast, other districts would have to make programmatic reductions in 2012–13 under either of these scenarios.
Remainder of Forecast More Robust but Not Enough to Retire Existing Obligations. As shown toward the bottom of Figure 3, we project the minimum guarantee will increase by an average of $2.5 billion a year—or $10 billion cumulatively—from 2013–14 through 2016–17. Even this notable growth, however, does not appear sufficient to allow the state to retire all of its existing Proposition 98–related obligations. For example, even if the state dedicated this entire amount toward funding revenue limit COLAs and paying down the existing revenue limit deficit factor, it still would end the period with almost $1 billion in outstanding revenue limit obligations. Over the course of this period, the state would have foregone COLAs for all other Proposition 98 programs, and it would have continued to make more than $10 billion in late Proposition 98 payments each year. Moreover, by the end of the period, the state still is projected to be carrying a more than $10 billion maintenance factor obligation and a $1.5 billion settle–up obligation.
Maintenance Factor Issues Remain. In recent years, disagreements have emerged regarding how to run the Proposition 98 calculations in certain situations, with differences in interpretation leading to results that can differ by billions of dollars. The main disagreements relate to when maintenance factor is created and paid. For example, in 2011–12, depending upon one's interpretation of the State Constitution and associated statutory provisions, either no maintenance factor was created or $2.5 billion in maintenance factor was created. Moreover, the issue of how to pay maintenance factor can affect the long–term Proposition 98 funding level. Depending on one's interpretation of how to pay maintenance factor, differences of hundreds of millions to billions of dollars are at stake. To make matters even more complicated, different combinations of perspectives on maintenance factor creation and payment can lead to even greater differences in results. Unless the Legislature (or voters) resolve these disagreements, calculating the Proposition 98 minimum guarantee will become increasingly problematic moving forward.
Traditionally, CCD programs have been funded through a combination of state Proposition 98 General Fund and federal funds. The 2011–12 Budget Act departed from this practice and instead used non–Proposition 98 General Fund for the state's share of all CCD programs except for State Preschool. Thus, we include State Preschool within our Proposition 98 forecast but run a separate forecast for the remaining CCD programs.
Current–Year Adjustments for CCD Programs. The 2011–12 Budget Act provided $374 million in Proposition 98 General Fund monies for State Preschool and $1.1 billion in non–Proposition 98 General Fund for all other CCD programs. The trigger cuts would result in a $23 million reduction to these programs ($6 million in State Preschool and $17 million in reductions to all other CCD programs). We expect most programs will realize these savings by disenrolling some children who are currently being served. (Current law generally requires programs to disenroll children from families earning the highest incomes first.) More than offsetting the drop in non–Proposition 98 spending, we estimate 2011–12 General Fund child care costs have increased by $26 million due to higher–than–expected Stage 2 caseload.
Future CCD Costs Reflect Ripple Effects of Temporary CalWORKs Policy Changes. Moving forward, we project overall CCD costs (excluding State Preschool) will decline slightly in 2012–13, then grow to almost $1.4 billion by 2016–17. For California Work Opportunity and Responsibility to Kids (CalWORKs) child care, we project a decline and then slow growth in costs over the early years of the period, largely resulting from temporary CalWORKs policies that were in effect for 2009–10 through 2011–12. Specifically, participation in CalWORKs Stage 1 child care (funded through the Department of Social Services) has decreased by nearly 30 percent since 2008–09 due to temporary exemptions that allowed certain families to receive cash grants without meeting work participation requirements. We assume that this reduction in Stage 1 caseload will subsequently lead to reduced Stage 2 and Stage 3 caseload over the next several years, thereby curbing the state's child care costs. We project costs will increase more rapidly (average of 10 percent) in the latter three years of our forecast, when we expect normal child care usage patterns will resume and increases in overall CalWORKs caseload will have resulted in more child care enrollments. For non–CalWORKs CCD programs (General Child Care, Alternative Payment, and migrant programs), we assume costs increase gradually over the forecast period, with year–to–year changes growing from 1 percent in 2012–13 to 5 percent by 2016–17. This trend reflects declines and then slow growth in the population of children under age four, together with annual COLA rates of roughly 2 percent.
In addition to the community colleges (which are discussed above as part of the Proposition 98 forecast), the state's public higher education entities include the University of California (UC), the California State University (CSU), and the California Student Aid Commission (CSAC).
Current–Year Trigger Cuts for Universities. Based on our revenue forecast, we have assumed $100 million in trigger cuts each for UC and CSU. Cuts of this magnitude amount to about 4.5 percent of the universities' General Fund support. However, given that the universities' core funding also includes a significant amount of tuition revenue, the programmatic reduction experienced by the universities would be about 2 percent at UC and 3 percent at CSU. The universities have limited options for accommodating midyear reductions, as most decisions affecting workload for the remainder of the academic year (admissions and course scheduling for example) were made months earlier. Unless the universities find sources of replacement revenue (such as through a midyear tuition increase), they will have to accommodate the reductions with some combination of drawing down reserves, borrowing, and reducing per–student costs.
Overall University Costs Projected to Be Flat Throughout Forecast. Our forecast assumes the universities' annual General Fund operating costs will be roughly $4 billion over the course of the forecast period. This reflects our overall forecast approach of not providing automatic COLAs, as well as an absence of college–age population growth.
Enrollment Projected to Be Flat. Enrollment at the universities is affected by demographic changes in the student population as well as demand among eligible individuals. we project that demographic growth in the student population will slow and then become negative by the end of the forecast period. Though enrollment demand at the universities is difficult to project, as it depends on many different economic and social forces, we assume a modest increase in demand would generally be canceled out by the projected demographic declines. We therefore assume no increase in university enrollment during the forecast period.
UC Retirement Program Costs Not Included in Forecast. Because no statutory formula or plan has been adopted governing state support for the UC Retirement Program (UCRP), we did not include General Fund costs for UCRP in our forecast. Based on discussions with UC, however, we estimate that UC could request state General Fund contributions exceeding $400 million annually by the end of the forecast period. Beginning in the early 1990s, neither the state nor UC employees made contributions to UCRP. This was because UCRP investments were sufficient to cover retirement cost obligations. This is no longer the case, with UC recently reinstituting employee payroll contributions and UC employer contributions toward UCRP. These contributions, however, are insufficient to cover all of UC's projected retirement costs. Though UC recently has begun requesting increased state General Fund support to help close this gap, the state has yet to appropriate funds for this purpose.
Cal Grant Programs. Most of the state's direct General Fund support for student financial aid is provided through the CSAC's Cal Grant programs, which offer tuition coverage and subsistence grants to eligible students. These costs are affected both by the number of students participating in the programs and the universities' tuition charges. As discussed above, we do not anticipate significant changes in enrollment levels. However, recent trends in tuition increases, coupled with statements by the universities, suggest that UC and CSU tuition will continue to increase. As a result, we project that Cal Grant costs will increase from $1.4 billion in 2011–12 to $2.3 billion at the end of the forecast period. Our forecast also takes into account costs associated with passage of the California Dream Act of 2010. Among other provisions in the act, Chapter 604, Statutes of 2010 (AB 131, Cedillo), makes some nonresident students eligible to receive state financial aid beginning in 2013.
Given that state General Fund resources are likely to continue to be severely constrained for the next several years, the Legislature faces several key questions with regard to the higher education budget.
- How Much Should Students Pay? As noted above, the universities have signaled that they could continue to increase tuition significantly for at least the next several years. The Legislature may wish to provide direction to the universities with regard to the share of education cost that non–needy students should be expected to pay.
- How Can Cal Grant Costs Be Managed? Because state law currently provides for a corresponding increase in Cal Grant payments when UC and CSU raise their tuition, state General Fund costs are driven in part by independent actions by the universities' governing boards. In some cases, the universities' decisions to increase tuition are made after passage of the state budget. The Legislature may wish to explore ways to better manage its own expectations for Cal Grant costs at the time of budget passage.
- How Should the Universities Reduce Operating Costs? Since the onset of the current recession, General Fund support for UC and CSU has declined by about a quarter. Much of this reduction has been backfilled with revenue from student tuition increases. Given the likelihood of continuing state budget constraints for the next several years, it may be necessary for the universities to further reduce their overall costs. The Legislature may wish to express expectations with regard to cost–saving opportunities related to factors such as faculty teaching and research expectations, student remediation rates, articulation of course sequences, student assessment and placement, and expansion of distance education and other alternative modes of instruction.
- How Should the State Address UCRP Costs? As noted above, UC's current efforts to restart UCRP contributions envision a corresponding increase in General Fund support, reaching several hundred million dollars per year by the end of the forecast period. Besides the magnitude of any augmentation, the Legislature also will have to consider how state support would be adjusted in future years, including potential increases or decreases in UCRP normal costs and unfunded liabilities.
Overview of Services Provided. California's major health programs provide health coverage and additional services for various groups of eligible persons—primarily poor families and children as well as seniors and persons with disabilities. The federal Medicaid program, known as Medi–Cal in California, is the largest state health program both in terms of the amount of funding and number of persons served. In addition, the state supports various public health programs, community services, state–operated facilities for the mentally ill and developmentally disabled, and health care insurance for children through the Healthy Families Program. Beyond these health programs, the state provides a variety of human services and benefits to its citizens. These include income maintenance for the aged, blind, or disabled; cash assistance and welfare–to–work services for low–income families with children; protection of children from abuse and neglect; and the provision of home–care workers who assist the aged and disabled in remaining in their own homes. Although various state departments oversee the management of these programs, the actual delivery of many services is carried out by county welfare and child support offices, and other local entities. Health programs are largely federally and state funded, while most human services programs have a mixture of federal, state, and county funding.
Overall Spending Trends. The 2011–12 budget provided $25.2 billion in General Fund spending for health and human services (HHS) programs. These costs would have been significantly higher, but the realignment package discussed earlier shifted $3.5 billion of state costs to counties. We now estimate that these General Fund costs will be about $25.9 billion in 2011–12, primarily due to higher–than–anticipated costs in Medi–Cal and In–Home Supportive Services (IHSS). Based on current law requirements, we project that General Fund spending for HHS programs will increase to about $27.2 billion in 2012–13 and $28.6 billion in 2013–14. Over the final three years of the forecast, we project that spending will increase by about $1.6 billion each year, eventually reaching $33.4 billion. All of our estimates include annual savings of about $325 million pursuant to the trigger reductions for Medi–Cal programs operated by the Department of Developmental Services and IHSS.
Although the average annual increase in HHS spending is 5 percent during the forecast period, there is substantial variation in spending growth rates by program. General Fund spending for the state's largest HHS program, Medi–Cal, averages 6.8 percent per year during the forecast period. Conversely, the Supplemental Security Income/State Supplementary Program (SSI/SSP) and CalWORKs programs are both projected to have average annual growth of around 3 percent.
Anticipated Lower Caseload Growth Reduces Cost Pressures. The recent recession raised unemployment and reduced income, resulting in historically high numbers of Californians enrolling in state HHS programs. As a result, caseload growth for many HHS programs from 2008–09 through 2011–12 was well above historical trends. Our economic forecast assumes modest but sustained employment growth over the next five years. Accordingly, our caseload projections for many HHS programs reflect substantially lower growth rates compared to the experience of recent years. This in turn reduces cost pressures. Below, we discuss spending trends in the major HHS programs.
Impact of Federal Affordable Care Act (ACA). The ACA, also referred to as federal health care reform, is far–reaching legislation that will change how millions of Californians access health care coverage. Among many other provisions, the new federal law expands federal funding and eligibility for the Medi–Cal Program and mandates that individuals obtain private or public health coverage. Some key provisions will not take effect until 2014. The scope of ACA is so broad that it will be years before all of its provisions will be fully implemented and its overall ramifications fully understood. Our fiscal forecast includes some significant budgetary adjustments to account for the implementation of ACA. Some of these adjustments result in cost increases for the state while others result in savings.
Overall Spending Trends. We estimate that in the current year General Fund spending for Medi–Cal local assistance administered by the Department of Health Care Services will amount to $15.1 billion. This is about $450 million, or 3.1 percent, more than appropriated in the 2011–12 Budget Act. We project that General Fund support will grow to $15.6 billion in 2012–13, a 3.2 percent increase from current–year expenditures. The largest factors contributing to this year–over–year spending growth are: (1) increases in caseload, utilization of services, and rising costs for those services; (2) costs for replacing one–time savings from a budget maneuver that accelerated provider payments and reduced expenditures in the 2011–12 budget; and (3) full–year savings in 2012–13 from various cost–containment measures implemented in part of 2011–12. After 2012–13, we project that General Fund spending will increase by about 8 percent each year, reaching a total of $21 billion by 2016–17.
Key Program Cost–Drivers. We assume that the cost per person for Medi–Cal health services will grow at an average annual rate of 5.4 percent over the entire forecast period. We also project that the number of individuals enrolled in Medi–Cal under current eligibility rules will grow at an average rate of only 0.8 percent per year. However, the overall Medi–Cal caseload will grow more than 6 percent annually due to factors related to the ACA, most notably expanded eligibility beginning in January 2014. The impact of the ACA on our Medi–Cal spending forecast is discussed below.
Key Assumptions Related to Cost–Containment Measures. The 2011–12 budget assumed savings from a variety of cost–containment measures, such as copayments and utilization limits, for which the state is still awaiting federal approval. Our forecast assumes the implementation of these measures will be delayed several months, resulting in an erosion of 2011–12 budget savings. We assume, however, a full year of savings from the cost–containment measures in 2012–13. We also assume the state will implement provider rate reductions recently approved by the federal government, despite ongoing legal challenges.
ACA Impacts. Implementation of ACA will have a series of impacts on the Medi–Cal Program over the forecast period. For example, the federal government will initially cover the health service costs for individuals who become eligible for Medi–Cal in 2014 under the expanded eligibility categories required in the ACA. Our spending forecast captures a partial–year effect in 2017, when the state will pay for a small proportion of costs associated with the expanded eligibility categories. The state will also share costs for any increase in caseload in existing eligibility categories that results from persons enrolling in Medi–Cal in response to the individual coverage mandate created under ACA. We note that, due to ACA, our estimates related to caseload growth and other factors impacting program expenditures contain a significantly greater degree of uncertainty.
We estimate that General Fund spending for the Department of Mental Health (DMH) in 2011–12 will be about $1.3 billion and will grow very slowly, approaching $1.4 billion by 2016–17. General Fund spending would have remained virtually unchanged during the forecast but for an almost $80 million increase in DMH staff costs to provide treatment services for mentally ill inmates at a new prison facility in Stockton.
Current–Year Impacts. As shown earlier in Figure 1, General Fund spending for DMH programs decreased from almost $1.8 billion in 2010–11 to $1.3 billion in 2011–12. This net decrease of $540 million can be attributed to two main factors: (1) realignment–related state savings of $762 million from replacing General Fund expenditures for the Early and Periodic Screening, Diagnosis, and Treatment Program and Mental Health Managed Care with Proposition 63 funds; and (2) partially offsetting cost increases (including additional General Fund expenditures to replace expiring enhanced federal matching funds that were available in the prior year).
We estimate that the General Fund spending for developmental services in 2011–12 will total $2.5 billion, assuming that the "revenue" trigger discussed earlier is pulled to achieve $100 million in ongoing savings. We project that General Fund support will grow to more than $2.7 billion in 2012–13, an increase of more than 8 percent from current–year expenditures. This year–over–year projected growth is largely due to increased caseload, utilization of services, and rising costs for community services provided by regional centers. It is also due to the expiration of temporary provider payment reductions that were implemented as a cost–cutting measure.
We project that General Fund support will grow to $3.2 billion by the end of the forecast period in 2016–17. This projected growth is largely due to increased caseload, utilization of services, and rising costs for community services. Our forecast assumes that regional center caseloads will grow at an annual average rate of 3 percent, and that costs overall will grow at an average annual rate of about 5 percent.
Overall Spending Trends. For 2011–12, the state budget provided $1 billion from the General Fund for CalWORKs. This amount reflects the impact of the 2011 realignment legislation, which shifted about $1.1 billion in CalWORKs grant costs to the counties. We project that General Fund spending for CalWORKs will be about $1.1 billion in 2011–12 or approximately $75 million above the 2011–12 Budget Act appropriation, due to higher–than–projected caseload. From this current–year base, we project spending will increase by about $400 million in 2012–13, stay fairly flat in 2013–14, and then decline in each of the next three years to around $1.2 billion in 2016–17. The increase in CalWORKs costs over the next two years is primarily the result of (1) the restoration of short–term reductions, (2) caseload growth, and (3) the state's fixed federal Temporary Assistance for Needy Families (TANF) block grant, which does not adjust for caseload changes. Long–term cost declines are primarily driven by projected declines in caseload levels.
Cost of Restoring Short–Term Policy Changes. For 2011–12, the Legislature achieved major ongoing CalWORKs savings through grant and eligibility reductions and additional short–term savings of over $400 million. The short–term savings included (1) extending certain exemptions from work participation requirements with a corresponding $375 million reduction in county block grants for employment services and child care and (2) suspending the case management portion of the Cal–Learn program for teen parents who remain in school, for a General Fund savings of $44 million. Our forecast reflects the complete restoration of these reductions beginning in 2012–13. (We note that the state General Fund bears 100 percent of these costs because the federal TANF block grant and county realignment funds do not adjust for caseload or policy changes.)
Caseload Levels Driven Mainly by Economic Conditions. Historically, changes in employment levels have significantly affected CalWORKs caseload growth. During the recent economic downturn, the growth rate of the CalWORKs caseload increased significantly. Conversely, during previous periods of employment growth, the CalWORKs caseload grew at a slower rate or declined. Our forecast of CalWORKs caseload reflects this empirical relationship between caseload and employment. The budget forecasts caseload growth of 1.2 percent in 2011–12. Based on recent caseload data, we estimate slightly higher caseload growth of 2.5 percent, resulting in additional costs of about $75 million. In 2012–13, as employment growth begins to increase, we project caseload will grow by only 0.6 percent. Beginning in 2013–14, we expect the caseload to gradually decline over the remainder of the forecast period.
State expenditures for SSI/SSP are estimated to be $2.8 billion in 2011–12 and 2012–13. Beginning in 2013–14, we project that General Fund support for SSI/SSP will increase by an average of $80 million per year, reaching $3.2 billion by 2016–17. The projected spending increases are primarily due to average annual caseload growth of about 2 percent with somewhat higher growth rates in the later years to reflect the aging of the population.
For 2011–12, we estimate that General Fund spending for IHSS will exceed the budget act appropriation by roughly $300 million, resulting in total costs of about $1.5 billion. We then project that costs will decrease to around $1.3 billion in 2012–13. These amounts reflect implementation of revenue triggers mentioned earlier and a specific IHSS trigger discussed below which will result in combined savings of $110 million in 2011–12 and $350 million annually thereafter. Finally, we project only modest growth in program cost in the out–years.
Budget Solutions and Unrealized Savings. The 2011–12 budget reflects a package of solutions including (1) receipt of additional federal funds due to a provider tax and implementation of the Community First Choice option under the federal ACA, (2) elimination of services for recipients whose need for services has not been certified by a medical professional, (3) a medication dispenser initiative, and (4) program integrity activities. Altogether, the budget assumed these initiatives would result in about $600 million in program savings in 2011–12. However, we estimate that this package will only save about $200 million in that year. Most of the unrealized savings in 2011–12 are related to delays in the implementation of the medication dispenser initiative and the Community First Choice option, along with overestimation of savings from other solutions.
Medication Dispenser Initiative and Budget Trigger. As part of the 2011–12 budget, the Legislature established a medication dispensing pilot program intended to improve medication compliance among Medicaid recipients, estimated to result in annual net cost avoidance of $140 million from reduced nursing home placement and hospital admissions. Budget legislation requires the Department of Finance (DOF) to report to the Legislature by April 10, 2012 on how much savings the pilot is likely to achieve. At that time, the Legislature will have until July 1, 2012 to enact alternative legislation to achieve a total of $140 million in ongoing savings from the medication pilot and/or new initiatives. If the DOF determines that these legislative actions are insufficient to achieve $140 million in savings, an across–the–board reduction in IHSS hours sufficient to meet this savings target will be implemented in 2012–13. Our forecast assumes that no savings from the medication dispensing pilot will be achieved in 2011–12, but that the full $140 million target will be achieved beginning in 2012–13.
Caseload Growth. Our forecast assumes that IHSS caseload will grow 3 percent per year throughout the forecast period. Our forecast is higher than the trend observed in 2009 and 2010, but below the rapid caseload growth that occurred prior to those years.
The major state judiciary and criminal justice programs include support for two departments in the executive branch—the California Department of Corrections and Rehabilitation (CDCR) and the Department of Justice—as well as expenditures for the state court system.
We estimate that General Fund spending for the support of CDCR operations in the current year will be about $7.7 billion, which is $1.5 billion, or 16 percent, less than the 2010–11 level of spending. This primarily reflects the estimated savings from (1) the realignment of certain lower–level offenders, parole violators, and parolees to counties beginning October 1, 2011 and (2) use of realignment revenues in the current year to reimburse CDCR for lower–level offenders in state prison who were sentenced prior to October 1. Our estimate of current–year spending is also lower because of assumed trigger reductions. Counties would be required to pay $125,000 per year to the state for each juvenile offender committed to the Division of Juvenile Facilities, resulting in an estimated savings of $79 million in the General Fund cost of operating state youth correctional facilities in 2011–12. In addition, there would be a $20 million unallocated reduction to CDCR's budget.
Our forecast projects that General Fund spending on corrections will increase to about $8.6 billion in 2016–17. As indicated above, the 2011–12 realignment package assumed that the Local Revenue Fund 2011 (realignment revenues) would reimburse CDCR about $1.2 billion for costs incurred in 2011–12 for lower–level offenders in state prison who were sentenced prior to October 1, 2011. Our forecast assumes that the General Fund will replace the $1.2 billion in 2012–13 and future years. In addition, as discussed in more detail below, our projections also reflect actions to reduce the state's inmate population as well as additional costs that CDCR will incur to staff and operate new prison facilities expected to be constructed during the forecast period.
Projected Savings From Reduced Inmate Population... Our forecast assumes that the realignment of certain criminal offenders from the state to the counties will reduce CDCR expenditures by $1.5 billion annually upon full implementation in 2014–15. Although this realignment of services would significantly reduce the state's inmate population, and go a long way towards complying with a federal court order to reduce prison overcrowding, it may fall short in meeting the requirements within the deadlines established by the court. (Please see nearby box for more detailed information about the federal court order.) Thus, our forecast assumes annual savings of over $100 million beginning in 2012–13 from additional inmate population reduction measures that would likely need to be adopted to comply with the court order. However, the actual savings achieved would largely depend on the specific actions taken to further reduce prison overcrowding.
|
Federal Court Order to Reduce Prison Overcrowding
On May 23, 2011, the U.S. Supreme Court issued a ruling in a lawsuit against the state involving prison overcrowding. Specifically, the court upheld the ruling of a federal three–judge panel requiring the state to reduce overcrowding in its prisons to 137.5 percent of the system's overall "design capacity" within two years. Currently, the state prison system is operating at roughly 180 percent of design capacity—or about 32,000 inmates more than the limit established by the three–judge panel. The ruling, however, did not specify the particular measures that the state must implement to comply. On June 7, 2011 and July 21, 2011 the administration submitted reports to the three–judge panel describing specific measures that were recently taken, as well as those in the process of being implemented, to reduce overcrowding in California prisons. For more detailed information, see our recent publication, A Status Report: Reducing Prison Overcrowding in California (August 2011).
|
…But Increased Costs to Operate Planned AB 900 Facilities. In 2007, the Legislature enacted Chapter 7, Statutes of 2007 (AB 900, Solorio), in order to relieve the significant overcrowding problems facing state prisons and improve rehabilitation. Specifically, AB 900 authorizes the construction of tens of thousands of additional prison beds. Our projections assume that about 15,300 additional beds will be constructed pursuant to AB 900 during the forecast period, resulting in an estimated $800 million in additional General Fund expenditures annually to staff and operate the new facilities. As the new facilities are built, the Legislature will need to make policy and budgetary decisions regarding the level of programming and staffing to be provided at these facilities, which will determine the actual increase in operational costs. Given the likely magnitude of these eventual costs, as well as the significant reduction in the state's inmate population resulting from the federal court ruling to reduce prison overcrowding, the Legislature may want to hold off from moving forward with some of the projects authorized under AB 900.
We estimate that General Fund spending for the support of the judicial branch in the current year will be about $1.2 billion, which is roughly $500 million lower than the amount appropriated in the 2011–12 Budget Act. This estimate primarily reflects the estimated General Fund savings from the realignment of court security to county sheriffs. Our forecast assumes that state spending on the judicial branch will remain roughly flat from 2011–12 through 2016–17.
The 2011–12 budget package included two measures designed to generate (1) $1.7 billion in state education savings in the current year and (2) about $400 million in increased resources for school districts annually thereafter. Under these measures, each city or county with a redevelopment agency must choose whether to retain its redevelopment agency and make annual remittance payments to local school districts or allow its agency to be eliminated. Under either scenario, school districts receive additional local funding, either from remittance payments or property tax revenues redirected from the expired redevelopment agencies. In 2011–12, the remittance payments are intended to offset state funding obligations for schools. In 2012–13 and future years, the ongoing remittance payments (about $400 million annually) are intended to supplement the resources the state provides to schools.
Our forecast estimates that state education savings in the current year will be about $1.4 billion, about $300 million less than the amount assumed in the budget because:
- As permitted by law, DOF reduced the remittance payment obligations for certain local governments that experienced increases in their redevelopment debt obligations.
- Some cities and counties are expected to allow their redevelopment agencies to expire and that the amount of property taxes redirected from the expired agencies will be less than the local governments' remittance payments.
- Some of the remittance payments and property tax revenues will be allocated to school districts that do not receive state funding for apportionments (so–called "basic aid districts"). These funds, therefore, will not offset state school costs.
On November 10, 2011, the California Supreme Court heard a case challenging the constitutionality of the redevelopment bills. A decision is expected by January 15, 2012.
During 2010–11, the Legislature ratified new memoranda of understanding (MOUs) with each of the state's 21 collective bargaining units. These MOUs reduced state employee compensation costs through (1) the Personal Leave Program (PLP), which decreased most employees' pay by about 5 percent for the first 12 months of the new MOU's, and (2) increased employee pension contributions. The 2011–12 Budget Act also directed the California Public Employees' Retirement System (CalPERS) to reduce employee health benefit costs by $80 million (General Fund).
Net Costs Beginning in 2012–13. Our forecast assumes that the state will achieve all of the MOU–related employee compensation savings anticipated in the 2011–12 Budget Act ($135 million General Fund), but only $47 million of the anticipated savings in health benefits costs. Beginning 2012–13, our forecast assumes that employee compensation costs grow because:
- The temporary salary reductions associated with the PLP end in 2011–12.
- Employees at the top step of the salary range will receive pay increases as provided by the MOUs.
- Employee health care costs increase at an average annual rate of 7.6 percent.
By 2016–17, we forecast employee compensation costs (nonretirement) will be more than $550 million higher than in 2011–12, principally due to higher health care costs.
Our forecast reflects current–law increases in the state's annual payments to (1) pension programs for state and CSU employees, (2) teachers' pensions, (3) state and CSU retiree health benefit programs, and (4) pension programs for judges. (The teachers' pension program is administered by the California State Teachers' Retirement System [CalSTRS], and the other three programs are administered by CalPERS.) Figure 4 shows the recent history and forecasted trend for General Fund budgetary costs related to these retirement programs.
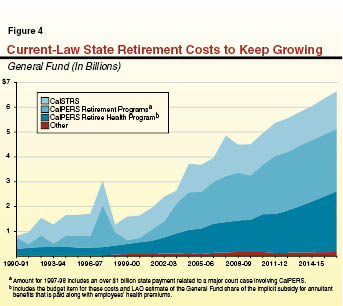
CalPERS Contributions Driven by Pay Raises, Investments, and Actuarial Methods. Our forecast assumes that the state's required contribution to CalPERS for state and CSU pensions rises from $3.6 billion (all funds) in 2011–12 to $3.8 billion in 2016–17. (Of the $3.6 billion to be contributed in 2011–12, about $2.1 billion is expected to be paid from the General Fund. This General Fund contribution grows to $2.2 billion in our forecast in 2016–17.) This assumes that CalPERS does not change its current actuarial rate–setting practices (including rate "smoothing") and that in 2012–13 and beyond, CalPERS investment returns hit the system's assumed investment target of 7.75 percent per year. Moreover, it assumes only the pay increases for state workers that are included in current MOUs—for most, a single 3 percent or 4 percent pay increase during the entire five–year forecast period. The forecast assumes that state workers continue to pay more in contributions to CalPERS throughout the forecast period, as agreed in collective bargaining agreements that were approved during the past year.
These various forecast assumptions limit the growth of the state's CalPERS contribution rates in our model. If, by contrast, pay raises were to rise faster than we assume, investment returns were to be significantly less, and/or actuarial methods of CalPERS were to change, the state's required payments to CalPERS could be hundreds of millions of dollars more than we forecast in 2016–17.
CalSTRS Contribution Driven by Rates Set in Statute and Teacher Salary Growth. The forecast assumes that the state's contributions to CalSTRS grow from $1.3 billion in 2011–12 to $1.5 billion in 2016–17. State contributions in 2011–12 are based on a 2009–10 payroll level for K–12 and community college teaching and administrative personnel of $27.1 billion. The preliminary estimate for 2010–11 upon which the state's 2012–13 contributions will be based is $26.2 billion (down 3.2 percent from 2009–10). We assume that statewide payroll remains fairly flat through the forecast period.
Typically, the state pays about 4.5 percent of prior–year teacher payroll to CalSTRS, as required in contractual commitments that are outlined in the Education Code. The system also receives payments from school districts and teachers to cover pension program costs, which also are fixed in the Education Code. Pursuant to its contractual obligations, the state must contribute additional funds each year when certain unfunded liabilities emerge, as they did after the decline of world financial markets in 2008. In our forecast, these added contributions total $106 million in 2011–12 and grow to $394 million by 2016–17. (These added contributions are very small compared to the billions of dollars of additional funding per year that CalSTRS will require to remain solvent and eliminate its unfunded liabilities over the next few decades.)
Retiree Health Costs to Continue Increasing. The forecast assumes continued pay–as–you–go payments for the vast majority of state and CSU retiree health costs. These are forecast to grow from $1.5 billion in 2011–12 to $2.3 billion in 2016–17. This represents an average 9.4 percent annual growth rate during the forecast period. This growth is driven by two elements: (1) projected annual growth in state employee and retiree health plan premiums and (2) a rising population of state and CSU retirees.
Unfunded Liabilities Persist. The state's retirement programs are projected to have significant—and growing—unfunded liabilities through the forecast period. Because our forecast includes only current–law pension contribution requirements, it does not include funding sufficient to begin to reduce CalSTRS' unfunded liabilities (currently estimated to be around $4 billion per year beginning immediately to eliminate the liabilities over the next 30 years, assuming that CalSTRS achieves its investment targets over the long term). Moreover, because the state is not required under current law to contribute additional funds to UC to address its unfunded pension and retiree health liabilities, the forecast includes no General Fund resources to assist UC for these purposes. It also includes virtually no General Fund support to begin paying down large unfunded retiree health liabilities for current and past state and CSU employees. If the state does not take action concerning these liabilities soon, the extra costs needed to retire these unfunded liabilities over the next few decades will increase dramatically.
The state uses General Fund revenues to pay debt–service costs for principal and interest payments on two types of bonds used primarily to fund infrastructure—voter–approved general obligation bonds and lease–revenue bonds approved by the Legislature. We estimate that General Fund costs for debt service on these bonds will be $5.2 billion in 2012–13, which is roughly equal to the state's General Fund debt–service costs every year since 2009–10. General Fund debt–service costs have not increased significantly over this period for a few reasons. Most notably, the Legislature and Governor enacted legislation to offset some General Fund debt–service costs with transportation funds. Additionally, the administration slowed the pace of bond sales over the last 18 months, including the cancellation of state bond sales during the first half of 2011.
Over the forecast period, however, debt service is projected to grow 6.4 percent annually over the period, reaching $7.3 billion by 2016–17. Projections of debt–service costs depend primarily on the volume of past and future bond sales, their interest rates, and their maturity structures. The exact timing of bond sales depends upon when various bond–related programs will be in need of funds and the accessibility of financial and credit markets. In general, our forecast assumes that the slower pace of bond sales continues for many programs because they currently have sufficient bond proceeds to cover their spending needs for the initial portion of the forecast. Nonetheless, over the entire forecast period, we assume that a total of about $36 billion of already authorized general obligation and lease–revenue bonds will be sold as currently approved projects move forward. A large share of this—about $24 billion—is from the nearly $54 billion in infrastructure bonds authorized by voters in 2006 and 2008. It also reflects the growing issuance of lease–revenue bonds for the prison system authorized by the Legislature in 2007. We also expect that transportation debt–service costs will exceed available transportation funds during the forecast period and the General Fund will resume paying a portion of these costs. Our forecast is based on the expected sale of bonds that have already been authorized, but does not include any proposed bonds (such as the water bond scheduled for the 2012 ballot).
Debt–Service Ratio (DSR) Expected to Rise. The DSR for general obligation and lease–revenue bonds—that is, the ratio of annual General Fund debt–service costs to annual General Fund revenues and transfers—is often used as one indicator of the state's debt burden. There is no one "right" level for the DSR. The higher it is and more rapidly it rises, however, the more closely bond raters, financial analysts, and investors tend to look at the state's debt practices and the more debt–service expenses limit the use of revenues for other programs. Figure 5 shows what California's DSR has been in the recent past and our DSR projections for the forecast period.
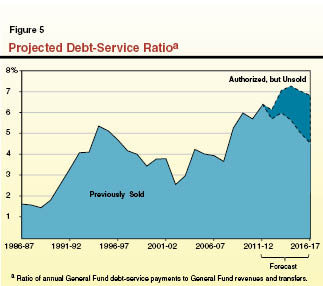
The DSR we are projecting—over 7 percent at its peak—is higher than it has been in the past. In part, this reflects declines in General Fund revenues, as well as the continued sale of the large bonds approved since 2006. To the extent additional bonds are authorized and sold in future years beyond those already approved, the state's debt–service costs and DSR would be higher than projected in Figure 5.
Over the last several years, the Legislature has taken various actions to reduce or defer costs for state mandates on local governments (cities, counties, and special districts). These actions include permanently repealing mandates, suspending statutory requirements to implement mandates, and deferring payments towards retiring the state's backlog of mandate claims (over $1 billion). The 2011–12 budget shifted the responsibility and funding for providing certain mental health services to K–12 students from counties to schools (commonly referred to as "AB 3632" program). This action eliminates the need for ongoing mandate payments to counties for this program. Our forecast assumes that the Legislature continues to suspend all mandates it suspended in 2011–12. Our forecast also assumes that the state makes annual payments to retire the backlog of mandate claims, as specified in current law. Under these assumptions, state costs for mandates would increase from $48 million in 2011–12 to roughly $200 million annually throughout the forecast period.
Legislative Analyst
Mac Taylor 445–4656
Deputy Legislative Analyst
Daniel C. Carson 319–8303
Corrections, Transportation, and Environment
Deputy: Anthony Simbol 319–8350
Managing Principal Analysts:
Farra Bracht, Transportation 319–8355
Mark C. Newton, Environment 319–8323
Education
Deputy: Jennifer Kuhn 319–8332
Managing Principal Analyst:
Steve Boilard, Higher Education 319–8331
Health and Human Services
Deputy: Todd Bland 319–8353
Managing Principal Analyst:
Shawn Martin, Health 319–8362
State and Local Finance
Deputy: Jason Sisney 319–8361
Managing Principal Analyst:
Marianne O'Malley, General Government 319–8315