Executive Summary
The Unemployment Insurance (UI) program provides weekly benefits for workers who have lost their job through no fault of their own. The UI program is authorized in federal law, administered by California's Employment Development Department, and financed by contributions paid by employers. This report compares the state's UI system with those of other states to provide context to the Legislature in considering potential solutions to California's UI insolvency.
California's UI Program Pays Low Weekly Benefits, Yet Has High Total Costs. Currently, California's UI program provides lower weekly benefits, in relative terms, than the majority of states. However, it pays weekly benefits for a longer duration and to a relatively larger caseload. Overall, California's higher caseload and longer average benefits duration more than outweigh its lower weekly benefits, resulting in comparatively high total benefit costs.
Despite High Costs, California's Tax Rates Are About Average. California's UI program taxes employers at a level about equal to the national average. However, as its costs are comparatively higher, California's total UI benefit costs are significantly underfunded. Since 2001, California's total benefit costs have exceeded its revenues in all but two years. This imbalance led to an insolvency in California's UI fund beginning in 2009. Since then, California, along with many other states, has borrowed from the federal government in order to continue paying UI benefits.
California's UI Program Faces Unique Challenges. For more than a decade, California's UI program has consistently paid UI benefits for a longer duration and to relatively more claimants than the majority of other states. While a portion of California's comparatively high caseload and longer benefits duration can be attributed to California's UI policies, it appears that a significant portion is attributable to other factors, such as consistently higher unemployment rates and longer average spells of unemployment.
UI Fund Solvency Is Significantly Related to Unemployment Levels. Our analysis suggests that, during the recent recession, variation in UI fund solvency across states is more closely related to differences in unemployment rates and program caseloads than differences in UI tax and benefit policies.
Introduction
Since 2008, due primarily to historically high demand for UI, the cost of providing UI benefits in many states has exceeded available resources. As a result, by 2010 the UI funds in 32 states were insolvent, forcing those states to obtain loans from the federal government to continue payment of UI benefits. As of August 2011, outstanding loans to these states totaled $36 billion, with California comprising about $8 billion of this total.
Continued federal borrowing poses several problems for California, which we discuss in depth in our July 2011 report,
Managing California's Insolvency: The Impact of Federal Proposals on Unemployment Insurance. Most significantly, if no action is taken to address the insolvency of California's UI trust fund, the state will be required to pay roughly $3 billion in interest payments to the federal government over the next decade. Given the issues that could arise from insolvency, it is likely that changes will need to be made to California's UI program in the coming years to ensure its long–term stability.
In this report, we conduct a comparative analysis of the UI programs in all 50 states and Washington D.C. to provide context for the Legislature in considering potential solutions to California's UI insolvency.
Background
UI Program
The UI program, which provides weekly benefits to individuals who are unemployed through no fault of their own, was established under the federal Social Security Act of 1935. Although the UI program is authorized in federal law, it is administered by states, which are given broad discretion to determine program policy—including setting tax and benefit levels.
Financing
In all states, the UI program is financed by unemployment tax contributions paid by employers for each covered worker. Each state selects both a taxable wage base (the portion of annual wages paid to covered workers which are subject to UI taxes) and the tax rates to be applied to the taxable wage base. For this reason, both taxable wage bases and UI tax rates vary significantly across states. However, rate–setting procedures in all states share two common characteristics. First, tax rates for all employers vary with the balance of the state's UI trust fund—the account to which employer contributions are deposited and from which benefit payments are made. Generally, as the balance of a state's UI trust funds falls, tax rates increase. Second, the tax rate paid by a particular employer is dependent upon the history of UI claims made by its prior employees, also known as its experience. More specifically, as claims paid to past workers of a particular employer increase, the tax rate of that employer will also increase. This method of rate setting is known as experience rating.
Benefits
Although several factors determine the level of benefits paid to claimants in a given state, those under the immediate influence of program policies can be grouped into three general categories: (1) weekly benefit calculation methodology, (2) duration, and (3) eligibility requirements.
Weekly Benefit Calculation Methodology. Each state must develop a methodology for calculating a claimant's weekly benefit amount. In general, weekly benefits are calculated by multiplying a wage replacement rate (the percentage of recent earnings to be replaced by benefits) by a claimant's average weekly earnings during his/her base period (a 12–month period used to determine a claimant's recent earnings). For example, weekly benefits in California are equal to 50 percent of a claimant's average weekly earnings during the quarter of highest earnings in his/her base period. While the majority of states calculate benefits based on a claimant's highest quarter of earnings, some states consider earnings in multiple quarters or an entire year. The calculation of weekly benefits is also subject to statutory minimum and maximum benefit amounts; the latter typically limits the amount of weekly benefits a claimant can receive.
Duration. The number of weeks a claimant is eligible to receive benefits is based on two factors, both of which are at each state's discretion. First, states set a statutory limit for the maximum number of weeks any claimant may receive benefits. For most states, including California, this statutory maximum is 26 weeks. Second, most states limit total benefit payments to a percentage of a claimant's earnings during his/her base period (hereafter referred to as the prior earnings limit). For example, in California a claimant may not receive benefits totaling more than 50 percent of his/her base period earnings. Once the prior earnings limit is reached, the claimant may no longer receive benefits, even if this limit is reached before 26 weeks. This prior earnings limit can effectively reduce the maximum number of weeks of benefits available to many claimants.
Eligibility Requirements. All states have both monetary and nonmonetary eligibility requirements. A monetary eligibility requirement is the minimum prior earnings threshold that an unemployed worker must meet to be eligible to claim benefits. In most states, to meet monetary eligibility requirements, a claimant must have earned more than a certain dollar amount ($1,125 in California) during his/her base period. Nonmonetary eligibility requirements are all conditions unrelated to prior earnings that an unemployed worker must satisfy to be eligible for benefits. Typically, nonmonetary eligibility requirements mandate that claimants must be actively seeking employment and able and willing to work.
Methodology
In this report, we use data maintained by the U.S. Department of Labor (DOL) to compare UI program statistics across all states during the 12–month period ending in June 2011. In addition to comparing individual states, we also examine statistics for the nation, the ten largest states (excluding California), solvent states as a whole, and insolvent states as a whole. We note ten states have taken action in 2011 to reduce benefits, while two have increased employer contributions. As many of these changes have yet to take effect, they are not reflected in currently available UI program data.
Measures Used in Our Comparative Analysis
For our comparative analysis, we selected measures to capture three primary aspects of the UI benefits cost structure—weekly benefit amounts, duration, and caseload levels—as well as measures to examine the adequacy of program financing. In most cases, we use measures generally accepted and reported by the DOL. However, we note that these measures are imperfect and we provide relevant caveats in our discussion.
Below, we provide a brief definition of each measure. In addition, we provide a brief discussion of the factors which theory suggests should affect each measure. However, it should be noted that several factors which are outside the scope of this analysis—such as demographics, culture, and other characteristics unique to states—are also likely to have an influence on these measures. (The appendix of the report provides the basic formula used to calculate each of our measures.)
Average Weekly Wage Replacement Rate. The weekly wage replacement rate is the percentage of a worker's average weekly earnings (as determined by his/her earnings during a base period) lost due to unemployment that are replaced by UI benefits. The weekly wage replacement rate effectively takes into account differences in wage levels across states. The weekly wage replacement rate is generally considered an effective measure of the generosity of benefits paid to UI claimants. However, it does not take into account the number of weeks that benefits are provided and therefore should not be considered a comprehensive measure of generosity.
Average Total Wage Replacement Rate. The total wage replacement rate measures the percentage of a claimant's prior earnings which are replaced by total UI benefit payments received over the entirety of a UI claim. This measure approximates the generosity of benefits provided to an individual over the whole period of unemployment coverage. For this reason, the total wage replacement rate may be considered a more comprehensive measure of individual benefit generosity than the weekly wage replacement rate. However, it is important to note that the total wage replacement rate is more likely to be affected by changes in macroeconomic conditions than the weekly wage replacement rate. This is because, in general, the length of UI claims will vary substantially across a business cycle as it becomes easier or harder to find a job.
Average Benefits Duration. Average benefits duration measures the number of weeks that an average claimant receives UI benefits. In general, three primary factors affect average benefits duration: (1) statutory limits on duration, (2) magnitude of weekly benefits, and (3) labor market conditions. First, as previously discussed, California and the majority of other states provide UI benefits for up to 26 weeks. However, most states also impose a prior earnings limit which can effectively limit the number of weeks a claimant may receive benefits to less than 26. These limits vary significantly across states, with some states imposing no limit and some limiting benefits to 25 percent of base period earnings. Second, greater weekly benefit amounts may act as a disincentive for unemployed workers to aggressively pursue reemployment and/or may discourage them from accepting less agreeable offers of employment. For this reason, higher weekly benefits amounts are likely to increase average benefits duration. Finally, in addition to policy factors, labor market conditions also have a significant impact on average benefits duration. More specifically, structural labor market issues (barriers which impede the employment of a significant number of workers in a particular industry or demographic), labor market frictions (hindrances to workers' job search efforts or transitions between jobs), and/or general macroeconomic downturns can significantly increase average benefits duration.
Benefits Exhaustion Rate. An exhaustion occurs when a UI claim ends because a claimant has received all of the benefits to which he/she is legally entitled. In other words, the claimant's benefits ran out before he/she found a new job. The exhaustion rate measures the percentage of claimants who ran out of benefits before finding a new job. In general, the exhaustion rate is affected by the same factors which influence average benefits duration. However, unlike average benefits duration, as the prior earnings limit is increased, the exhaustion rate is likely to decrease.
Insured Unemployment Rate. The insured unemployment rate (IUR) is the percentage of workers covered by a state's UI program which are currently receiving UI benefits. The IUR measures the size of a state's UI program caseload relative to the size of its covered labor force. In general, the IUR is driven by three factors: (1) overall unemployment rates, (2) recipiency rates (see below), and (3) benefits duration. Typically, the IUR will increase (decrease) if any of these factors increase (decrease).
Recipiency Rates. The recipiency rate is the proportion of all unemployed workers who are currently receiving regular UI benefits (this does not include recipients of federally funded emergency benefits). Recipiency rates are influenced by several factors: (1) eligibility requirements, (2) magnitude of weekly benefits, (3) the availability of alternative sources of income or aid, and (4) labor market conditions (as described above). In general, less stringent eligibility requirements and greater weekly benefits will increases recipiency rates (and vice versa). Greater availability of alternative sources of income—such as social services, spousal income, or assistance from friends and family—will also likely reduce recipiency rates.
Benefits–to–Wages Ratio. The benefits–to–wages ratio is equal to total benefits paid to all UI claimants as a percentage of total wages paid to all covered workers. The benefits–to–wages ratio measures the total cost of providing UI benefits relative to total wages paid to all covered employees. Therefore, it reflects the effective tax rate (see below) on total wages that would be necessary for a UI program to cover its total benefit costs. Total benefit costs are determined by the magnitude of benefit payments (weekly benefit amounts), the length of benefit payments (duration), and the number of claimants to which benefit payments are made (caseload). As any of these factors increase (decrease), total benefits costs will also increase (decrease).
Average Effective Tax Rate. The average effective tax rate is equal to total UI taxes paid by all employers as a percentage of total wages paid by those employers. It is a measure of the cost of a state's UI program for an average employer. As mentioned above, to the extent that a UI program's average effective tax rate falls below the benefits–to–wages ratio, its total benefit costs will be underfunded.
What Do These Measures Tell Us About the UI Program Cost and Financing Structure?
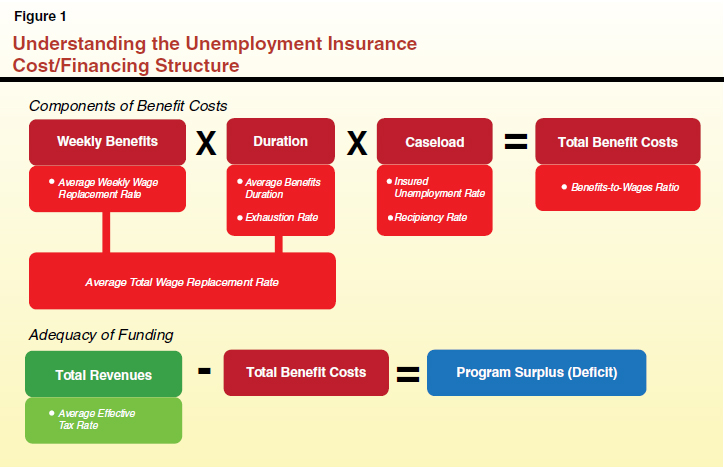
Total UI benefit costs are comprised of three components: weekly benefit amounts, duration, and caseload. For our analysis we have selected measures to examine California's comparative position on all three of these components. In addition, we included measures to consider the adequacy of California's UI program financing. Figure 1 provides a visual representation of the relationship between these components and connects each measure to the specific cost or financing component which it helps to explain. In this figure, the component is listed first followed by its associated measures in italics.
Findings
Individual Benefit Payments
Figure 2 shows two measures of individual benefit levels, the average weekly and average total wage replacement rates, for California, the nation, and the average for the ten largest states. (Throughout this report, state rankings are presented from highest to lowest.)
Individual Benefit Levels in California Are Comparatively Low. The average UI claimant in California receives comparatively lower weekly benefits (4.5 percent lower than the national average wage replacement rate). In addition, UI claimants in California receive, on average, lower benefits over the entirety of a UI claim. Taken together, California's weekly wage replacement rate of 28.9 percent (ranked 43rd in the country) and total wage replacement rate of 20.3 percent (ranked 34th in the country) indicate that California's individual benefits levels are lower than those in the majority of other states.
Figure 2
Comparison of California's Individual Benefit Payments to Other States
2010–11
|
Measure
|
California
|
U.S.
|
Ten Largest
States
|
|
Value
|
Rank
|
|
Average Weekly Wage Replacement Rate
|
28.9%
|
43
|
33.4%
|
33.9%
|
|
Average Total Wage Replacement Rate
|
20.3
|
34
|
22.3
|
23.3
|
|
Benefits Duration and Exhaustion Rates
In Figure 3, we compare California's average benefits duration and exhaustion rates to the average of the United States and the ten largest states. As seen in the figure, UI claimants in California, on average, receive benefits for just over one week longer than both the national average and the average of the ten largest states. Also, about 5 percent more claimants exhaust their benefits in California than the national average.
Figure 3
Comparison of California's Average Benefits Duration and Exhaustion Rates to Other States
2010–11
|
Measure
|
California
|
U.S.
|
Ten Largest
States
|
|
Value
|
Rank
|
|
Average Benefits Duration (weeks)
|
19.3
|
10
|
18.0
|
18.1
|
|
Exhaustion Rate
|
56.0%
|
9
|
50.9%
|
52.0%
|
|
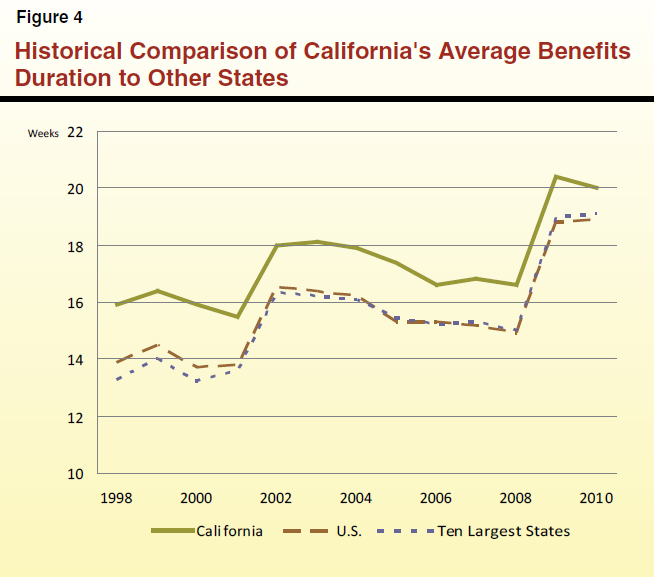
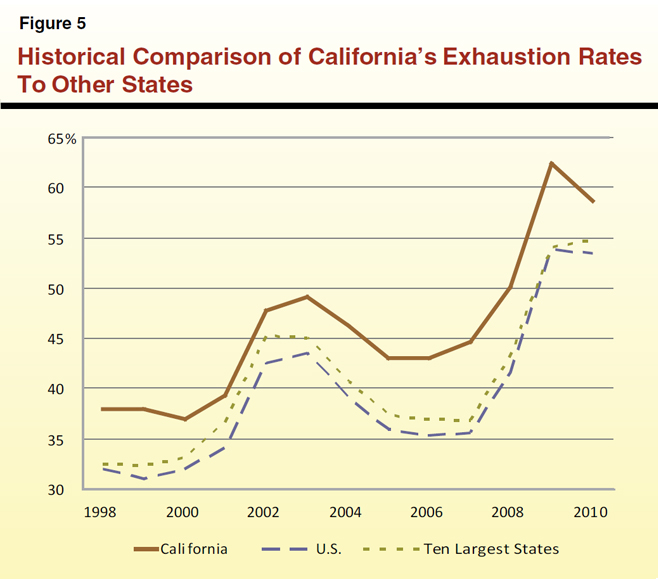
California's Average Benefits Duration and Exhaustion Rates Are Consistently Higher Than Other States. California's comparatively higher benefits duration and exhaustion rates are not unique to recent years. For more than a decade, California has consistently exceeded both the national average and the average of the ten largest states in both of these measures. During the period 1998 through 2010, California's average benefits duration has exceeded the national average by more than one and a half weeks, while its exhaustion rate has exceeded the national average by almost 7 percent. Figures 4 and 5 display California's average benefits duration and exhaustion rates as compared to the national average and the average of the ten largest states from 1998 to 2010.
What Factors Contribute to California's High Benefits Duration? California's prior earnings limit and labor market conditions both contribute to its comparatively higher benefits duration, as explained below.
The overwhelming majority of states have set a statutory maximum duration of 26 weeks. Consequently, it is the variability in states' prior earnings limits which contributes toward differences in duration rates. The prior earnings limit in the majority of states falls below California's limit of 50 percent, with the most common limit being one–third. California's limit is considerably more restrictive than the nine states which impose no prior earnings limit. As such, California's statutory limits on duration could be characterized as above average but not among the highest. Thus, California's comparatively higher prior earnings limit offers a potential explanation for its above average benefits duration. However, it is likely that California's prior earnings limit only partially explains its above average benefits duration, as we find evidence that its comparatively worse labor market conditions are also a contributing factor.
To examine the extent to which labor market conditions can explain California's high benefits duration, we analyzed data on unemployment spells in California and the other states. More specifically, we analyzed for all unemployed individuals (including those that are not receiving UI benefits) the average length of an unemployment spell, as well as the proportion of spells which last beyond 15 and 26 weeks. For much of the past decade, the average length of unemployment spells and the proportion of unemployed individuals beyond 15 and 26 weeks in California have exceeded the national average. For example, in 2010 the average unemployment spell in California (35 weeks) lasted two weeks longer than the national average (33 weeks), while its proportion of individuals unemployed beyond 15 weeks (58.7 percent) exceeded the national average by more than 5 percentage points. These statistics suggest that California's comparatively worse labor market conditions are also a likely contributor to its high benefits duration. This conclusion is supported by California's high exhaustion rate. California's rate shows that a comparatively larger percentage of UI claimants run out of benefits before finding a job. In part, this is likely due to the fact that it is harder for unemployed workers to become reemployed in California as compared to the average state.
Caseload Levels
Figure 6 compares California's IUR and recipiency rate to the national average and average of the ten largest states. During 2010–11, California's IUR exceeded the national average by more than a percentage point and ranked fifth in the country. On the other hand, its recipiency rate (27 percent) was 2 percentage points less than the national average (29 percent). Thus, we find a somewhat counterintuitive result: although a lower percentage of unemployed workers claim regular UI benefits in California, the state's relative UI caseload is higher than the majority of states. In part, this is because the recipiency rate only reflects claimants in the regular UI program (not those in federally funded emergency programs). Since 2007, the proportion of workers who have been unemployed beyond 26 weeks has increased considerably—from 17 percent to 46 percent in California. For this reason, recipiency rates in recent years are less reflective of historical norms. During the period 2000 to 2007, California's average recipiency rate was 42.3 percent and exceeded the national average by almost 3 percentage points.
Figure 6
Comparison of California's Insured Unemployment and Recipiency Rates to Other States
2010–11
|
Measure
|
California
|
U.S.
|
Ten Largest
States
|
|
Value
|
Rank
|
|
Insured Unemployment Rate
|
4.3%
|
5
|
3.2%
|
3.4%
|
|
Recipiency Rate
|
27.0
|
32
|
29.0
|
29.6
|
|
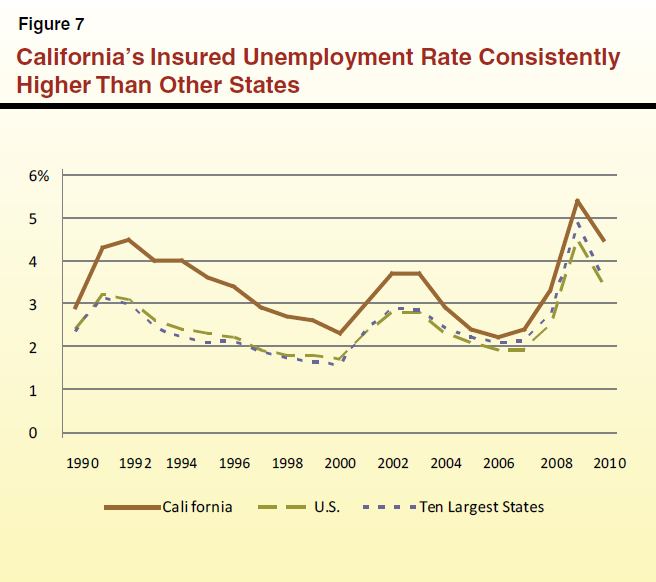
California's Relative Caseload Is Consistently Larger Than Other States. Over the past 20 years, California's IUR has consistently exceeded both the national average and the average of the ten largest states. During this period, California's IUR, on average, has exceeded the national IUR by almost 1 percentage point each year. Figure 7 shows the IUR for California, the nation, and the ten largest states for the period 1990 to 2010.
What Factors Contribute to California's High Caseload Levels? Empirical evidence suggests that California's high caseload is driven by three factors: (1) high overall unemployment rates, (2) high recipiency rates, and (3) longer benefits duration.
An increase in a state's overall unemployment rate will generally result in an increase in its UI caseload levels. In each of the last 20 years, California's unemployment rate has exceeded the unemployment rate of the nation and the ten largest states. As of August 2011, its unemployment rate exceeded the national rate by 3 percentage points.
A second factor of California's high caseload levels is high recipiency rates. Although California's recipiency rate has been below the national average since 2008, during the remainder of the past decade California's recipiency rate exceeded the national average by almost 3 percentage points on average. California's relatively low monetary eligibility requirements may provide some explanation for its historically higher recipiency rates. California's monetary eligibility requirement for UI benefits, which requires earnings of $1,125 in a base period, is lower than the majority of others states. This minimum threshold is equal to less than one and a half weeks earnings at the state's average weekly wage. By this measure, only five states have a lower threshold than California.
A final factor which likely contributes to California's high caseloads is its high average benefits duration—as discussed previously. In general, if it takes the average claimant longer to cycle through the program, the number of claimants in the program at any given time is likely to be higher than otherwise.
Adequacy of Funding
Figure 8 compares California's benefits–to–wages ratio and average effective tax rate to the average of the nation and the ten largest states. As Figure 8 shows, California's total benefit costs are comparatively higher, while its taxes are about average. California's benefits–to–wages ratio of 1.02 percent exceeds that of both comparison groups and ranks 15th highest in the country. Its average effective tax rate of 0.79 percent is slightly below both the national average (0.80 percent) and the average of the ten largest states (0.82 percent) and falls just below the national median, ranking 27th in the country.
Figure 8
Comparison of California's Total Benefit Costs and Average Effective Tax Rates to Other States
2010–11
|
Measure
|
California
|
U.S.
|
Ten Largest
States
|
|
Value
|
Rank
|
|
Benefits–to–Wages Ratio
|
1.02%
|
15
|
0.88%
|
0.88%
|
|
Average Effective Tax Rate
|
0.79
|
27
|
0.80
|
0.82
|
|
The disparity between California's total benefit costs and its average effective tax rate reflects the fact that during this period California underfunded its total costs by about 20 percent. While a portion of this can be attributed to the recent recession, we note that since 2001, California's benefits–to–wages ratio has exceeded its average effective tax rate in all but two years (2005 and 2006). This suggests that California's UI program has a structural mismatch between its revenues and total benefit costs. Absent significant improvement in California's labor market, this mismatch is likely to persist in the out years.
Why Are California's Total Costs High Despite Comparatively Low Weekly Benefits? Although California's UI program has a lower weekly wage replacement rate than the majority of states, it pays weekly benefits for a longer duration and to a relatively larger caseload. Overall, California's higher caseload and longer average benefits duration more than outweigh its lower weekly benefits, resulting in comparatively high total benefit costs. As discussed above, a portion of California's comparatively high caseload and longer benefits duration can be attributed to California's UI policies. However, it appears that a significant portion is attributable to other factors, such as consistently higher unemployment rates and longer average spells of unemployment. For this reason, irrespective of California's UI program policies, the total cost of providing a particular level of weekly benefits to unemployed workers is likely to be higher in California than the majority of other states.
Solvent Versus Insolvent States
In addition to comparing California's UI program to other states, we compared the average solvent state to the average insolvent state. In Figure 9 we compare an average solvent state to an average insolvent state on several statistics and measures. Our objective in doing so was to determine if a discernable pattern existed among solvent states which could be used to inform California's UI policies. For instance, we sought to determine if solvent states tax employers at a comparatively higher rate or, alternatively, provide less generous individual benefits.
Below, we summarize our key findings drawn from Figure 9.
Figure 9
Comparative Statistics for Solvent and Insolvent States
2010–11
|
Measure
|
Solvent (19)
|
Insolvent (32)
|
|
Total Unemployment Rate
|
7.5%
|
9.0%
|
|
Labor Force (in millions)
|
1.1
|
3.2
|
|
Number of Employers (in thousands)
|
66.9
|
194.2
|
|
Average Annual Wage
|
$39,579
|
$44,944
|
|
Averages Benefits Duration (in weeks)
|
17.4
|
17.5
|
|
Average Weekly Wage Replacement Rate
|
36.0%
|
34.9%
|
|
Average Total Wage Replacement Rate
|
22.9
|
22.7
|
|
Insured Unemployment Rate
|
2.8
|
3.2
|
|
Benefits–to–Wages Ratio
|
0.82
|
0.92
|
|
Average Effective Tax Rate
|
0.87
|
0.85
|
|
Solvent States and Insolvent States Have Similar Individual Benefit Levels. We find a small difference in benefit levels between solvent states and insolvent states, with solvent states having slightly higher benefits. Weekly wage replacement rates in the average solvent states (36 percent) exceed those in the average insolvent state (34.9 percent) by about 1 percentage point. For the total wage replacement rate, this gap is almost eliminated. Altogether, the differences in individual benefit levels between solvent and insolvent states appear to be minor.
Employer Taxes About the Same for Solvent and Insolvent States. On average, effective employer tax rates are about the same in solvent states (0.87 percent) and insolvent states (0.85 percent). In addition, solvent states appear to be about evenly distributed between lower tax and higher tax categories. The effective tax rate is below the national average in nine solvent states and above the national average in ten solvent states.
Labor Market Conditions Differ Significantly Between Solvent and Insolvent States. Our analysis finds that the several external factors, such as unemployment rates, labor force size, and wage levels, differ significantly across solvent and insolvent states. In general, we find that unemployment in solvent states was impacted significantly less than insolvent states by the recent recession. The average unemployment rate among solvent states is 7.5 percent as compared to 9 percent among insolvent states. In addition, both the size of the labor force and the number of employers are significantly smaller in solvent states, on average, than insolvent states. The average labor force among solvent states is 1.1 million, as compared to 3.2 million among insolvent states. Similarly, the average number of employers among solvent states (66,947) is less than among insolvent states (194,219). Finally, the average annual wage in solvent states (about $40,000) is around $5,000 less than insolvent states.
The observations above suggest that adherence to a particular set of polices (that is, higher taxes and/or lower benefits) was far less significant to solvency than non–policy factors (such as the state's unemployment rate).
ISSUES FOR LEGISLATIVE CONSIDERATION
In this section, we summarize the key findings of our analysis that may assist the Legislature in considering potential solutions to California's UI insolvency.
- California's UI Program Pays Low Weekly Benefits, Yet Has High Total Costs. Although California's UI program pays comparatively lower weekly benefits, it pays these benefits for a longer duration and to a relatively larger caseload. As a result, California has comparatively higher total program costs. This implies that providing unemployed workers a given level of weekly benefits in California results in greater total UI costs than in the majority of other states.
- Major Factors Contributing to California's High UI Costs Have Persisted for Several Years. California's comparatively higher caseload and longer benefits duration are not unique to recent years. For both of these measures, California has consistently exceeded the national average for more than a decade.
- Changes to California's UI Program Policies Could Somewhat Mitigate Its High Costs. To the extent that the Legislature wishes to address California's comparatively high UI costs, it may consider changes to UI program policies, such as reducing the prior earnings limit or tightening program eligibility requirements. However, we do note that the ability of policy reforms to reduce UI costs may be limited, as factors beyond the immediate control of program policies, such as the state's labor market conditions, significantly contribute to California's higher UI costs.
- State Economic Health Has Strong Impact On UI Solvency. During the recent recession, differences in unemployment rates and program caseloads appear to explain varying levels of UI fund solvency better than adherence to specific policy paradigms (higher taxes and/or less generous benefits).