Introduction
In 2010–11, UC spent about $1.8 billion on salaries and benefits for its tenured and tenure–track faculty. These faculty are central to fulfilling the university’s teaching, research, and public service missions. Given the significant amount spent on these faculty, as well as the importance of the university’s mission, this report examines the university’s ability to recruit and retain high–quality faculty. First, we provide background information on faculty. Next, we examine data from recent years on faculty hiring and retention patterns as well as faculty compensation. Finally, we discuss the implications of our findings for the Legislature as it considers the university’s budget moving forward.
Background
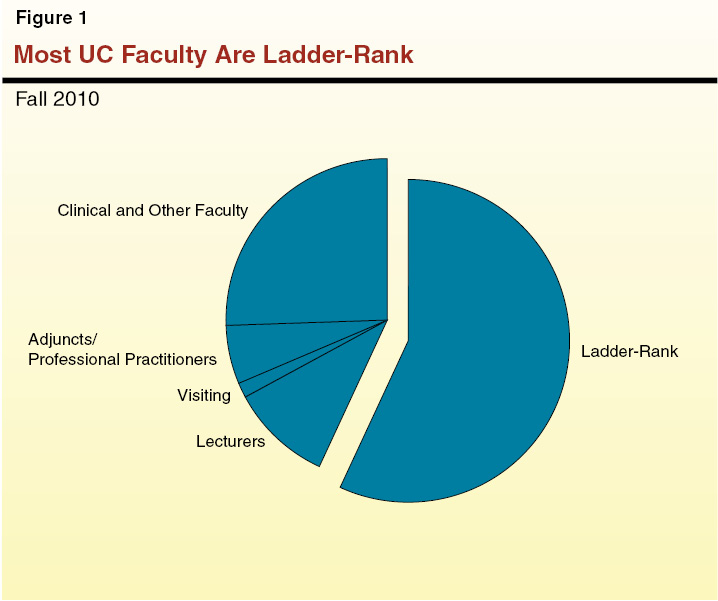
Types of Faculty. In 2010–11, the university employed 15,900 FTE faculty. The university divides these faculty into different classifications, depending on their specific job responsibilities and terms of employment. As shown in Figure 1, just over half (about 8,900 FTE) of all faculty are classified as ladder–rank. These faculty generally are considered to be the university’s core faculty at the ten UC campuses. They cover all disciplines, including the health sciences. They also make up a majority of the Academic Senate, which sets academic policies. Ladder–rank faculty are distinct from other faculty in that they (1) are tenured or tenure–eligible and (2) have a full range of teaching, research, and public service responsibilities. In contrast, other faculty are not eligible for tenure and typically have a narrower range of responsibilities. For these reasons, we focus exclusively on ladder–rank faculty in this report and, when we use the term “faculty,” we are referring to “ladder–rank faculty” (unless otherwise noted).
Faculty Ranks. Like most other research universities, UC’s faculty job classification includes three levels (more commonly known as “ranks”): Assistant Professor, Associate Professor, and Professor. The Assistant Professor position is an entry–level, two–year contract position that may be renewed for a maximum of eight years. After eight years, an Assistant Professor must have earned tenure or the university discontinues employment. (Since Assistant Professor positions offer this path to tenure, they are known as “tenure–track” positions.) In contrast, the more senior positions of Associate Professor and Professor are tenured, permanent positions. The university may only discontinue employment of these professors with good cause, and, in practice, this happens rarely.
Faculty Salaries. For faculty in most disciplines, the university uses the faculty salary system summarized in Figure 2. Under this system, each faculty rank has a certain number of steps associated with it. Each step then corresponds to a specific salary. For example, at the Associate Professor level, the salary at the bottom step is $68,100 annually, while the salary at the top step is $86,200 annually. The university has a merit review process that allows faculty to receive raises by advancing to higher steps and ranks. In some years, the university also provides all faculty with raises by increasing the salary paid at each step—intended to address inflation and/or make its salaries more competitive. In addition, the university allows faculty to receive raises in certain other circumstances—such as when a faculty member receives another job offer. Because the university allows for such exceptions, about two–thirds of general campus faculty actually earn more than the maximum for their step/rank (on average about $19,000 more). Faculty are not unionized, except at one campus (Santa Cruz).
Figure 2
UC Faculty Salary Systema
2011–12
|
|
Number of Steps
|
Years at Each Stepb
|
Annual Salary
|
|
Assistant Professor
|
6
|
2
|
$54,800 to $71,300
|
|
Associate Professor
|
5
|
2 to 3
|
68,100 to 86,200
|
|
Professor
|
9
|
3
|
80,100 to 146,300
|
Faculty Benefits. The university provides faculty with a number of benefits, such as for health care and pensions. The university estimates that the cost of these benefits for a faculty member is equal to about one quarter of their pay. Though the types of benefits faculty receive tend to remain the same from year to year, the specific terms of certain benefits sometimes change. For example, the university has increased employee contributions to its pension plan in recent years due to a funding shortfall.
Spending on Faculty. In 2010–11, UC spent a total $1.8 billion on salaries and benefits for faculty. As shown in Figure 3, nearly three quarters of the funding for faculty compensation came from the state. The remaining funding sources include a mix of federal funds, sales revenues (such as from clinical services provided at the university’s medical centers), private gifts, student tuition, and other funds. (Though student tuition makes up a relatively small portion of funding supporting faculty, the university could use more tuition revenue in lieu of state funds since the two fund sources are interchangeable.) In addition to these personnel expenses, the university incurs other costs to support faculty, such as for facilities and equipment.
Major Findings
The recruitment, retention, and compensation data that we examine below comes from UC’s central office. Some individual campuses collect additional data, but we focus on systemwide trends since the state generally focuses its policy and budget decisions on the university as a whole. Data was available from UC on several key recruitment and retention indicators, although we were unable to obtain information on a few important indicators, such as the number of vacant faculty positions. For the most part, the data includes all ladder–rank faculty, except in certain cases, where the university excludes faculty in the health sciences. Most data was available through 2010–11 or 2011–12.
UC Hiring Faculty From Among Best Candidates Available
Most New UC Faculty Received Their Degrees From Top Universities. Measuring new faculty qualifications based on the reputation of the university from which the faculty member graduated is one way to assess the quality of new faculty hires. As shown in the first column of Figure 4, between 2001–02 and 2010–11, the top four institutions from which new UC faculty received their degree (typically, the doctoral degree) were Stanford, Harvard, MIT, and Yale. Together, about 18 percent of new UC faculty received their highest degree from one of these four institutions. The next most represented universities include several Ivy League and other top–ranked universities, such as Princeton, Columbia, and the California Institute of Technology. In addition, about 24 percent of new UC faculty received their highest degree from one of the UC campuses. As shown in the second column of Figure 4, this pattern of hiring faculty who graduated from top universities continued in 2010–11. For example, in that year a slightly higher percentage of new faculty hired by UC had attended either Stanford, Harvard, MIT, or Yale.
Figure 4
Most New UC Faculty Graduated From Top Universities
|
Universitya
|
Percent of All New UC Faculty
|
|
2001–02 Through 2010–11
|
2010–11 Only
|
|
Stanford
|
6%
|
8%
|
|
Harvard
|
5
|
6
|
|
Massachusetts Institute of Technology
|
3
|
2
|
|
Yale
|
3
|
4
|
|
Subtotals
|
(18%)
|
(20%)
|
|
University of Chicago
|
2%
|
2%
|
|
University of Michigan (Ann Arbor)
|
2
|
—
|
|
Princeton
|
2
|
2
|
|
Cornell
|
2
|
3
|
|
California Institute of Technology
|
2
|
1
|
|
University of Pennsylvania
|
1
|
3
|
|
New York University
|
1
|
1
|
|
Columbia
|
1
|
—
|
|
University of Wisconsin (Madison)
|
1
|
2
|
|
Duke
|
1
|
2
|
|
Northwestern
|
1
|
1
|
|
Johns Hopkins
|
1
|
1
|
|
University of Washington (Seattle)
|
1
|
—
|
|
University of Minnesota
|
1
|
1
|
|
University of Southern California
|
1
|
1
|
|
University of Texas (Austin)
|
1
|
—
|
|
Subtotals
|
(22%)
|
(18%)
|
|
UC
|
24%
|
25%
|
|
All Other Universities
|
36
|
37
|
|
Totals
|
100%
|
100%
|
Most New UC Faculty Have Been the University’s Top Choice Candidate. Another, more direct way that the university in the past has gauged its success in faculty hiring is by tracking how many of its faculty hires were the best candidate available, according to the university’s own assessment of all the candidates’ qualifications. From the mid–1980s through 2004–05, the university in most years hired its top choice faculty candidate over 85 percent of the time. After that time, UC stopped collecting this data centrally, so unfortunately what percentage of first choice candidates it has been hiring in recent years is unknown. However, the fact that UC’s recruitment efforts do not appear to have been hindered by previous economic recessions and budget shortfalls over a two–decade period suggests that the recent recession might not have had a particularly pronounced effect on UC’s recent recruitment efforts.
UC Retaining Most Faculty
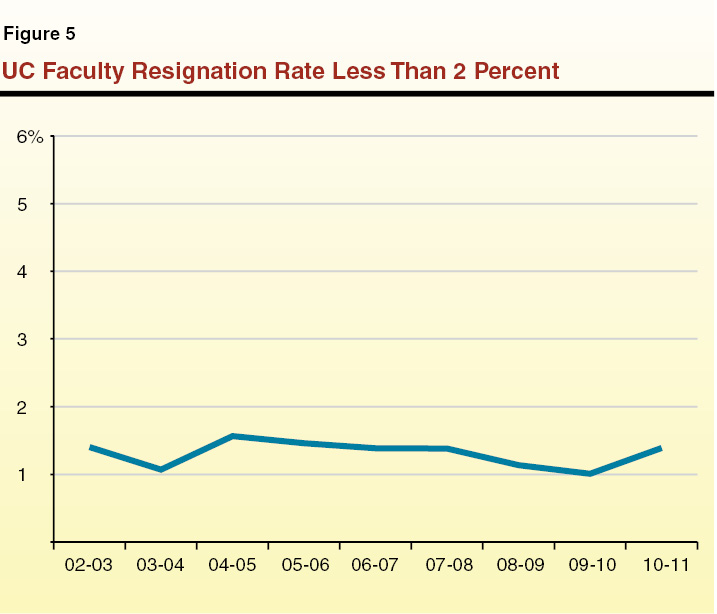
Less Than Two Percent of Faculty Resign Each Year. Separation rates show how many employees are leaving an organization compared to the size of its workforce. Faculty separations are tracked separately for (1) resignations, (2) retirements, and (3) other causes. (Separation rates due to other causes, such as death, are rare.) For the purposes of measuring UC’s success in retaining faculty, the resignation rate is the most important indicator since it most closely relates to faculty choosing to leave UC for other employers. As shown in Figure 5, UC’s faculty resignation rate has been less than 2 percent each year over the last decade. This means that from year to year, nearly all faculty choose to continue to work at UC.
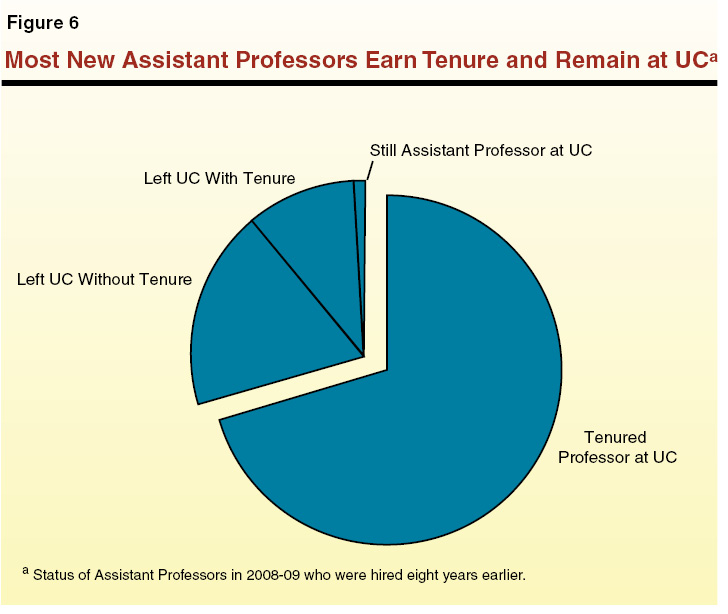
Most New Assistant Professors Ultimately Earn Tenure and Remain at UC. Another important indicator of faculty retention is the percentage of new Assistant Professors who later become tenured and stay at the university. The university tracks the retention rates of new Assistant Professors for eight years since they must, with limited exceptions, earn tenure within that time or else leave the university. As shown in Figure 6, 70 percent of the Assistant Professors hired in 2000–01 had earned tenure and were still working at the university in 2008–09. In contrast, 10 percent of Assistant Professors in this same cohort had earned tenure and then left the university. (For the remaining Assistant Professors in the cohort who left the university prior to receiving tenure, it is unclear whether these faculty left because they expected a negative tenure decision or for other reasons.) Three prior cohorts of Assistant Professors hired between 1997 and 2000 had similar tenure and departure rates as this cohort.
UC Faculty Compensation Competitive With Top Universities
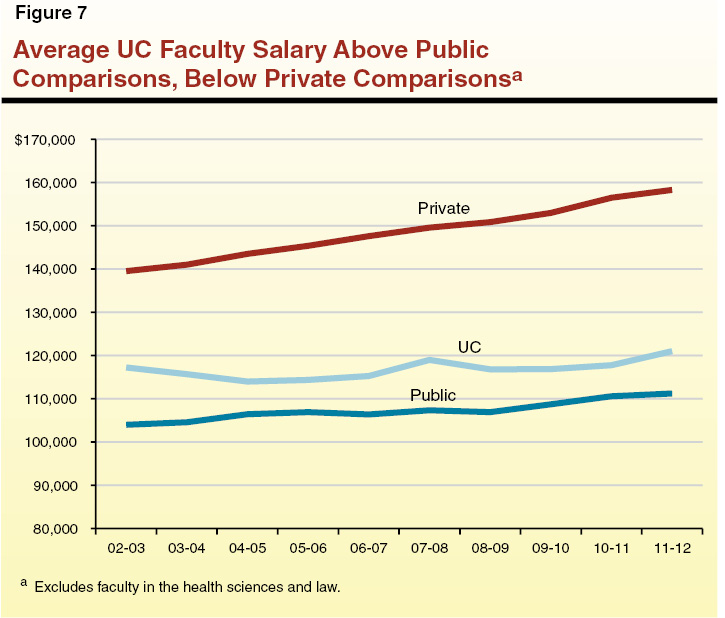
UC Faculty Salaries Above Public Comparisons, Below Private Comparisons. To assess its competitiveness on faculty salaries, UC compares its salaries with those at four public and four private institutions. (In the nearby box, we discuss concerns our office has expressed in the past with the comparison institutions selected.) As shown in Figure 7, UC’s average faculty salary has been higher than the average faculty salary at the four public institutions for the last ten years. Over the same period, the average faculty salary at UC has been below the four private institutions. Since that time, UC has approved budget plans providing across–the–board salary increases of 3 percent annually for faculty in 2012–13 and 2013–14, as well as funding for merit increases. In addition, it has approved supplemental salary increases for faculty in 2013–14 intended to boost faculty salaries closer to the private comparison institutions. (The approved increases, however, could be revised prior to taking effect.)
Comparison Institutions Methodology Raises Concerns
Methodology. The University of California (UC) compares its average faculty salary and total faculty compensation with the average of four private institutions (Harvard, the Massachusetts Institute of Technology, Standford, and Yale) and four public institutions (the State University of New York (Buffalo), the University of Illinois (Urbana), the University of Michigan (Ann Arbor), and the University of Virginia). In making comparisons, the university adjusts for differences in the distribution of faculty across ranks at UC and the comparison institutions since a university with more senior faculty would be expected to have a higher average salary. The university also excludes faculty in law and the health sciences. The comparison institutions and the methodology used to compare salaries were agreed to informally many years ago by the university and the state.
Three Main Concerns. As we have discussed in previous publications, such as our Analysis of the 2007–08 Budget Bill, we believe that the basis for this set of comparison institutions and the methodology used to compare salaries has some drawbacks. Specifically, we find that the comparison institutions methodology suffers from the following shortcomings.
- Assumes All UC Campuses Are the Same. By using a single average faculty salary for all UC campuses, the methodology presumes that all UC campuses are in the same faculty market. In reality, UC is a large, diverse university system with campuses of differing national reputation. The average faculty salary differential across UC campuses supports this view. For example, the average faculty salary at UC’s most selective campus (Berkeley) is 20 percent to 30 percent higher (depending on rank) than the average faculty salary at its least selective campus (Merced).
- Includes Too Few Comparison Institutions. The comparison group includes eight institutions. However, only 15 percent of tenured faculty who left UC between 2000–01 and 2009–10 went to one of these eight institutions. Such a small number of comparison institutions may not reflect the broader academic market in which UC competes. In addition, all of the comparison institutions are single universities, whereas UC is a large, multicampus system.
- Ignores Salary Variations by Discipline. Except for law and the health sciences (which are excluded entirely), the methodology used by UC to compare faculty salaries does not take into account variation in faculty salaries by discipline. Yet, faculty in some disciplines tend to earn higher salaries than faculty in other disciplines. For example, faculty in business and management tend to have significantly higher salaries than faculty in engineering, and faculty in engineering tend to earn more than faculty in the humanities. This means that institutions with more faculty in high–paying disciplines likely have a higher average salary. Since UC’s methodology does not compare average faculty salaries by discipline, it may not accurately represent the competitiveness of its salaries.
UC Total Faculty Compensation Competitive With Comparison Institutions. In addition to salary, total faculty compensation includes benefits, such as health care and pensions. In recent years, UC has begun to study how its total faculty compensation compares to the eight comparison institutions. According to the university’s latest study from 2009, UC’s total faculty compensation was 4 percent below the average of its competitors. Since the study defines competitive as being within 5 percent above or below the market average, it appears that taking benefits into account results in UC being competitive with the average of its eight comparison institutions. This suggests UC has a competitive advantage on benefits compared with the private comparisons that basically makes up for its lower average salary. Since this study was released, the university has made some changes to its benefits. For example, the university increased employee contributions to UC’s pension plan, which reduced take–home pay for faculty. The increased contributions, however, have been more than offset by general salary increases provided during the same time.
Most Faculty Do Not Leave UC or Reject UC Job Offers Due to Compensation. Another way that UC in the past has measured the competitiveness of its faculty compensation is by surveying its campuses asking why faculty candidates declined job offers as well as why faculty left the university. As shown in Figure 8, salary was cited about one–third of the time in UC’s two most recent surveys from the mid–2000s. (Around that same time, UC calculated that its faculty salaries were about 5 percent to 10 percent below those of its comparison institutions.) Faculty cited several other factors affecting their recruitment and retention decisions, such as location, personal circumstances, teaching workload, research funding, and facilities. Some of these factors—including location and personal circumstances—were reported to be about as important as compensation. Though UC has decided not to collect this data in recent years, these findings indicate that other factors besides compensation play an important role in recruitment and retention decisions. Despite the importance of these other factors, UC historically has sought to collect more detailed data only on how its compensation levels compare to other universities. It has not routinely compared itself with other institutions on factors, such as teaching workload and research funding, which also appear to affect recruitment and retention decisions.
Figure 8
Reasons Faculty Cite for Rejecting UC Job Offer or Leaving UC
|
Reasona
|
Rejecting Job Offerb
|
Leaving UCc
|
|
Salary
|
33%
|
37%
|
|
Family reasons
|
33
|
18
|
|
Geography
|
31
|
4
|
|
Housing problems
|
22
|
13
|
|
Inadequate facilities
|
14
|
7
|
|
Perceived lack of public support for UC
|
14
|
12
|
|
Spousal employment
|
12
|
9
|
|
Research funding
|
12
|
9
|
|
Offer not timely
|
10
|
—
|
|
Cost of living (besides housing)
|
11
|
7
|
|
Administrative workload
|
8
|
10
|
|
Teaching workload
|
2
|
10
|
|
Other reasons
|
33
|
57
|
Implications for State Budget Decisions
The UC Typically Seeks Annual Increases in State Funding to Support Increases in Faculty Salaries. Each year, UC adopts an annual budget plan that typically includes increases for faculty salaries. In turn, UC then requests funding from the state to support these (and other) cost increases. In years when the state augments UC’s budget to support its increased costs, it typically does not earmark funding for faculty salary increases, but, by providing a general purpose augmentation, a portion of state funding typically goes toward this purpose. As noted earlier, the university’s most recent budget plan (2013–14) assumes increases in both faculty salaries and associated state funding.
Available Data Suggest UC’s Recruitment and Retention Efforts Are Successful. Based on our review of available data, UC generally appears to have been successful in its recruitment and retention efforts. Notably, based on multiple indicators—in some cases tracked over relatively long periods of time—the university has been successful in hiring top faculty candidates; the vast majority of individuals hired as Assistant Professors stay at the university for the initial eight years typically taken to obtain tenure; very few faculty resign from UC each year; average faculty salaries at UC are higher than at its public comparison institutions; and UC’s benefits make it competitive with top private universities on total compensation. One concern, however, is that some key data were not available for 2010–11 and 2011–12 that would help the university and Legislature better understand how successful UC has been in its most recent recruitment and retention decisions. Given the relatively comprehensive data we reviewed, a few additional data points probably would not result in the Legislature reaching significantly different conclusions than those reached in this report. Nonetheless, we suggest the Legislature consider any rigorous, reliable, additional data the university can bring to bear on the issue. For example, the Legislature could benefit from additional UC data on the number of top choice faculty candidates hired in recent years, the reasons cited recently by faculty when they reject job offers or resign from the university, and the competitiveness of UC’s benefits today compared to other universities.
Other Faculty and Higher Education Funding Priorities to Consider. In light of the many indicators suggesting UC has been successful in its faculty recruitment and retention efforts, the Legislature needs to assess the trade–offs between providing funding for faculty salary increases and other competing budget priorities involving faculty and higher education more generally. For example, the state often has provided UC with funding for enrollment growth, which takes into account how much it costs to hire new faculty. In addition, in 2012–13, the state provided UC with some funding for its pension costs (a significant portion of which relate to faculty), and UC has identified substantial additional unmet pension costs. Moreover, the Legislature could consider providing funding to reduce UC’s student–to–faculty ratio. This ratio has increased in recent years because the university has delayed hiring new faculty in response to state budget reductions. Though this report does not examine the relative merits of expanding enrollment, funding pension shortfalls, or reducing student–to–faculty ratios, these are some examples of competing university funding priorities related to faculty. If the Legislature were to provide additional funding for the university, it will need to consider the relative importance of increasing faculty salaries compared with addressing these other priorities.