In this report, we analyze the Governor’s 2014–15 Proposition 98 budget package. The report begins with background on the basics of Proposition 98 and school finance. The next two sections provide an overview of the Governor’s Proposition 98 package. The subsequent sections analyze each of the Governor’s major Proposition 98 proposals.
State budgeting for schools and community colleges is governed largely by Proposition 98, passed by voters in 1988. The measure, modified by Proposition 111 in 1990, establishes a minimum funding requirement for schools and community colleges, commonly referred to as the minimum guarantee. Both state General Fund and local property tax revenue apply toward meeting the minimum guarantee. As described in Figure 1, the Proposition 98 minimum guarantee is determined by one of three tests set forth in the State Constitution. These tests are based on several inputs, including changes in K–12 average daily attendance (ADA), local property tax revenues, per capita personal income (PCPI), and per capita General Fund revenue.
Figure 1
Calculating the Proposition 98 Minimum Guarantee
|
|
|
Three Tests Used to Determine Minimum Guarantee:
|
|
Test 1—Share of General Fund. Provides roughly 40 percent of state General Fund revenues to K–14 education. The guarantee was determined using this test 3 of the last 25 years.
|
|
Test 2—Growth in Per Capita Personal Income. Adjusts prior–year Proposition 98 funding for changes in K–12 attendance and per capita personal income. The guarantee was determined using this test 13 of the last 25 years.
|
|
Test 3—Growth in General Fund Revenues. Adjusts prior–year Proposition 98 funding for changes in K–12 attendance and per capita General Fund revenues. Generally, this test is operative when General Fund revenues grow more slowly than per capita personal income. The guarantee was determined using this test 7 of the last 25 years.
|
Applicable Test Determined Automatically. The applicable test used to determine the Proposition 98 minimum guarantee is triggered automatically depending on the inputs. Until inputs are finalized (which can take up to 24 months after the close of a fiscal year), the applicable test can fluctuate and the minimum guarantee can change significantly.
State Can Provide More or Less Than Minimum Guarantee. Although the Proposition 98 tests apply automatically, the Legislature can provide more or less funding than the tests require. For example, in 1999–00, when state revenues were booming, the Legislature provided $1.8 billion more than required under the minimum guarantee. Alternatively, in 2004–05 and 2010–11, the Legislature suspended the minimum guarantee and provided less than would otherwise have been required. To suspend the minimum guarantee requires a two–thirds vote of each house of the Legislature and creates an out–year obligation to return K–14 funding to where it otherwise would have been absent the suspension (discussed further below).
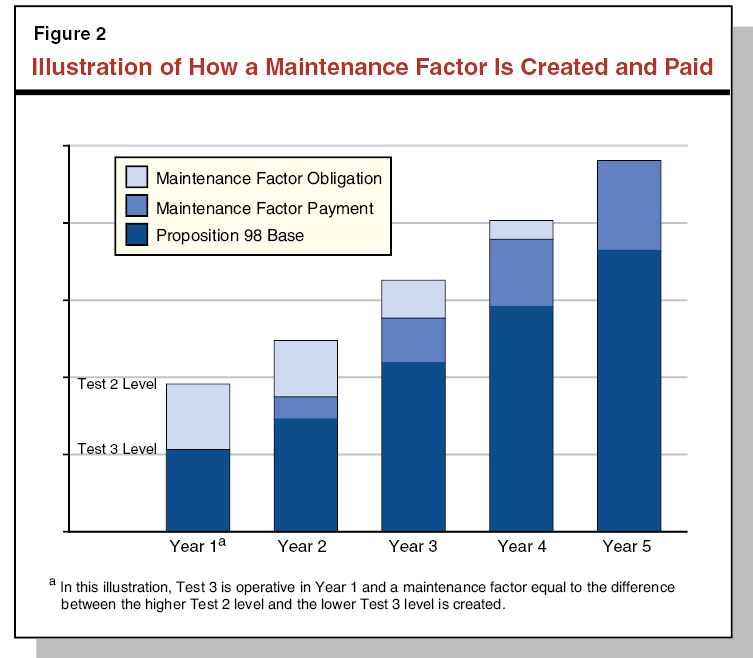
State Creates “Maintenance Factor” Obligation in Certain Years. Proposition 98 allows the state to provide less funding than the Test 2 level in Test 3 or suspension years. In these years, the state creates a maintenance factor obligation—equal to the difference between the higher Test 2 level and the amount of funding actually provided. In future years, the maintenance factor is adjusted for changes in K–12 attendance and growth in PCPI. As such, the maintenance factor obligation keeps track of the amount of funding needed to ensure the earlier reduction does not adversely affect schools and community colleges in the long run. The state has carried an outstanding maintenance factor obligation in 18 of the past 23 years, including an estimated $5.5 billion obligation at the end of 2012–13.
Maintenance Factor Payments Based on Growth in General Fund Revenues. When the state is carrying a maintenance factor obligation, Proposition 98 requires the state to provide additional payments until the entire maintenance factor obligation has been paid off. Figure 2 illustrates how these maintenance factor payments are made. The required maintenance factor payment is determined by formula and depends on how quickly state revenues grow. When state revenues grow quickly, larger payments are made and the obligation is paid off in a shorter period of time. Until all maintenance factor is paid off, the state generates savings each year compared to the level it otherwise would have been required to spend.
Most Proposition 98 Funding Provided for General Purposes. Upon determining the amount of total Proposition 98 funding to provide, the Legislature decides how to spend the associated funds. The Legislature allocates funds to schools and community colleges for one of two basic purposes—general (or unrestricted) purposes and categorical (or restricted) purposes. The state allocates general purpose funding to schools through the LCFF and to community colleges through apportionments. Currently, 86 percent of all Proposition 98 funding is allocated in this manner, with the remaining 14 percent allocated for various categorical programs.
Most School Funding Provided Through LCFF. In 2013–14, the state eliminated roughly three–quarters of its K–12 categorical programs and shifted those funds into the newly created LCFF. (Prior to 2012–13, general purpose funding was provided through K–12 revenue limits.) Under the LCFF, school districts receive the bulk of their funding based on ADA in four grade spans, with per–pupil funding higher for the upper grades. The LCFF provides additional funds to school districts based on their numbers of English learner (EL), low–income (LI), and foster youth students. In 2013–14, 86 percent of K–12 Proposition 98 funding was provided through the LCFF.
As part of its budget package, the administration has updated its estimates of the minimum guarantee for 2012–13, 2013–14, and 2014–15. We describe the major changes below.
2012–13 Changes
Minimum Guarantee Up $1.9 Billion. As shown in Figure 3, the administration’s revised estimate of the 2012–13 minimum guarantee is $58.3 billion, a $1.9 billion increase from the estimate made at the time the 2013–14 budget was enacted. Of the increase in the minimum guarantee, roughly $1.8 billion is due to General Fund revenues being $1.7 billion higher than previously budgeted. The minimum guarantee increases by more than the increase in General Fund revenues due to 2012–13 being a Test 1 year with a large required maintenance factor payment. In these situations, the minimum guarantee is very sensitive to changes in General Fund revenues, with the marginal increase in the minimum guarantee sometimes even greater than the marginal increase in revenues. The remaining $126 million increase in the 2012–13 minimum guarantee is due to baseline property tax revenues being higher than previously budgeted. Because 2012–13 is a Test 1 year, increases in baseline property tax revenues result in higher funding for schools and community colleges.
Figure 3
Increase in 2012–13 and 2013–14 Proposition 98 Minimum Guarantees
(In Millions)
|
|
2012–13
|
|
2013–14
|
|
Budgeted
|
Revised
|
Change
|
Budgeted
|
Revised
|
Change
|
|
Minimum Guarantee
|
|
|
|
|
|
|
|
|
General Fund
|
$40,454
|
$42,207
|
$1,752
|
|
$39,055
|
$40,948
|
$1,893
|
|
Local property tax
|
16,011
|
16,135
|
124
|
|
16,226
|
15,866
|
–361
|
|
Totals
|
$56,465
|
$58,342
|
$1,877
|
$55,281
|
$56,813
|
$1,532
|
Total Costs Lower by $130 Million. Though the Governor’s estimate of the minimum guarantee has increased, his estimate of 2012–13 Proposition 98 costs has decreased by $130 million. This is the net effect of savings due to lower–than–expected ADA in part offset by higher costs for basic aid districts.
- Slightly Lower ADA Costs. Rather than increasing by 0.06 percent, as was assumed in the 2013–14 budget plan, ADA decreased by 0.07 percent—reducing costs by $200 million. (A few other costs—most notably for K–3 Class Size Reduction—also went down slightly.)
- Higher Basic Aid Costs. Proposition 30 requires school districts to receive at least $200 per student and community colleges to receive at least $100 per full–time equivalent (FTE) student from revenues in the newly created Education Protection Account (EPA). For most school and community college districts, EPA revenues offset state General Fund costs. For basic aid districts—whose property tax revenues are sufficiently high that they receive no state general purpose aid—the state is required to make EPA payments to ensure they receive the required per–student EPA funding. These EPA obligations ended up being $68 million for school districts and $9 million for community colleges in 2012–13.
2013–14 Changes
Minimum Guarantee Up $1.5 Billion. As shown in Figure 3, the administration’s revised estimate of the 2013–14 minimum guarantee is $56.8 billion, a $1.5 billion increase from the amount assumed in the 2013–14 budget. This increase is primarily due to the higher 2012–13 minimum guarantee and higher year–to–year growth in per capita General Fund revenues.
Spike Protection Provision Reduces Ongoing Effect of Increase in 2012–13 Minimum Guarantee. Though the 2013–14 guarantee is up from budget act estimates, it remains $1.5 billion below the revised 2012–13 level despite General Fund revenues increasing by $1.7 billion from 2012–13 to 2013–14. The decrease in the 2013–14 minimum guarantee is due to the spike protection provisions of Proposition 98. In a year when the minimum guarantee increases at a much faster rate than PCPI, the spike protection provision excludes a portion of Proposition 98 funding from the minimum guarantee calculation in the subsequent year. In 2012–13, because of the economic recovery and additional revenues from Proposition 30, the minimum guarantee increased $11 billion. The spike protection provision excludes $2.3 billion in 2012–13 funding from the Proposition 98 calculations moving forward, reducing the 2013–14 minimum guarantee by a like amount.
Total Costs $150 Million Lower. The Governor’s estimate of 2013–14 spending is down $150 million from the amount assumed in the 2013–14 budget, primarily due to lower–than–expected student attendance. (The 2013–14 budget assumed ADA growth of 0.2 percent, while the Governor’s budget assumes a 0.01 percent increase in ADA.) Lower attendance results in a $217 million drop in LCFF costs. These lower costs are partly offset by a $77 million increase to make EPA payments to basic aid school and community college districts. (As in 2012–13, the 2013–14 budget did not include funding for this purpose.)
Lower Estimate of Property Tax Revenues Increases General Fund Costs. Though the minimum guarantee is up $1.5 billion, the state’s General Fund Proposition 98 requirement is up $1.9 billion due to estimated local property tax revenues decreasing by $361 million. As Figure 4 shows, this decrease is primarily driven by lower redevelopment agency (RDA) revenues. For 2013–14, the Governor projects ongoing RDA revenues will be $405 million lower than estimated—a $433 million reduction in asset revenues offset by a $29 million increase in ongoing RDA revenues. The administration anticipates that court rulings will delay the distribution of some former RDA assets that were assumed to provide state General Fund savings in 2013–14.
Figure 4
Proposition 98 Property Tax Revenue Estimates
(In Millions)
|
|
2013–14
Budget Act
|
2014–15
Governor’s Budget
|
Difference
|
|
2012–13
|
|
|
|
|
Ongoing residual RDA revenues
|
$898
|
$936
|
$38
|
|
RDA assets
|
1,160
|
1,167
|
8
|
|
All other
|
13,954
|
14,032
|
79
|
|
Totals
|
$16,011
|
$16,135
|
$124
|
|
2013–14
|
|
|
|
|
Ongoing residual RDA revenues
|
$790
|
$818
|
$29
|
|
RDA assets
|
707
|
274
|
–433
|
|
All other
|
14,729
|
14,773
|
44
|
|
Totals
|
$16,226
|
$15,866
|
–$361
|
|
|
2013–14
Revised
|
2014–15
Governor’s Budget
|
Difference From 2013–14
|
|
2014–15
|
|
|
|
|
Ongoing residual RDA revenues
|
$818
|
$743
|
–$76
|
|
RDA assets
|
274
|
42
|
–232
|
|
All other
|
14,773
|
15,712
|
939
|
|
Totals
|
$15,866
|
$16,497
|
$631
|
2014–15 Changes
2014–15 Minimum Guarantee $4.7 Billion Above Revised 2013–14 Level. The administration estimates the minimum guarantee will be $61.6 billion in 2014–15. As Figure 5 shows, this is $4.7 billion higher than the revised 2013–14 minimum guarantee. About $3.9 billion of the increase in the minimum guarantee is driven by the year–to–year increase in General Fund revenues. As in 2012–13, 2014–15 is a Test 1 year in which the strong growth in General Fund revenues results in a large maintenance factor payment ($3.3 billion). The remaining increase in the minimum guarantee is due to higher property tax revenues. Because 2014–15 is a Test 1 year, increases in baseline and ongoing RDA property tax revenues result in a higher Proposition 98 minimum guarantee. (Changes in RDA assets do not affect the minimum guarantee due to rebenching.)
Figure 5
Proposition 98 Funding
(Dollars in Millions)
|
|
2012–13 Revised
|
2013–14 Revised
|
2014–15 Proposed
|
Change From 2013–14
|
|
Amount
|
Percent
|
|
Preschool
|
$481
|
$507
|
$509
|
$2
|
—
|
|
K–12 Education
|
|
|
|
|
|
|
General Fund
|
$37,740
|
$36,361
|
$40,079
|
$3,718
|
10%
|
|
Local property tax revenue
|
13,895
|
13,633
|
14,171
|
537
|
4
|
|
Subtotals
|
($51,634)
|
($49,995)
|
($54,250)
|
($4,255)
|
(9%)
|
|
California Community Colleges
|
|
|
|
|
|
|
General Fund
|
$3,908
|
$4,001
|
$4,396
|
$395
|
10%
|
|
Local property tax revenue
|
2,241
|
2,232
|
2,326
|
94
|
4
|
|
Subtotals
|
($6,149)
|
($6,233)
|
($6,723)
|
($489)
|
(8%)
|
|
Other Agencies
|
$78
|
$78
|
$77
|
–$1
|
–1%
|
|
Totals
|
$58,342
|
$56,813
|
$61,559
|
$4,746
|
8%
|
|
General Fund
|
$42,207
|
$40,948
|
$45,062
|
$4,115
|
10%
|
|
Local property tax revenue
|
16,135
|
15,866
|
16,497
|
631
|
4
|
Local Property Tax Revenue Up $631 Million. As Figure 4 shows, total property tax revenues in 2014–15 are $631 million higher than the revised 2013–14 estimates. The Governor estimates baseline property tax revenues will be $939 million higher than the revised 2013–14 level. This increase is partially offset by RDA–related revenues being a combined $308 million lower. The reductions in RDA–related revenues to schools and community colleges are primarily driven by former RDA obligations being higher than expected.
ADA Is Somewhat Lower Than in 2013–14. The Governor projects overall ADA will decline by 0.12 percent in 2014–15. This is the net effect of a projected decline in school district ADA (2 percent), partly offset by increases in charter school attendance (15 percent). Because charter schools represent a much smaller share of the student population (10 percent), overall attendance is still down. Because 2014–15 is a Test 1 year, the minimum guarantee is unaffected by the overall decrease in student attendance.
Effects of New Revenues on Minimum Guarantee Will Vary Based on Year in Which Revenues Materialize. The minimum guarantee for 2014–15 will be sensitive to changes in estimates of General Fund revenues. The exact effect on the guarantee will vary significantly depending on whether revenue estimates change for 2013–14, 2014–15, or both years. If, for example, revenues were unchanged in 2013–14 but $1 billion higher in 2014–15, virtually all of the new revenues would go to Proposition 98. This is because 2014–15 is a Test 1 year in which a large maintenance factor payment is required. Alternatively, if revenues were up $1 billion in both 2013–14 and 2014–15, roughly half of new revenues would go to Proposition 98 in 2013–14 and 40 percent of new revenues would go to Proposition 98 in 2014–15. As in the previous scenario, the additional revenues would increase the Test 1 level in 2014–15. The maintenance factor payment, however, would not increase in this situation. Though total General Fund revenues would increase, the year–to–year growth in General Fund revenues would remain essentially unchanged, thus requiring no additional maintenance factor payment. Because of such differing results, the net change in the minimum guarantee resulting from changes in General Fund revenues could vary significantly at the May Revision (and continue changing as the state updates its General Fund revenue estimates over subsequent months).
Changes in PCPI Could Have Counterintuitive Effects. The Governor’s budget projects the 2014–15 PCPI growth factor will be 0.24 percent. (The PCPI growth factor is calculated by measuring the growth in PCPI between the fourth quarter of 2012 and the fourth quarter of 2013.) As the PCPI factor in the Governor’s budget is only a projection that was developed during the fourth quarter of 2013, the actual data—to be released by the federal government in late March—is likely to differ somewhat. Because of the PCPI’s effect on the maintenance factor calculation, changes to the PCPI growth factor could have counterintuitive effects. The maintenance factor calculation is largely driven by the difference between growth in per capita General Fund revenues and growth in PCPI. A larger difference between these two factors corresponds to a larger maintenance factor payment. A decrease in PCPI growth would increase the difference between per capita General Fund revenue growth and PCPI, thus increasing the maintenance factor payment. Conversely, an increase in the PCPI growth factor would reduce the maintenance factor payment. We estimate that a 1 percent increase in the PCPI factor would decrease the minimum guarantee by roughly $500 million, with a corresponding increase if the PCPI factor were to decrease by 1 percent.
The Governor’s budget includes a total of $11.8 billion in Proposition 98 spending increases. From an accounting perspective, $2 billion is attributable to 2012–13, $1.7 billion is attributable to 2013–14, $7.6 billion is attributable to 2014–15, and $504 million is attributable to earlier years. Schools and community colleges, however, will receive all the funds in 2014–15. We describe the major spending changes below.
$2 Billion Deferral Paydown to Meet Revised 2012–13 Proposition 98 Obligation. The increase in the 2012–13 minimum guarantee combined with lower ADA costs that year creates a total “settle–up” obligation of $2 billion in 2012–13. The Governor proposes to retire this obligation by paying down additional deferrals—$1.8 billion for schools and $194 million for community colleges.
$1.7 Billion Deferral Paydown to Meet Revised 2013–14 Obligation. The increase in the 2013–14 minimum guarantee combined with lower ADA costs that year results in a total settle–up obligation of $1.7 billion in 2013–14. The Governor proposes to make $1.7 billion in deferral paydowns—$1.5 billion for schools and $163 million for community colleges—to meet this obligation. (We discuss deferrals in more detail in the “Wall of Debt Plan” section of this report.)
In 2014–15, $7.6 Billion in Spending Increases. Figure 6 provides a summary of the major 2014–15 spending changes. The largest spending increase is $4.5 billion for the LCFF. The Governor’s plan also includes $2.5 billion ($2.2 billion for schools and $236 million for community colleges) to pay down the remaining K–14 deferrals, $375 million to expand two community college categorical programs, $155 million to fund a 3 percent increase in enrollment growth at the community colleges, and $82 million to provide a 0.86 percent cost–of–living adjustment for select K–12 programs as well as community college apportionments. In addition, the budget plan provides $54 million in testing–related increases—$46 million to pay for the new assessments aligned to the Common Core State Standards (CCSS) and $7.6 million to develop a new English proficiency exam aligned to the CCSS. (The budget also includes a $101 million reduction for school and community college energy projects due to an updated estimate of associated Proposition 39 revenues.)
Figure 6
Proposition 98 Spending Changes
(In Millions)
|
2013–14 Revised Spending
|
$56,813
|
|
Crosscutting K–14 Adjustments
|
|
|
Remove prior–year deferral payments
|
–$1,955
|
|
Remove prior–year one–time funds
|
–468
|
|
Fund QEIA program outside of Proposition 98
|
–361
|
|
Adjust energy efficiency funds
|
–101
|
|
Make other adjustments
|
9
|
|
Subtotal
|
(–$2,876)
|
|
K–12 Education
|
|
|
Fund increase in school district LCFF
|
$4,472
|
|
Pay down remaining deferrals
|
2,238
|
|
Increase funding for pupil testing
|
46
|
|
Provide 0.86 percent COLA to categorical programs
|
33
|
|
Fund increase in COE LCFF
|
26
|
|
Fund new English language proficiency assessment
|
8
|
|
Reduce categorical funding for lower ADA
|
–18
|
|
Subtotal
|
($6,805)
|
|
California Community Colleges
|
|
|
Pay down remaining deferrals
|
$236
|
|
Augment Student Success and Support Program
|
200
|
|
Augment maintenance and instructional equipment (one–time)
|
175
|
|
Fund 3 percent enrollment growth
|
155
|
|
Provide 0.86 percent COLA to apportionments
|
48
|
|
Create new community college technical assistance teams
|
3
|
|
Subtotal
|
($817)
|
|
Total Changes
|
$4,746
|
|
2014–15 Proposed Spending
|
$61,559
|
Provides $504 Million in One–Time Funding for Statutory Obligations. The Governor’s budget also includes $504 million in one–time funds for QEIA ($410 million) and ERP ($94 million). We discuss these programs in more detail in the “Wall of Debt Plan” section of this report.
Per–Student Funding Increases Significantly. Overall, the Governor’s plan increases ongoing K–12 per–pupil funding from $7,936 in 2013–14 to $8,724 in 2014–15—an increase of $788 (10 percent). (These amounts exclude one–time funding, including funding provided to pay down deferrals.)
Overall Plan Reasonable
Prudent Mix of One–Time and Ongoing Spending. Of the $11.8 billion in spending increases proposed by the Governor, about $6.7 billion is used to pay off outstanding one–time obligations and $5.1 billion is used for ongoing increases. We believe this is a reasonable mix of one–time and ongoing spending. Notably, by retiring the $6.2 billion in deferrals, the plan eliminates the largest component of outstanding school and community college obligations. Moreover, his plan significantly increases ongoing programmatic support by providing additional funding for LCFF and community colleges.
One–Time Funding Provides Cushion in Responding to Lower Revenues. Given possible swings in the 2014–15 minimum guarantee, the one–time spending on deferral paydowns provides the state with a cushion if the minimum guarantee were to decrease midyear. If the guarantee were to decrease, the state could reduce the deferral paydowns midyear, thus achieving General Fund savings without requiring schools and community colleges to make programmatic reductions. A prudent mix of one–time and ongoing spending also helps the state minimize potential disruption to school funding in 2015–16 as a result of revenue volatility or an economic slowdown. Because the $2.5 billion dedicated to paying down deferrals in 2014–15 is a one–time payment, the state could reduce spending by a like amount in 2015–16 without requiring schools and community colleges to make programmatic reductions.
The largest component of the Governor’s budget plan is his proposal to retire all school and community college wall of debt obligations by the end of 2017–18. In this section, we discuss the Governor’s plan for retiring these obligations.
Background
State Has $11.5 Billion in Outstanding School and Community College Obligations. The state currently has a total of $11.5 billion in one–time outstanding school and community college obligations. Figure 7 describes each existing type of obligation and identifies the corresponding amount the state owes. The largest outstanding obligations involve payment deferrals and unpaid mandate claims.
Figure 7
State Has Several Outstanding One–Time School and Community College Obligations
(In Millions)
|
Obligation
|
Description
|
Amount Outstandinga
|
|
Payment deferrals
|
From 2008–09 through 2011–12, the state deferred certain school and community colleges payments from one fiscal year to the subsequent fiscal year to achieve state savings. State paid down $4.3 billion in deferrals in the 2013–14 budget plan.
|
$6,164
|
|
Mandates
|
State must reimburse school and community college districts for performing certain state–mandated activities. State deferred payments seven consecutive years (2003–04 through 2009–10). Since 2012–13, state has provided ongoing funding for mandates through the Mandates Block Grant.b
|
4,482
|
|
Emergency Repair Program
|
Chapter 899, Statutes of 2004 (SB 6, Alpert), requires the state to provide certain schools with a total of $800 million for emergency facility repairs.
|
462
|
|
Quality Education Investment Act
|
Chapter 751, Statutes of 2006 (SB 1133, Torlakson), sets forth a multiyear plan to provide an additional $2.7 billion to schools and community colleges. Annual payments of $450 million are to be provided until obligation has been retired.
|
410
|
|
Total
|
|
$11,518
|
State Has One–Time Proposition 98 Settle–Up Obligations. The state currently has settle–up obligations totaling $1.5 billion. A settle–up obligation is created when the minimum guarantee increases midyear and the state does not make an additional payment within that fiscal year to meet the higher guarantee. The bulk of the outstanding settle up is associated with the state’s 2009–10 Proposition 98 obligation. The state can designate settle–up payments be used for any educational purpose, including paying off other one–time obligations, such as deferrals and mandates. (Because settle up can be used to retire the obligations shown in Figure 7, it is not itemized separately. If the state were to pay these obligations using settle–up funds, no additional spending beyond the $11.5 billion would be required.)
Governor’s Proposals
Figure 8 displays the Governor’s proposed multiyear wall of debt payment plan.
Pays Down All Deferrals by End of 2014–15. As shown in Figure 9, the Governor proposes to pay down all $6.2 billion in outstanding school and community college deferrals by the end of 2014–15. As discussed earlier, the Governor designates Proposition 98 funding from 2012–13, 2013–14, and 2014–15 to pay down these deferrals. Under the Governor’s plan, all additional Proposition 98 spending proposed in 2012–13 and 2013–14 is used for deferral pay downs. About one–third of the new spending proposed for 2014–15 is for deferral pay downs.
Figure 8
Governor’s Multiyear Plan for Paying One–Time Education Obligations
(In Millions)
|
Obligation
|
Total Owed at End of 2013–14a
|
2014–15
|
2015–16
|
2016–17
|
2017–18
|
|
Deferrals
|
$6,164
|
$6,164b
|
—
|
—
|
—
|
|
Mandates
|
4,482
|
—
|
$1,245c
|
$1,600
|
$1,637
|
|
ERP
|
462
|
188
|
274c
|
—
|
—
|
|
QEIA
|
410
|
410d
|
—
|
—
|
—
|
|
Totals
|
$11,518
|
$6,762
|
$1,519
|
$1,600
|
$1,637
|
Figure 9
Governor Proposes to Pay Down All Outstanding K–14 Deferrals
(In Millions)
|
|
K–12
|
CCC
|
Totals
|
|
Pay Down Scored to:
|
|
|
|
2012–13
|
$1,813
|
$194
|
$2,007
|
|
2013–14
|
1,520
|
163
|
1,683
|
|
2014–15
|
2,238
|
236
|
2,474
|
|
Totals
|
$5,571
|
$592
|
$6,164
|
Makes Final $410 Million QEIA Payment in 2014–15. The Governor proposes to make a $410 million payment above the 2014–15 minimum guarantee (treated as a 2005–06 settle–up payment) to retire the state’s QEIA–related obligation. Although statute requires a $410 million payment to fully retire the state’s obligation, the estimated costs of the program in 2014–15 are $316 million. (Fewer schools are now participating in the program.) The Governor proposes to redirect the $94 million in freed–up funds to the ERP (as discussed further below).
Pays Off ERP Obligation in 2015–16. The Governor’s budget provides a total of $188 million for the ERP in 2014–15. Of that amount, $94 million is being redirected from freed–up QEIA funds (mentioned above) and $94 million is coming from unspent prior–year Proposition 98 funds. Under the Governor’s multiyear payment plan, the state would retire more of its settle–up obligation by paying off the remaining $274 million in outstanding ERP obligations in 2015–16.
Retires Mandate Backlog by 2017–18. The Governor does not propose any funding to reduce the mandate backlog in 2014–15. As Figure 8 shows, the Governor’s plan makes payments in 2015–16, 2016–17, and 2017–18 to pay off all unpaid mandate claims. In 2015–16, the $1.2 billion payment would be made using Proposition 98 settle–up funds, fully retiring the state’s settle–up obligation.
Assessment and Recommendations
Reasonable Payment Plan. The Governor’s plan is a reasonable multiyear approach that pays off all outstanding school and community college obligations. Such an approach would retire all outstanding obligations one year before the expiration of Proposition 30 revenues.
Consider the Functional Benefits of Payments. In developing a plan for paying off its outstanding obligations, the Legislature may want to consider how these payments will affect school and community college spending. Paying down deferrals will reduce the need for cash–flow borrowing but is unlikely to result in notable additional spending. In contrast, payments for mandates and ERP are one–time funds available for any purpose, such as deferred maintenance or implementation of the CCSS. (This is because school districts already have paid for the costs associated with the mandated activities and completed their ERP projects.)
Consider the Distributional Effects of Payments. The Legislature also may want to consider the different distributional effects these payments would have on school and community college districts throughout the state.
- Paying Down Deferrals. Though deferral paydowns would benefit most districts, those districts that rely more heavily on state funding (compared to local property tax funding) would benefit most from these payments.
- Mandates. Paying down the mandate backlog also would benefit most school and community college districts, but would disproportionately benefit districts that file more claims and claim much higher costs (in per–pupil terms) than other districts.
- QEIA. Payments for QEIA would benefit 365 schools in the bottom three deciles of the state’s accountability index that currently participate in the program.
- ERP. Funding for ERP would benefit schools in the bottom three deciles that previously had projects approved by the Office of Public School Construction. (The $462 million owed would provide funding to 694 schools on the approved unfunded list.)
Pay Off Obligations Without Increasing Proposition 98 Commitments. As the Governor proposes in 2015–16, we recommend the state use outstanding settle up to pay off some of its existing school and community college obligations. In future years, if no outstanding settle–up obligations exist, we recommend the Legislature pay off the remaining obligations while still funding at the minimum guarantee. Such an approach would provide the state with more budgetary flexibility in responding to revenue volatility or an economic slowdown. Given Proposition 30 revenues begin to phase out in 2017–18 and fully expire by 2019–20, the minimum guarantee could decrease or grow more slowly in these years. If the minimum guarantee were to decrease in 2017–18 or 2018–19, one–time spending in the prior year to pay the mandate backlog would provide the state with a cushion to reduce spending without affecting ongoing programmatic funding levels.
Governor’s Proposals
Provides $4.5 Billion for District LCFF Increases. The Governor’s largest proposed programmatic augmentation in 2014–15 is for the LCFF. In 2013–14, the state provided a $2.1 billion increase for the first year of implementing the LCFF, dedicating $41 billion to the formula (73 percent of the full implementation cost). The Governor’s proposal dedicates an additional $4.5 billion to the LCFF in 2014–15, an 11 percent increase from the 2013–14 funding levels. The Governor estimates this additional appropriation would close approximately 28 percent of the gap between the 2013–14 funding levels and full implementation target funding rates. We estimate the 2014–15 LCFF funding level would be approximately 80 percent of the full implementation cost.
Adds Two Programs to LCFF. The majority of state categorical programs were consolidated into the LCFF in 2013–14. To further simplify the school finance system, the Governor proposes to add two remaining categorical programs to the LCFF—SSP ($4.8 million) and Agricultural Education Grants ($4.1 million). Under the Governor’s proposal, school districts receiving funding for these two programs in 2013–14 would have those funds count towards their LCFF targets beginning in 2014–15. (No change would be made to the LCFF target rates.) The currently required categorical activities would be left to districts’ discretion.
Fully Funds COE LCFF. The Governor’s plan also provides COEs with $1.1 billion in LCFF funding, an increase of $26 million from the 2013–14 level. The administration projects that this increase will be sufficient to provide COEs their full LCFF target rates in the budget year. Of the amount provided, $450 million is generated by the county operations part of the formula, $400 million is generated by the alternative education part of the formula, $178 million is from a “hold harmless” provision that provides some COEs with funding in excess of their LCFF targets, and $33 million is for the Home–to–School Transportation add–on. With the exception of transportation funding and temporary spending requirements related to Regional Occupation Centers and Programs (ROCP), COEs have the flexibility to spend LCFF monies for any educational purpose.
Proposes New Automated Budget Formula for LCFF Funding. The Governor proposes statutory language requiring that a specified percentage of annual Proposition 98 funding automatically be dedicated to the total LCFF each year (school district and COE combined). In 2014–15, 76 percent of Proposition 98 funding would be required to go towards LCFF. Beginning in 2015–16, until the LCFF target rates are fully funded, 79 percent of Proposition 98 funding would go towards LCFF. Under current law, prior–year LCFF appropriations are continuously appropriated. This means these appropriations are automatically adjusted throughout the school year based on changes in ADA and automatically made to school districts, even without an approved state budget. In 2013–14, increases in LCFF funding were made at the discretion of the Legislature and included in the budget plan. In contrast, under the Governor’s proposal, the share of Proposition 98 dedicated to LCFF each year would be predetermined by statute.
Assessment and Recommendations
LCFF Proposals Reasonable. We believe the Governor’s proposal to dedicate school funding increases primarily to the LCFF is a reasonable approach that is consistent with the intent of the Legislature in restructuring the school finance system last year.
Reject Proposal to Automate LCFF Funding. We have concerns, however, with the Governor’s proposal to set in statute the specific share of Proposition 98 funding that would be dedicated to LCFF each year moving forward. Although prioritizing funding for LCFF is consistent with the Legislature’s intent in adopting the LCFF and eliminating most categorical programs, we are concerned that the proposal creates an additional, unnecessary formula that would further complicate school funding. Such an approach would remove the Legislature’s discretion to determine the appropriate amount of funding to allocate for LCFF in any particular year. Given the considerable loss of associated legislative authority and discretion, we recommend the Legislature reject this proposal.
Recommend Approving Shift of Two Programs into LCFF. As we discuss in more detail in the next section of this report, we recommend approving the Governor’s proposal to shift SSP and Agricultural Education Grants into the LCFF.
In this section, we focus on high school CTE programs. We start by providing an overview of the state’s current CTE programs, with a particular focus on two programs—SSP and the Agricultural Education Grants—both of which would be directly affected by the Governor’s 2014–15 CTE budget proposals. We then describe the Governor’s CTE proposals, assess those proposals, and offer associated recommendations for the Legislature’s consideration.
Overview of High School CTE
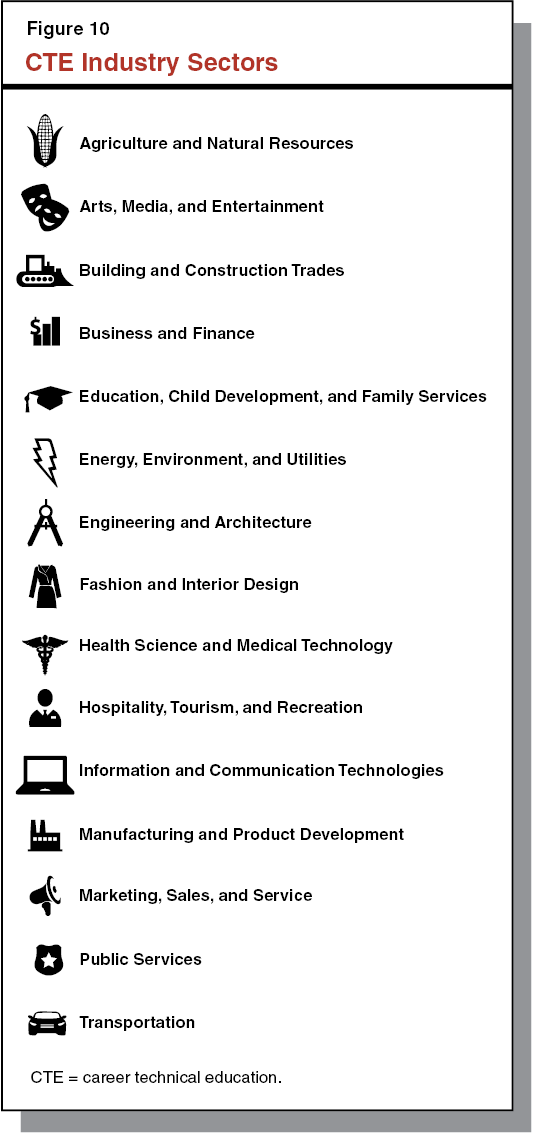
High School CTE Consists of Instruction in a Number of Fields. The California Department of Education (CDE) defines CTE as coursework in one of 15 industry areas. As Figure 10 shows, these industries are diverse and broad in scope—including building and construction trades, fashion design, and health occupations.
Lines Increasingly Blurred Between CTE and “Core” Instruction. High school CTE traditionally has been thought of as an alternative to a college preparatory pathway. In recent years, however, the state has increasingly focused on the policy goal of ensuring that students have both college and career options upon graduating from high school. This has increased the state’s emphasis on promoting career pathways, which are sequences of courses that align with postsecondary education and industry needs. In addition, there is a growing literature on the benefits of contextual (applied) learning, in which students are taught math, English, and other subjects in a way that incorporates students’ interests in an occupational field. As a result, many CTE courses have become integrated into high school students’ regular instructional curriculum—thereby blurring the traditional lines between CTE and core instruction. For example, a college–bound student may take high school CTE courses such as engineering and graphic arts to satisfy course requirements for admission to four–year university systems, while a student interested in entering the workforce directly after graduation may learn math and science as part of a health occupations course.
Various High School CTE Programs Operate in California. As shown in Figure 11, high schools receive funding for CTE in various forms, including categorical programs, one–time competitive grants, foundation funding, and federal funding. In addition, many high schools fund CTE instruction using their LCFF (general purpose) monies.
Figure 11
California’s High School Career Technical Education (CTE) Programs
2013–14, Unless Otherwise Specified
|
State–Funded Programs
|
Description
|
Funding (In Millions)
|
|
Regional Occupational Centers and Programs (ROCP)
|
Regionally focused CTE offered during the school day, after school, and in the evening at high schools and regional centers. Primarily serves high school students ages 16 through 18.
|
$384.0a
|
|
Career Pathways Trust
|
One–time competitive grants intended to improve linkages between CTE programs at schools, community colleges, and local businesses. Authorizes several types of activities, such as creating new CTE programs and curriculum. These funds are available for expenditure through 2015–16.
|
250.0
|
|
CTE Pathways Initiative
|
Funding intended to improve linkages between CTE programs at schools, community colleges, universities, and local businesses. This program sunsets at the end of 2014–15. Of these funds, $8.2 million supports California Partnership Academies and $5.2 million supports Linked Learning (both reflected below).
|
48.0
|
|
California Partnership Academies
|
Small learning cohorts that integrate a career theme with academic education in grades 10 through 12. Considered a form of Linked Learning (see below).
|
29.6
|
|
Linked Learning
|
One–time funding to support small, career–themed learning cohorts within comprehensive high schools that tie academic coursework to technical content and work–based learning.
|
5.2b
|
|
Specialized Secondary Programs
|
Competitive grants that provide seed money to pilot programs that prepare students for college and careers in specialized fields ($3.4 million). Funding also supports two high schools specializing in math, science, and the arts ($1.5 million).
|
4.9
|
|
Agricultural CTE Incentive Program
|
Ongoing funding that can be used for the purchase of nonsalary items for agricultural education. Funds are commonly used to purchase equipment and pay for student field trips. Districts are required to provide matching funds.
|
4.1
|
|
Federally Funded Programs
|
|
|
Carl D. Perkins
|
Ongoing funding that can be used for a number of CTE purposes, including curriculum and professional development and the acquisition of equipment and supplies for the classroom. Of these monies, 85 percent directly funds local CTE programs and the other 15 percent supports statewide administration and leadership activities.
|
$56.3
|
|
Youth Career Connect Grant
|
One–time competitive grants available for the 2014–15 school year that are intended to improve career options for high school students by facilitating partnerships with businesses, high schools, and higher education. Grant recipients are required to provide a 25 percent match.
|
12.0c
|
Largest High School CTE Categorical Program Folded Into New K–12 Funding Formula. The 2013–14 budget package eliminated approximately three–quarters of categorical programs and folded their associated funding into LCFF. The state’s largest CTE categorical program, ROCP, was included in this consolidation. However, to ensure ROCP continued to operate during the next couple of years, the budget package requires providers (school districts and COEs) to maintain at least their 2012–13 level of state spending on ROCP in 2013–14 and 2014–15. Funds used to satisfy this maintenance–of–effort (MOE) requirement count toward school districts’ LCFF allocations. At the end of 2014–15, school districts and COEs will have discretion to spend former ROCP funds as they choose.
Several Smaller High School CTE Programs Left Out of LCFF. The 2013–14 budget package took a different approach for three smaller CTE programs. Specifically, SSP, Agricultural Education Grants, and California Partnership Academies (CPA) were retained as stand–alone categorical programs. In signing the 2013–14 Budget Act, however, the Governor expressed his desire to fold SSP and Agricultural Education Grants into LCFF in 2014–15.
State in Process of Refining CTE Accountability Measures. For the past fifteen years, the state’s accountability system for public schools has been based almost entirely on student test scores. Based on these test results, schools have received an annual Academic Performance Index (API) score and ranking. Recently, the state has been moving toward a more comprehensive accountability system that includes multiple measures of student performance. Specifically, Chapter 577, Statutes of 2012 (SB 1458, Steinberg), requires the State Superintendent of Public Instruction (SPI) to develop by 2015–16 a revised API for high schools that takes into account graduation rates and high school students’ readiness for college and career. In October 2013, the SPI provided to the Legislature a statutorily required status report that laid out a number of options under consideration for broadening the API, including assigning points to high schools based on the extent to which their students are deemed college and career ready. Currently, the SPI is gathering feedback on the possible components of the new API.
Specialized Secondary Programs
Consists of Two Distinct Parts. The SSP was created in 1984 with the stated goal of encouraging high schools to create curriculum and pilot programs in specialized fields, such as technology and the performing arts. In 1991–92, SSP’s mission was expanded to include base funding for two high schools that are affiliated with the California State University (CSU) system. Of the $4.9 million provided for SSP in the current year, $3.4 million is awarded as “seed” funding for the development of specialized instruction and $1.5 million supports the state’s two SSP–funded high schools.
Competitive Grants Totaling $3.4 Million Awarded in 2013–14. In the current year, CDE, which administers SSP’s competitive grant program, has awarded 67 SSP grants totaling $3.4 million. The SSP funding is distributed in four–year grant cycles. School districts initially apply for a one–year planning grant. Applicants then reapply for three–year implementation grants. Funds are permitted to cover various costs, including equipment and supplies, instructor and staff compensation, and teacher release time to develop curriculum. After the grant cycle is complete, recipients are ineligible to reapply for SSP grants.
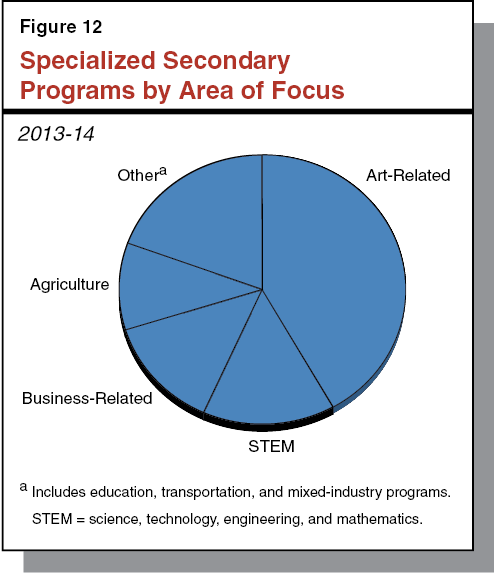
Arts, Science, and Technology Are Common Themes for Competitive Grant Program. The SSP competitive grant program funds various types of instruction. As Figure 12 shows, of the 67 grants awarded in 2013–14, 42 percent are arts programs and 15 percent are science, technology, engineering, or mathematics (STEM) programs. Other industry areas include business and agriculture.
Total of $1.5 Million in Ongoing SSP Funding Provided to Two High Schools on Top of LCFF. In addition to competitive grants, SSP provides a total of $1.5 million in annual funding for two high schools operating in conjunction with the CSU system. This amount is split evenly between an arts–themed high school affiliated with CSU Los Angeles and a math– and science–themed high school affiliated with CSU Dominguez Hills. (Unlike virtually all other public schools, students compete for admission to these two schools.) The SSP funds provided to these schools is on top of LCFF monies they receive and are used primarily to pay for teachers. (By statute, these teachers do not need to be credentialed.)
Agricultural Education Grants
Agricultural Education Grants Totaling $4.1 Million Awarded in 2013–14. The stated purpose of Agricultural Education Grants is to create an incentive for high schools to offer state–approved agricultural programs. In the current year, CDE has awarded 303 grants to 222 school districts totaling $4.1 million. Funds typically are used by grant recipients for instructional equipment and supplies. Other allowable uses of the funds include paying for field trips and student conferences.
Grant Funds Are Awarded to All Qualified Applicants. The CDE administers the grants by splitting available funds based on the number of qualified applicants in a given year. To qualify, grantees must provide matching funds. In addition, the high school program must offer three instructional components: classroom instruction, a supervised agricultural experience program (project–based learning), and student leadership development opportunities. To receive a grant renewal, high schools must agree to be evaluated annually on 12 program quality indicators. (These indicators include curriculum and instruction requirements, leadership development, industry involvement, career guidance, and accountability.) As part of this process, five regional supervisors conduct on–site reviews and provide ongoing technical assistance to grantees.
Adds SSP and Agricultural Education Grant to LCFF. The Governor proposes to add both SSP and Agricultural Education Grants to LCFF. Under the Governor’s proposal, school districts receiving funding for these two programs in 2013–14 would have those funds count toward their LCFF targets beginning in 2014–15. (No change would be made to the LCFF target rates.) The currently required categorical activities would be left to districts’ discretion.
Makes No Changes to ROCP and CPA. The Governor’s budget does not make any proposal related to the existing MOE spending requirement for ROCP. Additionally, the Governor’s budget does not make any proposal related to CPA.
Increases High School LCFF Rate by 11 Percent. While not a specific proposal related to CTE, the Governor’s budget proposes additional LCFF monies for schools in 2014–15, which high schools also can use for CTE instruction. The average high school base rate would increase from $6,306 in 2013–14 to $6,987 in 2014–15, an increase of $681 (11 percent). (When accounting for the additional funding provided for EL/LI students, the high school rate is notably higher—$8,384 in 2014–15.) As indicated earlier, many districts likely are devoting some portion of this base funding for CTE activities. Given the large proposed funding increase in the high school base rates, districts would have considerably more to spend on these types of activities in 2014–15.
As detailed below, we recommend the Legislature adopt the Governor’s proposals to fold SSP and Agricultural Education Grants into LCFF and also take steps to ensure that high schools are held accountable for the quality of their CTE programs.
Categorical Programs Have Notable Drawbacks. While categorical programs can be helpful in certain instances, we generally believe they should be used sparingly. This is because categorical programs have several short–comings, including:
- Inflexibility. Categorical programs typically are highly prescriptive in terms of how funds are spent. This is as true of CTE categorical programs as other K–12 categorical programs. Yet students’ problems and educators’ preferred solutions can vary across the state. By requiring funds to be spent in a specific way for a specific purpose, categorical programs can limit district and school flexibility to develop local strategies that address local needs in the most effective and efficient way.
- High Administrative Costs. Categorical funds generally are expensive for districts and CDE to administer. Districts must apply for, track, and report the appropriate use of categorical funds and CDE must oversee districts’ compliance with numerous statutory and regulatory requirements.
- Focus on Inputs, Not Results. Because of the focus on how categorical funds are spent, the state and districts often can lose sight of the outcomes the programs are intended to achieve (such as successful transitions to college or the workforce).
Adoption of LCFF Reflects Commitment to a More Streamlined and Rational Funding System. It was largely in recognition of the need to overhaul the state’s overly burdensome and ineffective K–12 categorical system that the Legislature and Governor enacted LCFF. The LCFF is based on two main underlying principles, namely that: (1) unless the state has a compelling reason to the contrary, districts should be permitted to decide how to allocate their funding to address their student needs; and (2) the overall funding level provided by the state should reflect the higher costs of educating specific groups of students (such as EL students), who may need additional services to be successful. In response to this latter goal, the LCFF generally is designed to provide similar–sized districts serving similar students with a similar amount of funding.
Proposal for SSP and Agricultural Education Grants Is Consistent With LCFF Tenants. The Governor’s proposal to eliminate SSP and Agricultural Education Grants as stand–alone categorical programs is consistent with the purpose of LCFF, as discussed below.
- SSP Competitive Grants. The purpose of SSP competitive grants is to encourage program innovation and development of new curriculum in high schools. Having a restricted program implies that innovation and development of new curriculum is a supplemental activity that requires special incentives and a separate funding stream. Yet, course and program development is a core function for educators, and schools already have wide discretion to use LCFF for such core activities.
- SSP–Funded High Schools. In creating uniform per–pupil LCFF rates with adjustments for particular student groups, the Legislature and Governor sought to provide a more rational finance model that significantly reduced historical funding inequities across schools. The two SSP–funded high schools, however, work at direct cross–purposes to the LCFF. We estimate that students at these two schools receive roughly $1,200 more in per–student funding than students at other high schools with similar students.
- Agricultural Education Grants. Educators routinely make decisions about the type of instructional equipment and supplies to purchase and ways to enhance students’ learning experience through field trips, conferences, and other activities. These costs typically are covered with LCFF or certain non–state sources (such as federal Perkins funding). For example, according to the most recent data from CDE, in 2011–12 districts spent more than $300 million in state general–purpose monies on school equipment, materials, and supplies. These funds are used to cover a wide range of instructional costs—from supplies in chemistry labs to materials for fine arts classes. Given the substantial unrestricted resources available and currently being spent for these purposes, no clear rationale exists for providing a small separate appropriation for covering similar costs in one specific discipline (agricultural education).
Recommend Legislature Approve the Governor’s Proposals. Given these findings, we recommend the Legislature approve the Governor’s budget proposals to consolidate SSP and Agricultural Education Grants into LCFF. Under his proposal, districts currently receiving these funds would continue to receive them in 2014–15 and subsequent years (though those funds would now count toward meeting their LCFF funding targets). Districts would have the option to use these funds exactly as they do now (though without the administrative burden associated with meeting current CDE compliance requirements). Alternatively, districts would have flexibility to use these funds in a different way to meet students’ needs. (Eliminating these categorical programs would reduce administrative workload within CDE’s Agricultural and Home Economics Office. Currently, this office has 15 positions. The CDE indicates about one full–time position is dedicated to administering Agricultural Education Grants.)
Recommend Overall Approach to CTE That Focuses on Student Outcomes. The Legislature does not need to make any decisions now about two larger CTE programs—ROCPs and CPAs—as certain related statutory provisions do not trigger off until 2015–16. Looking ahead, however, we recommend the Legislature adopt an overall approach for high schools and CTE that relies more heavily on student outcomes and less heavily on the specific educational strategies educators use to achieve those outcomes. Under this approach, the Legislature would eliminate programmatic requirements for all CTE programs in favor of evaluating and holding districts and high schools accountable for student outcomes. In evaluating success, the Legislature could use various outcome measures, such as the number and share of students who: (1) meet both high school graduation and university admissions course requirements, (2) complete a sequence of CTE courses, (3) earn community college credit in a CTE program, (4) obtain an industry certification, and (5) secure an apprenticeship. By holding districts more accountable for student outcomes, the state could promote the positive benefits of CTE while providing more local flexibility to develop effective programs.
Recommend Legislature Request SPI Provide Update on Development of Revised API. The planned addition of college and career readiness measures to the API provides an opportunity for the Legislature to obtain a more comprehensive look at high schools’ performance. To ensure the Legislature is well informed about likely changes to the API, we recommend the Legislature request the SPI to present a status update at a spring budget hearing on the development of the revised API.
In this section, we provide background on the state’s academic standards and assessments, describe the Governor’s proposals to increase funding for California’s new student assessments, assess those proposals, and make several related recommendations.
In the late 1990s, California adopted academic standards specifying the content that students were expected to learn while in school. Shortly after developing these standards, the state adopted a series of assessments aligned to those standards that measured the extent to which students had mastered the required content. A few years ago, California began the process of replacing these original standards with newly developed CCSS. These new standards have triggered development of a new round of assessments. Below we describe the state’s original and new systems of standards and assessments.
California’s Original Academic Standards and Assessments
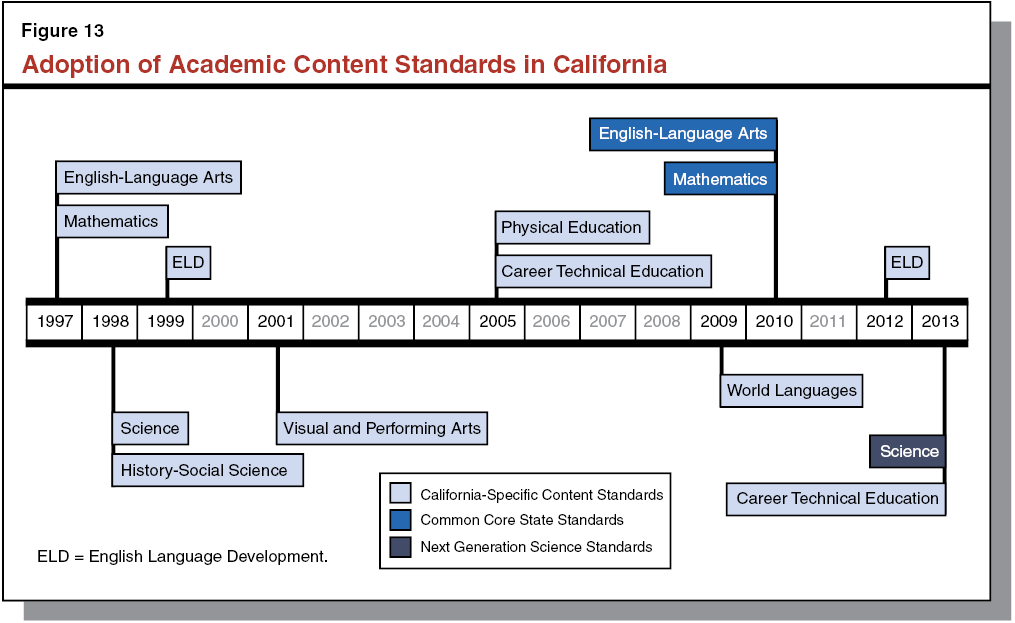
California Has Had Academic Standards for More Than 15 Years. As Figure 13 shows, California first adopted academic content standards for its core content areas—ELA, math, science, and history–social science—in 1997 and 1998. Shortly thereafter, the state developed English language development (ELD) standards for ELs as well as visual and performing arts standards. Several years later, the state adopted standards for physical education, CTE, and world languages.
Student Assessments Aligned to Standards in Core Subject Areas. To determine whether students were successfully learning the standards in the core content areas, the state developed summative assessments that students took each spring. (A summative assessment is intended to measure student mastery of content taught throughout the school year.) Collectively these assessments were known as the Standardized Testing and Reporting (STAR) program. Most students took the California Standards Tests (CSTs)—the main component of the STAR program. As Figure 14 shows, the state administered grade–level CSTs in ELA for grades 2 through 11; in math for grades 3 through 7; in science for grades 5, 8, and 10; and in history–social science for grades 8 and 11. In addition to the specific grade–level exams, students took a number of course–specific CSTs in grades 8 through 12.
Figure 14
California Standards Tests (CST)
|
Standard
|
Grade–Level Exams
|
End–of–Course Examsa
|
|
English–Language Arts
|
2 through 11b
|
None.
|
|
Mathematics
|
2 through 7
|
Algebra; Geometry; Algebra II; Integrated Mathematics 1, 2, and 3; General Mathematics; High School Summative Mathematics.
|
|
Science
|
5, 8, 10
|
Biology; Chemistry; Earth Science; Physics; Integrated/Coordinated Science 1, 2, 3, and 4.
|
|
History–Social Science
|
8, 11
|
World History.
|
Two Alternative Assessments for Students With Disabilities. Under the STAR program, some students with disabilities were required to take one of two other assessments—the California Modified Assessment (CMA) or the California Alternate Performance Assessment (CAPA). The CMA covered the same grade–level content standards as the CSTs, but was designed for students whose disabilities precluded them from achieving proficiency on the CSTs. The CAPA was designed for students with severe cognitive disabilities and covered only portions of content standards.
State Has Assessment to Determine English Proficiency. Another component of the state’s assessment system is the California English Language Development Test (CELDT). The CELDT is aligned to the state’s 1999 ELD standards. (As we discuss later, the state has yet to develop a new assessment aligned with the 2012 ELD standards.) The CELDT is used to (1) determine if an incoming student should be classified as an EL and (2) measure an EL’s proficiency in subsequent years. (School districts administer the CELDT to any incoming student whose parent or guardian reports on the home language survey that a language other than English is the student’s initial language learned or the primary language used at home.) Decisions regarding reclassifying students are made at the local level based on CELDT results, performance on other state assessments, teacher input, and local criteria.
Standards–Based Tests in Spanish (STS) for Some ELs and Dual Immersion Students. The STS are assessments in Spanish aligned to California’s 1997 ELA and math standards. The state required students that had been receiving instruction in Spanish or had been enrolled in school in the United States for less than one year to take the STS. Students required to take the STS also were required to take the ELA and math assessments in English (either the CST or CMA). Students who are not ELs but are currently enrolled in a dual immersion program—receiving instruction in both Spanish and English—also could take the STS.
Certain Assessments Required by Federal Law. As set forth in the No Child Left Behind Act (NCLB) of 2001, the federal government requires states to assess students in ELA and math in grades 3 through 8 and at least once from grades 10 through 12. The NCLB also requires states to assess students in science at least once during: (1) grades 3 through 5, (2) grades 6 through 9, and (3) grades 10 through 12. States also are required to annually assess the English proficiency of ELs. California’s STAR program exceeded these requirements.
Common Core Standards and Assessments in ELA and Math
Common Core Standards in ELA and Math Adopted by 45 States. In 2009, the National Governor’s Association and Council of Chief State School Officers, in consultation with education experts, developed a set of common standards in ELA and math for grades K–12. (California’s Governor and Superintendent of Public Instruction were a part of this group.) The new standards, known as the CCSS, were intended to be better at preparing all students for college and career. The finalized standards were released in June 2010.
California Created Commission to Review CCSS. Among other things, Chapter 2, Statutes of 2010, of the Fifth Extraordinary Session (SBX5 1, Steinberg), created an Academic Content Standards Commission to review the CCSS and determine whether the state should adopt these new standards. Upon recommendation of the commission, the State Board of Education (SBE) ultimately adopted the CCSS, with the addition of a few California–specific standards, in August 2010. To date, the CCSS have been adopted by 45 states and the District of Columbia. (Four states—Alaska, Nebraska, Texas, and Virginia—did not adopt either the ELA or math standards. Minnesota adopted the ELA standards only.)
California Part of Consortium for Developing New Assessments. In September 2010, as part of its Race to the Top Assessment Program, the federal government awarded $330 million to two consortia to develop assessments aligned to the CCSS. California and 22 other states are members of the Smarter Balanced Assessment Consortium (SBAC), which received $160 million. (The other consortium, Partnership for Assessment of Readiness for College and Careers, received $170 million.) The federal funding is being used to develop the new SBAC assessments and conduct field tests during spring 2014 using a sample of students from member states. These field tests will be used to ensure the quality of assessment questions, establish proficiency levels, and ensure technological systems are ready for administration of the assessments. The official SBAC assessments will be administered by member states in spring 2015. (Unlike the CSTs, the SBAC assessments do not have a second grade exam. The SBAC assessments also lack end–of–course assessments in various mathematical subjects.)
Ongoing Responsibilities of SBAC and Member States. Moving forward, the SBAC is responsible on an ongoing basis for developing additional test items, producing common materials such as manuals, and maintaining a digital library of instructional tools for SBAC member states. As the federal Race to the Top funding expires in September 2014, these activities will be funded by fees charged to the SBAC’s member states. Individual states will be directly responsible for funding the administration, scoring, and reporting of the assessments.
New Assessments Will Require Devices and Internet Connections. The assessments developed by SBAC are intended to be taken online using a desktop computer, laptop computer, or tablet. Given the technology required to administer these exams, school districts must have the technological capacity to administer the assessments to all students within the required testing window. To help ease the transition to computer–based exams, SBAC will provide a pencil–and–paper option in the first three years the assessments are administered. In the 2013–14 budget, the state provided $1.25 billion in one–time funding for implementation of the CCSS. These funds can be used for technology, professional development, or instructional materials. Initial surveys show that virtually all school districts plan on using some portion of these funds to purchase additional technology.
Assessments Will Use Computer–Adaptive Technology and Performance Tasks. One part of the SBAC assessments will be computer adaptive, such that the difficulty of the next test item is based on whether the student answered the previous item correctly. Because computer–adaptive exams essentially provide a custom set of items for each student, fewer items are required to determine a student’s skill level. In addition to computer–adaptive test items, the SBAC assessments will include performance tasks for students to complete, which will require students to review source materials and respond in writing to several questions. The SBAC test blueprints, for example, show that the ELA performance tasks for grades 3 through 5 will require students to review source materials, answer three short–response questions, and write one long essay. Because students are expected to use evidence to integrate knowledge and skills across multiple content standards, the SBAC assessments are expected to measure deeper understanding of course material. (By contrast, virtually all of the items on the state’s CST exams were noncomputer–adaptive, multiple–choice questions.) As we discuss later, because performance tasks cannot be graded by a computer, the new SBAC exams will be more costly to grade than the CSTs.
In 2013–14, SBAC Field Test to Replace ELA and Math CSTs and CMA. To begin transitioning to the CCSS, Chapter 489, Statutes of 2013 (AB 484, Bonilla), eliminates all ELA and math CSTs and CMAs beginning in 2013–14. (The state retained the CAPA.) For 2013–14, Chapter 489 requires school districts to participate in the SBAC field test and redirects funding from the CSTs and CMA to cover the associated costs. Five percent of California students will take a sample of questions and complete one performance task in either ELA or math. The remaining 95 percent of students will take a sample of both ELA and math questions and will complete a performance task in one subject. (No paper and pencil version of the field test will be available.) All students will take the full–length SBAC assessments in both subjects in 2014–15. (For the next two years, CDE must provide school districts with access to test forms for assessments that are no longer required by law. The cost of administering these exams must be paid by school districts. Chapter 489 also makes the STS optional, but provides state funding to administer the exam for ELs who receive instruction in Spanish or have been in the U.S. less than one year.)
School Accountability Systems Temporarily Suspended During Transition. Because the field test is intended to determine the quality of the assessments and make subsequent refinements to them, none of the results will be reported. As a result, California schools will have virtually no ELA or math scores available for state and federal accountability purposes. The state is currently seeking a waiver from the federal accountability requirements. The U.S. Secretary of Education has expressed willingness to grant waivers to schools participating in the consortium field tests. In other states, however, only a small portion of schools are participating in the field tests. (The box below discusses associated accountability issues in more detail.)
State and Federal Accountability Systems in Flux
Both the state and federal accountability systems primarily rely on student assessment data to evaluate the performance of schools and districts. Given recent changes in standards and assessments, these accountability systems will undergo significant changes over the next several years.
State Academic Performance Index (API) Relies Exclusively on Test Scores. The state’s API measures school performance using data from the California Standards Tests (CSTs), California Modified Assessment (CMA), California Alternate Performance Assessment (CAPA), and California High School Exit Exam (CAHSEE). For each school, achievement on student assessments is combined into an API score that ranges from 200 to 1,000. The state has set a school API performance target of 800, which falls above the performance level that represents a “basic” mastery of grade–level skills (700) and below the performance level that represents academic “proficiency” (875). Schools that have yet to reach the API performance target of 800 are expected to meet an API growth target. A school’s API growth target is equal to 5 percent of the distance between a school’s prior–year API and 800, or a gain of 5 points, whichever is greater.
Each significant student subgroup at a school also is expected to meet an API growth target (the distance between the subgroup’s prior–year API and 800, or a gain of 5 points, whichever is greater). Subgroups exist for African American, American Indian/Alaska Native, Asian, Filipino, Latino, Pacific Islander, White (not of Hispanic origin), economically disadvantaged, English learner, special education, and foster youth students. With the exception of foster youth, a subgroup is considered significant if it consists of 30 or more students. Foster youth are considered a significant subgroup if they consist of more than 15 students.
API May Not Be Available in 2013–14 and 2014–15. Current law gives the Superintendent of Public Instruction discretion not to calculate an API score in 2013–14 and 2014–15 if the transition to the new assessment system compromises the API results across schools and districts. Because most assessments previously used in calculating the API will not be administered in 2013–14, little data will be available to calculate an API. (Only results from the CAPA; the CAHSEE; and science tests in grades 5, 8, and 10 will be available.) In 2014–15, results from the new English–language arts (ELA) and math assessments will be available, but if no API is calculated in 2013–14, developing API growth targets for 2014–15 still may not be possible. (As we discussed in the “Career Technical Education” section of this report, the state also will make changes to the API for high schools beginning in 2016–17.)
Federal Adequate Yearly Progress Measure Also Relies Mostly on Test Scores. The federal accountability system, as set forth in the No Child Left Behind Act (NCLB) of 2001, measures whether schools and districts have made Adequate Yearly Progress (AYP). In order to annually meet AYP, schools and districts must demonstrate success based on the following four indicators: (1) the percentage of students that score at proficient or above on assessments in ELA and math (CSTs, CMA, and CAPA); (2) student participation in state assessments; (3) graduation rates; and (4) API scores. Success on these indicators applies to schools and districts as well as to each numerically significant subgroup within a school or district. (All state subgroups, with the exception of foster youth, also are federal subgroups.) Schools and districts that do not make their AYP targets for two consecutive years enter federal Program Improvement, which requires them to implement various turnaround strategies.
Virtually No Data to Measure Proficiency in 2013–14. Because most California students will be participating in field tests of the new ELA and math assessments in spring 2014, virtually no 2013–14 student data will be available for determining whether California schools and districts have met the AYP target. (Only students taking the CAPA will have eligible ELA and math scores.) Absent a waiver, California schools and districts will be considered to have failed to meet the AYP target.
Next Generation Science Standards
State Recently Adopted New Science Standards. Given the CCSS created common standards only in ELA and math, a group of 26 states and various national science organizations—including the National Research Council, National Science Teachers Association, and American Association for the Advancement of Science—convened a group in 2011 to develop new K–12 science standards. (California was a lead state partner in the development of these new standards.) In March 2013, the Next Generation Science Standards (NGSS) were finalized and released to the public. Chapter 624, Statutes of 2011 (SB 300, Hancock), required the SPI to convene a group of science experts to adopt new science standards, using the NGSS as the basis for discussions. Upon recommendation from the group of science experts, the SBE adopted the NGSS in September 2013.
Development of New NGSS–Aligned Assessments Not Yet Underway. Unlike the CCSS, no consortia have been established to develop assessments of the NGSS. The SPI is required to consult with stakeholders and make recommendations to the SBE regarding the development of a new assessment aligned to the NGSS. The recommendations must include cost estimates and a plan of implementation to replace the current science STAR exams with NGSS–aligned assessments. Until the NGSS–aligned assessments are ready, the state will continue to administer the CST, CMA, and CAPA science exams in grades 5, 8, and 10 (as required by federal law). Chapter 489 eliminates all end–of–course science assessments in specific subject areas beginning in 2013–14.
Other Changes to Standards and Assessments
History–Social Science at Crossroads. Of the four core subjects, history–social science is the only area without new standards or assessments. While California’s history–social science standards remain in place, Chapter 489 eliminated California’s history–social science CST exams beginning in 2013–14.
New ELD Standards Adopted, New Assessments to Be Developed. Chapter 605, Statutes of 2011 (AB 124, Fuentes), required the state to update its ELD standards to align with the CCSS. The SBE approved the new CCSS–aligned ELD standards in November 2012. The state now must develop an assessment based on the new standards to replace the CELDT. The CDE currently plans to develop a short initial screener to use for placing incoming students and a longer summative assessment to determine proficiency at the end of the year.
New Primary Language Exams to Be Developed. Among its other provisions, Chapter 489 also requires the SPI to develop new assessments in languages other than English that are aligned with the ELA CCSS for use no later than 2016–17. (These new assessments would replace the STS, but presumably also could be developed for languages other than Spanish.) The SPI must consult with stakeholders to determine the purpose and content of such exams, as well as how the exam would be included in the state’s accountability system. The SPI then must make recommendations and provide a cost estimate to the SBE no sooner than one year after the new SBAC assessments in ELA and math are administered.
SPI to Submit Plan for Future of Other Exams in 2016. By March 1, 2016, the SPI must have consulted with various groups and submitted recommendations to the SBE regarding the inclusion of other assessments into the state’s assessment system. The SPI is to consider whether the state should add assessments in social science, visual and performing arts, technology, or any other subject matter. The SPI also may consider whether additional assessments should be developed to supplement existing exams in ELA, math, and science. These recommendations must include suggestions regarding grade level, content, and assessment type, as well as include a cost estimate and timeline for test development.
Increases Total Assessment Funding by $52 Million in 2014–15. As shown in Figure 15, the Governor’s budget provides $149 million for student assessments in 2014–15, a $52 million increase from the 2013–14 spending level. Of that amount, $129 million is from Proposition 98 General Fund and $21 million is from federal Title VI funds.
Figure 15
Budget for Student Assessments
(In Millions)
|
|
2010–11 Enacted
|
2011–12 Enacted
|
2012–13 Enacted
|
2013–14 Enacted
|
2014–15 Proposed
|
|
Expenditures
|
|
|
|
|
|
|
State–level contract costs
|
$88.0
|
$91.4
|
$94.4
|
$74.1
|
$125.9
|
|
District apportionmentsa
|
28.6
|
28.1
|
34.1
|
23.7
|
23.5
|
|
Totals
|
$116.7
|
$119.5
|
$128.5
|
$97.8
|
$149.4
|
|
Funding
|
|
|
|
|
|
|
State Proposition 98 General Fund
|
$88.7
|
$90.4
|
$104.0
|
$72.7
|
$128.8
|
|
Federal Title VI
|
28.0
|
29.1
|
24.5
|
25.1
|
20.6
|
|
Totals
|
$116.7
|
$119.5
|
$128.5
|
$97.8
|
$149.4
|
Provides Funding for New Exams Based on Consortium Estimates. The largest increase in proposed spending is associated with the higher costs of administering assessments in 2014–15. As shown in Figure 16, the budget includes $77 million for the ELA and math SBAC assessments. Of that amount, $67.5 million is to cover the estimated contract costs of administering, scoring, and reporting the new assessments. (This cost estimate is based on data provided by SBAC.) The remaining $9.6 million would be used to pay the SBAC–managed services for ongoing maintenance of the system, including adding additional test items and conducting additional research. (The exact cost of these services has not yet been finalized with SBAC.) Based on these two estimates, the state would spend a total of $24 per student on SBAC assessments.
Figure 16
Contract Costs for Student Assessments
2014–15 (In Millions)
|
New ELA and Math Assessments
|
|
|
Administration and reporting
|
$67.5
|
|
SBAC–managed servicesa
|
9.6
|
|
Subtotal
|
($77.0)
|
|
Development of New Assessments
|
|
|
English language development
|
$7.6
|
|
Next Generation Science Standards
|
4.0
|
|
Primary languages other than English
|
2.0
|
|
Subtotal
|
($13.6)
|
|
Ongoing Assessments
|
|
|
California High School Exit Exam
|
$11.4
|
|
Prior–year testing costs
|
8.3
|
|
California English Language Development Test
|
7.4
|
|
Cost of other assessments
|
6.1
|
|
Assessment review and reporting
|
2.1
|
|
Subtotal
|
($35.4)
|
|
Total State–Level Contract Costs
|
$125.9
|
Funds Development of Three New Assessments. The Governor’s budget also includes $13.6 million for the development of assessments aligned to the ELD standards ($7.6 million), the NGSS ($4 million), and ELA exams in primary languages other than English ($2 million). These funds would be used to contract with vendors to begin developing the new assessments.
Makes Funding Contingent on DOF Review of Contract Material. The funding provided for the new assessment system and development of future assessments is contingent upon DOF review of the SBE–approved contracts. The CDE would be prohibited from spending the funds until DOF approved the contracts.
Provides Additional Positions for Implementation of New System, Contingent Upon Additional Information. The Governor’s budget also includes $482,000 for CDE to manage additional assessment workload. The budget includes two, two–year, limited–term positions and $250,000 (non–Proposition 98 General Fund) for additional workload associated with creating an automated process and user interface integrating student–level data from the California Longitudinal Pupil Achievement Data System and the new testing system. The remaining $232,000 (non–Proposition 98 General Fund) is for hiring two program consultants at CDE that would be experts in the use of technology for student assessments. (No additional position authority is provided for these two consultants.) All four positions are contingent upon the submission of Feasibility Study Reports (FSRs) to DOF that document the need for additional positions. Funding for the two program consultants also is contingent upon DOF approval of an expenditure plan that justifies why the additional positions are necessary for monitoring the new assessment contract.
Higher Costs Appear Reasonable as New Tests More Expensive to Grade. The estimated annual cost of the new SBAC assessments—$24 per student—is significantly higher than the cost of previous ELA and math assessments. According to CDE, the state spent roughly $15 per student to administer grade–level exams in ELA and math from 2009–10 through 2011–12. These higher costs, however, appear reasonable considering the different structure of the new exams. Because the performance tasks included in the SBAC assessments will include several written response items and short essays, they cannot be scored by a computer. As a result, these assessments will be more expensive to score than the previous ELA and math CSTs, which consisted almost exclusively of multiple–choice questions that could be computer–scored. The exact costs of the new system, however, will ultimately depend on the cost of the new contract negotiated between the SBE and a vendor. The SBE is expected to release a Request for Submission during the spring of 2014, with the terms of a contract expected to be completed by the summer of 2014.
Higher Costs Also Linked to Interim and Formative Assessments. The higher cost of the SBAC assessments also is driven by the state’s plan to purchase interim and formative assessment tools from SBAC. The interim assessment software allows teachers to design exams throughout the year to measure some or all of the grade–level standards. Items on the interim assessment will use the same grading scale as the summative assessment, allowing for teachers to easily determine whether students have mastered the standards taught to date. Teachers also will have access to a digital library of formative tools—smaller learning modules or activities that can be used to improve instruction and assess student learning on a daily basis. Teachers will be able to rate items in the digital library, submit their own tools, and share with teachers in other member states.
Though Interim and Formative Assessments Increase State Costs, May Create Overall Efficiencies. Chapter 489 requires that the state purchase interim and formative assessments and make them available to districts at no cost. A portion of the estimated $9.6 million in costs for SBAC–managed services will be for accessing the interim and formative tools. In addition, the Governor’s budget provides $4.7 million in additional contract costs related to managing the interim assessment system. (Under the STAR testing system, the state provided no interim or formative tools to school districts. Districts that chose to administer interim assessments or purchase additional formative tools covered these costs using existing resources.) Although purchasing these tools from SBAC will increase state assessment costs, it likely would reduce total state and local costs on interim and formative tools given the economies of scale.
Recommend Additional Oversight of Contract. We recommend the Legislature adopt the Governor’s provisional language making assessment funding contingent upon DOF review of contract materials. This would ensure that the amount of funding provided in the budget is aligned with actual contract costs. We recommend the Legislature adopt additional language requiring the vendors of the state’s SBAC contract to meet with legislative staff and DOF staff on an annual basis to review components and costs of the contract. Such an approach would provide additional oversight of contract costs. The Legislature adopted similar language in 2010–11 and 2011–12.
Review FSRs Before Approving New Positions. The CDE has not yet provided FSRs related to the four new positions included in the Governor’s budget. Absent these reports, the Legislature lacks sufficient information to assess the merit of providing additional positions to CDE. We recommend the Legislature review the required FSRs and associated documentation prior to approving any new positions.
In Future Years, Consider Using SBAC Exams to Replace the High School Exit Exam. In addition to completing the appropriate coursework, California students must pass the California High School Exit Exam (CAHSEE) in order to graduate with a high school diploma. (Some students with disabilities are exempt from this requirement.) The CAHSEE covers both ELA and math. Because the CAHSEE is based on the prior ELA and math standards (based on math standards through the first part of Algebra I and ELA standards through grade 10), it will no longer be aligned with student expectations under the CCSS. Recent legislation modifying the state assessment system has not addressed the future of the CAHSEE. Rather than spending additional resources to develop a new high school exit exam, the Legislature could consider using a student’s performance on the 11th grade SBAC assessments to determine whether a student has demonstrated knowledge sufficient to earn a diploma. This would ensure that expectations for high school graduation are aligned with the CCSS, while avoiding duplicative tests and reducing testing time.
Using Teachers to Score Assessments Could Provide Professional Development Opportunities. In order to score the performance tasks in the SBAC assessments, the state’s contractor will hire and train individuals to review and score student responses. Individuals will be trained to develop a deep understanding of the CCSS and distinguish between high quality and low quality work. Because such training encourages mastery of the CCSS, it could serve as a quality professional development activity for teachers and other instructional staff. Given these potential benefits, the Legislature could consider requiring the state’s contractor to give priority to credentialed teachers and other school staff when hiring individuals to score SBAC performance tasks.
In this section, we discuss the Governor’s proposals relating to IS, provide our assessment of those proposals, and offer associated recommendations for the Legislature’s consideration.
Below, we provide information on certain state funding rules, IS programs, and special rules for charter schools running IS programs.
Most State Funding Linked to Students’ Seat Time. To qualify for state funding for students in a regular classroom setting, a district must offer a minimum number of classroom instructional hours per year. The required instructional hours—often known as seat time—vary by grade level (with a daily average of six hours required for grades 9 through 12, five hours for grades 4 through 8, 4.7 hours for grades 1 through 3, and 3.3 hours for kindergarten). Students generate state funding only for the days of the school year they are physically present in class.
IS Provides Alternative to Classroom–Based Instruction. In contrast to the traditional classroom setting, an IS program allows students to earn credit for academic work they complete independently. The purpose of an IS program is to allow schools to adapt activities and assignments to individual student needs without the requirement for daily attendance. An IS program can take a variety of forms, such as online instruction, blended learning (partially online and partially site–based), paper–based learning packets, assisted home–schooling, and internship–based learning. In all cases, students are supervised by a certificated teacher who assigns and evaluates student work on a periodic basis. Students enroll in IS programs for a variety of reasons, such as to gain flexibility in their schedules, recover missed credits, or because they prefer an individualized setting.
IS Funding Determined by Converting Student Assignments to Seat Time. Since IS students do not attend school on a daily basis, funding for IS programs is based on students’ academic work products. For each assignment, the supervising teacher equates a student’s work to an equivalent amount of seat time. This conversion is based on the supervising teacher’s judgment as to the number of classroom instructional hours that would have been required to achieve a similar amount of learning. An IS program can claim full per–pupil funding if the seat–time equivalent of the students’ work is the same as the time the students would have spent in a classroom setting.
IS Students Work Under Detailed Written Learning Contracts. Every student participating in IS works under an individualized learning contract. This document describes: (1) the time, place, and manner in which students will submit assignments; (2) the methods of study for the pupil’s work and the methods for evaluating that work; (3) the materials and staff resources that will be available to the student; and (4) the number of missed assignments that may occur before the school needs to reevaluate whether the student should remain in IS. An IS contract is valid for up to one semester, and a written copy of the contract must be signed by the student, one of the student’s parents, and all teachers who will instruct the student. In addition, IS programs must maintain records that include: (1) the date each work product was assigned, completed, and assessed; (2) representative samples of the student’s work signed and dated in all cases by the supervising teacher; and (3) written evidence that all state and local policies pertaining to IS have been observed. The IS programs are audited annually for compliance with these requirements. An IS program that fails to maintain the necessary records receives an audit finding and may face financial penalties—usually the requirement to repay the state funding generated by any students whose records are missing or incomplete.
IS Programs Have Limits on Student–Teacher Ratios. The state sets a cap on the ratio of students to teachers in IS programs. This cap is determined differently for school districts and charter schools. For a school district, the student–teacher ratio cannot exceed the districtwide average student–teacher ratio in classroom settings. For a charter school, the student–teacher ratio cannot exceed the average ratio for the largest unified school district within the county or 25:1, whichever is higher. (As a practical matter, many charter schools rely on the 25:1 cap because the ratio at the largest district—even when above 25:1—fluctuates from year to year.) If an IS program exceeds its ratio cap, the state provides no per–pupil funding for students in excess of the cap.
Participation in IS Concentrated in High Schools and Charter Schools. Available data suggest that about 140,000 California students took at least half of their coursework through IS in 2012–13. (An additional 25,000 students took at least one but fewer than half of their courses through IS.) Collectively, these students represent about 2.6 percent of all K–12 enrollment. Figure 17 shows the relative distribution of IS enrollment by grade level and provider. About two–thirds of total IS enrollments are high school students whereas one–third is elementary students. Regarding providers, about two–thirds are charter schools whereas one–third is district–run programs. (In recent years, enrollment in charter school IS programs has grown rapidly while enrollment in district–run programs has remained stable.)
IS Programs Sometimes Used to Deliver Blended Learning. Blended learning refers to programs in which students learn in part through supervised instruction at a school site and in part through independently completed online coursework. For funding purposes, these programs must count student attendance based on the requirements for classroom instruction (seat time) or IS (work products tied to seat time). The seat–time funding model tends to be used when the online coursework is provided on–site under the supervision of a teacher whereas the IS format tends to be used when the online coursework is conducted off–site.
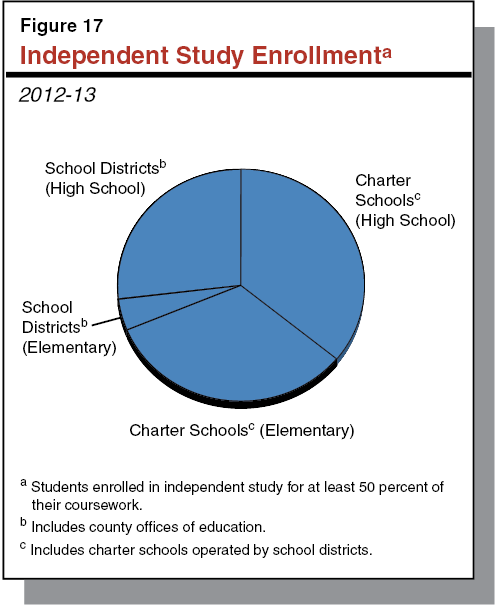
Special Fiscal Review Required for Certain Charter Schools. In 2001, the Legislature established a special fiscal review for charter schools offering IS programs. The review requires charter schools offering less than 80 percent of their instructional time in a classroom setting (most IS charter schools fall into this category) to submit financial information to the SBE every few years. Most notably, the SBE must verify these charter schools: spend at least 80 percent of their budget on instruction and related services, spend at least 40 percent specifically on salary and benefits for teachers, and meet the student–teacher ratio caps. Charter schools that do not meet these requirements can lose either 15 percent or 30 percent of their per–pupil funding. (For schools far below the requirements, the SBE may award no funding, effectively closing the charter school.) In 2012–13, about 250 charter schools (or one–fourth of all charter schools) were subject to this additional review, with about 10 receiving funding reductions of 15 percent.
As shown in Figure 18, the Governor has a package of IS proposals, which we discuss below.
Creates New “Course–Based” IS Option. The Governor proposes to allow high school IS programs to convert entire courses (rather than individual assignments) to seat time. Under this option, the local governing board would need to certify the seat–time equivalency of the IS course. In addition, the local board would need to certify the IS course was “of the same rigor and quality” as a classroom–based course and that the course included “all relevant local and state content standards.” Similar to existing IS programs, students would work under the general supervision of a teacher and work under written learning contracts, but these contracts (unlike existing IS contracts) could last up to one year and be stored electronically. Teachers would be required to communicate with students at least once a week to determine if students were making “satisfactory academic progress,” as measured through statewide assessments, the completion of assignments, and other locally determined measures. The communication could include an in–person meeting, phone call, or online video conference. If satisfactory progress was not occurring, the teacher would be required to inform the student’s parents/guardians and conduct an evaluation to determine whether the student should remain in IS. (Students removed from a course would be credited with a prorated share of the seat time approved for the course.)
Figure 18
Summary of Governor’s Independent Study Proposals
- ✓Creates New “Course–Based” Independent Study (IS) Option
- Allows local governing boards to convert entire courses (rather than individual assignments) to seat–time for funding purposes.
- Requires students to work under written learning agreements and the general supervision of a teacher (same as existing IS).
- Allows instruction to occur off site (same as existing IS).
- Requires students to make “satisfactory academic progress,” as determined weekly by a teacher, to remain in program.
- Allows IS programs serving grades 9 through 12 to use this option.
|
- ✓Creates Variant of New IS Option for Site–Based Blended Learning Programs
- Creates an option similar to the course–based IS option but with two major differences:
- Requires daily on–site instruction under the general supervision of a teacher. (An instructional aide could be responsible for providing instruction for some portion of the day.)
- Allows IS programs serving grades K–12 to use this option.
|
- ✓Makes Two Changes to Student–Teacher Ratio Caps
- Computes ratio caps by grade span instead of by districtwide averages.
- Allows ratios to exceed caps if agreed upon in a collective bargaining agreement.
|
- ✓Eliminates One Recordkeeping Requirement in Existing IS Programs
- Eliminates requirement that each student assignment bear the signature of the supervising teacher.
|
- ✓Exempts Charter Schools Using New IS Options From Special Fiscal Review
- Exempts charter schools using new IS options from the special fiscal review generally required of charter schools offering IS programs.
|
Creates Variant of New IS Option for Blended Learning Programs. The Governor proposes to create a variant of the course–based IS option to serve certain types of site–based blending learning programs. This option includes all of the elements from the course–based option, including written learning contracts, but contains two major modifications. First, students would be required to be on a school site on a daily basis, similar to students in a classroom–based program. Unlike a classroom–based program, however, students could be supervised during this time by their teacher or an instructional aide. Second, this option would be open to IS programs serving grades K–12 rather than limited to grades 9 through 12.
Makes Two Changes to Student–Teacher Ratio Caps. Under the Governor’s proposal, all IS programs would be subject to the caps on student–teacher ratios. The Governor proposes, however, to make two changes affecting these caps. For school districts, the caps would be calculated separately for grade spans K–3, 4 through 6, 7 through 8, and 9 through 12 rather than being based on the districtwide average. The Governor also proposes to allow the caps to be exceeded if agreed upon in a local collective bargaining agreement.
Eliminates One Recordkeeping Requirement in Existing IS Programs. For existing IS programs that do not want to use the new course–based IS options, the Governor proposes to eliminate the requirement that all student assignments be signed and dated by a supervising teacher. (The underlying requirements for teachers to evaluate student assignments, keep a record of all work assigned, and maintain representative samples of student work would remain in place.)
Exempts Charter Schools Using New IS Options From Special Fiscal Review. The Governor proposes to deem charter schools that use either of the new IS options as classroom–based for the purpose of determining whether a charter school must receive special fiscal review. That is, these charter school IS courses would count as classroom time (regardless of how or where the course was taught), thereby being exempt from the special fiscal review.
Compared to the IS proposals the Governor introduced last year, the proposals introduced this year are more modest—making changes to certain funding and programmatic rules but maintaining much of the basic structure of IS. As shown in Figure 19, we think many of the components of the Governor’s IS proposals this year have merit, though we identify several ways the Legislature could improve upon the proposals.
Figure 19
Summary of Independent Study Recommendations
|
Governor’s Proposal
|
LAO Recommendations
|
|
Creates new “course–based” Independent Study (IS) option
|
- Adopt basic proposal.
- Extend proposal to all grades.
- Require additional information on standards and learning goals for each course.
|
|
Creates variant of new IS option for site–based blended learning programs
|
- Reject proposal (programs can be accommodated by above option, if extended to all grades).
|
|
Makes two changes to student–teacher ratio caps
|
- Adopt proposal.
- Providing corresponding flexibility to charter schools.
|
|
Eliminates one recordkeeping requirement in existing IS programs
|
- Adopt proposal.
- Allow contracts to last up to one year.
- Allow electronic recordkeeping.
|
|
Exempts charter schools using new IS options from special fiscal review
|
- Reject proposal.
- Simplify and refocus fiscal review process.
|
New IS Options
Course–Based Option Includes Reasonable, Streamlined Seat–Time Conversion Process. The Governor’s proposal to establish a seat–time equivalency for each course provides a reasonable mechanism of counting students for funding purposes. Although the Governor maintains many of the administrative requirements currently imposed on existing IS, eliminating assignment–based time conversions would reduce some tasks that require the particular effort of teachers (such as maintaining detailed logs of all assignment and making time judgments about every assignment). The resources not spent on these administrative tasks could be directed toward student instruction and other activities. Placing responsibility for the seat–time conversion on local governing boards also has the benefit of making boards more accountable for the quality of their IS programs. For all these reasons, we recommend the Legislature adopt this proposal.
(Although there could be some concern that local governing boards might assign different amounts of seat time to a course, existing IS programs also face this issue in that teachers can assign different amounts of seat time to similar student assignments. Furthermore, the Governor’s proposal includes some elements that could make the seat–time conversion process more consistent than under current IS programs, including a clear standard for approving courses and board disclosure of the amount of seat time approved for each course.)
Course–Based Option Also Facilitates a Variety of Instructional Formats. Another strength of the Governor’s course–based IS proposal is that it can accommodate a variety of instructional formats. That is, rather than focus narrowly on encouraging a specific type of instruction, the Governor establishes a framework that schools can use to receive funding for a variety of programs that best meet local needs. This approach could encourage local creativity in offering new types of nontraditional instruction, thereby expanding the options for students with needs less easily served in a classroom setting. The framework also is consistent with the Legislature’s recent focus on increasing the autonomy of schools.
Course–Based IS Option Could Benefit Earlier Grades. Given the versatility of the Governor’s proposal for course–based IS, we believe the option could benefit K–8 IS programs too. The concerns that motivate the creation of the course–based option, such as reducing paperwork requirements, apply equally to IS programs serving earlier grades. New and nontraditional forms of instruction may be found in all grade levels and adopting a proposal only for high school IS programs misses an opportunity to encourage innovation in earlier grades. For these reasons, we recommend extending this option to all grades (K–12).
Additional Information on Standards and Learning Goals Could Improve Course–Based IS. We believe the Governor’s proposal for course–based IS could be further improved by requiring local governing boards to provide additional information when approving courses. Specifically, we recommend the governing board disclose for each course: (1) the relevant local and state content standards reflected in the course and (2) the student learning goals for the course. This information would help local stakeholders—including students, parents, and teachers—compare an IS course with a classroom–based course to determine if the courses were similar in content and rigor. It also would help these stakeholders determine whether the amount of seat time approved for each course was reasonable given what the students would be learning. Given that local governing boards already would need to ensure the course was of comparable rigor and included relevant standards, we believe this requirement could be satisfied with only a small amount of additional work.
Site–Based Blended Option Provides Little New Flexibility. We are concerned that the site–based blended learning option would provide little, if any, added benefit—especially if the course–based IS option were extended to grades K–8. The blended learning option allows an instructional aide to provide classroom supervision but only in exchange for placing all students on an IS contract and providing daily instruction on–site. The supervision requirements are more flexible than the rules for classroom–based instruction, but less flexible than the rules for existing IS or the new course–based option. (Under either of these latter options, there is no requirement for any particular amount of time on site, and time on site may be supervised by a teacher or other individual.) We think a blended learning program willing to make the effort of establishing learning contracts for all of its students would be likely to use one of the more flexible IS options. For these reasons, we recommend the Legislature reject the proposal.
Student–Teacher Ratio
Changes to Student–Teacher Ratio Caps Would Increase Flexibility for Most School Districts. Computing the IS caps by grade span would result in IS student–teacher ratios being more comparable to other district programs. As a result, the proposal would increase flexibility for high school IS programs. This is because class sizes in high schools tend to be larger than in elementary schools. We estimate that basing the IS high school cap on other high school programs would effectively raise the IS cap by about two students per teacher. (Conversely, the IS cap in earlier grades would be lowered, but since relatively few school districts enroll elementary students in IS programs, the effect is less significant.) The Governor’s proposal to allow higher caps to be collectively bargained would allow schools the flexibility to increase student–teacher ratios above current limits but would minimize the chances that a district adopts an excessively high ratio. We believe both of the Governor’s proposed changes to the IS caps are reasonable and recommend adopting them.
Grade–Span Adjustment Does Not Provide Corresponding Flexibility to Charter Schools. The Governor’s proposal to compute IS student–teacher ratios by grade span provides greater flexibility for school districts but little new flexibility for charter schools. Although charter schools would be allowed to compare their IS ratios to the grade span–adjusted ratios in the largest unified school district, those ratios change annually, making many charter schools reliant on the 25:1 ratio. In addition, only about 20 percent of charter schools have collective bargaining agreements in place that would allow them to negotiate a higher cap. To provide corresponding flexibility to charter schools, we recommend the Legislature increase the ratio cap for their IS programs serving grades 9 through 12 from 25:1 to 27:1—consistent with the expected increase of two students per teacher in district IS high school programs. (For other grade levels, the charter school ratio requirement would remain 25:1.)
Recordkeeping
Recommend Eliminating Recordkeeping Requirement in Existing IS Programs. We recommend adopting the Governor’s proposal to eliminate the requirement for supervising teachers in existing IS programs to sign every assignment. As described earlier, an IS program is required to maintain an extensive “paper trail” including assignment logs, samples of assignments, and other documentation. Removing the signature requirement would eliminate one highly specific compliance requirement while leaving other recordkeeping in place.
Charter School Special Fiscal Review
Existing Fiscal Review Process Has Several Drawbacks. We think the special fiscal review process for charter schools has several drawbacks. Some parts of the review—such as the requirement to spend a fixed percent of revenues on staff salary—are not well aligned with goals the Legislature has established for charter schools, such as the encouragement of “different and innovative teaching methods.” Additionally, charter schools that miss one of the spending thresholds by a narrow margin face a loss of 15 percent of their funding, creating a “cliff” around the thresholds. Moreover, some aspects of the process are not clearly defined, such as how facility–related costs should be counted toward the spending thresholds. Given these issues, we believe the special fiscal review could be improved.
Governor’s Proposed Solution Raises Concern. Although the special fiscal review has several problems, we are concerned about the Governor’s proposed solution. Under his proposal, a charter school using the course–based IS option would be exempt from the review while a charter school offering a similar academic program and using the existing IS option would be subject to the review. That is, apart from whether they use assignment–based or course–based attendance accounting, the two schools could be very similar in every other way, yet only one would be subject to the review. We can identify no compelling reason why the method of converting IS to seat time should be a deciding factor in triggering this review. We recommend the Legislature reject the Governor’s proposal but consider alternatives for improving charter school fiscal oversight (as discussed below).
Recommend Either Improving Review Process or Strengthening Routine Fiscal Oversight. The Legislature has two basic options for improving the fiscal oversight of charter schools operating IS programs.
- Rework Special Fiscal Review Process. One option would be to simplify and refocus the special fiscal review for all charter school IS programs. The Legislature could do this by relaxing some of the more specific spending requirements and reducing the penalties that accompany narrowly missing the spending thresholds.
- Redirect Resources Toward New Process. Alternatively, the Legislature could consider whether the resources devoted to reviewing all IS charter schools would be better spent scrutinizing schools that show warning signs of financial abuse or mismanagement. For example, the state could replace the existing review with heighted scrutiny of all schools that received negative audit findings, displayed unusual spending patterns, or generated formal complaints.