This publication summarizes California’s 2014–15 spending plan, including legislative and gubernatorial action through October 2014. A preliminary electronic version was released in August 2014. This final published version reflects bills that were approved in August and September 2014. Figures, however, reflect estimated spending totals as of the June version of the budget act.
Figure 1 displays total state and federal spending in the 2014–15 Budget Act. The 2014–15 budget package assumes total state spending of $152.3 billion, an increase of 8.6 percent over revised totals for 2013–14. This consists of $108 billion from the General Fund and the Education Protection Account created by Proposition 30 (2012), and $44.3 billion from special funds. The budget package assumes spending from federal funds to be $98 billion, an increase of 20.9 percent over 2013–14 revised levels, mainly due to increases in the health area of the budget. Bond spending is expected to decline 53 percent in 2014–15. (We discuss changes in bond spending in the “Resources Programs” and “Transportation” sections of “Chapter 2.”)
Figure 1
Total State and Federal Fund Expenditures
(Dollars in Millions)
|
Fund Type
|
Revised
|
Enacted 2014–15a
|
Change From
2013–14
|
|
2012–13
|
2013–14
|
Amount
|
Percent
|
|
General Fundb
|
$96,562
|
$100,711
|
$107,987
|
$7,276
|
7.2%
|
|
Special funds
|
37,724
|
39,528
|
44,324
|
4,796
|
12.1
|
|
Budget Totals
|
$134,286
|
$140,239
|
$152,311
|
$12,072
|
8.6%
|
|
Selected bond funds
|
$6,715
|
$8,689
|
$4,046
|
–$4,643
|
–53.4%
|
|
Federal funds
|
70,431
|
81,059
|
98,001
|
16,941
|
20.9
|
General Fund Revenues
Figure 2 displays the revenue assumptions incorporated in the 2014–15 Budget Act.
Modest Revenue Growth Assumed for 2014–15. The budget package assumes General Fund and Education Protection Account revenues to be $107 billion in 2014–15, an increase of nearly 5 percent over 2013–14 levels. Revenues from California’s “Big Three” taxes—the personal income tax, sales and use tax, and corporation tax—are projected to increase $5.6 billion, or 5.7 percent, over 2013–14. Transfers and loans are expected to decline significantly in 2014–15, reflecting in part several hundred million dollars less in budgetary borrowing from special funds. This decline would have been even larger had the total included the $1.6 billion transfer from the General Fund to the Budget Stabilization Account (BSA) created by Proposition 58 (2004). (We exclude that transfer from revenue data in Figure 2 to improve comparability with prior–year totals.)
Figure 2
2014–15 Budget Act Revenue Assumptions
General Fund and Education Protection Account Combined (Dollars in Millions)
|
|
2012–13
Estimated
|
2013–14
Estimated
|
2014–15
Enacted
|
Change From 2013–14
|
|
Amount
|
Percent
|
|
Personal income tax
|
$64,484
|
$66,522
|
$70,238
|
$3,716
|
5.6%
|
|
Sales and use tax
|
20,482
|
22,759
|
23,823
|
1,064
|
4.7
|
|
Corporation tax
|
7,783
|
8,107
|
8,910
|
803
|
9.9
|
|
Subtotals, “Big Three” taxes
|
($92,749)
|
($97,388)
|
($102,971)
|
($5,583)
|
(5.7%)
|
|
Insurance tax
|
$2,221
|
$2,287
|
$2,382
|
$95
|
4.2%
|
|
Other revenues
|
2,619
|
2,163
|
2,400
|
237
|
10.9
|
|
Transfers and loans
|
1,813
|
347
|
–658
|
–1,005
|
–289.8
|
|
Totals
|
$99,402
|
$102,185
|
$107,095
|
$4,910
|
4.8%
|
The Condition of the General Fund
Figure 3 summarizes the estimated General Fund condition for 2013–14 and 2014–15.
Figure 3
General Fund Condition
General Fund and Education Protection Account Combined (Dollars in Millions)
|
|
2013–14
|
2014–15a
|
Percent Change
|
|
Prior–year balance
|
$2,429
|
$3,903
|
|
|
Revenues and transfers
|
102,185
|
107,095b
|
4.8%
|
|
Total resources available
|
$104,614
|
$110,998
|
|
|
Total expenditures
|
$100,711
|
$107,987c
|
7.2%
|
|
Ending fund balance
|
$3,903
|
$3,011
|
|
|
Encumbrances
|
$955
|
$955
|
|
|
Total Reserves
|
$2,948
|
$2,056
|
|
|
Special Fund for Economic Uncertainties
|
$2,948
|
$450
|
|
|
Budget Stabilization Account
|
—
|
1,606
|
|
2013–14 Expected to Be Second Straight Fiscal Year to End “In The Black.” California ended four straight fiscal years—2008–09 through 2011–12—with negative ending balances in its Special Fund for Economic Uncertainties (SFEU). In January 2014, the Governor’s budget proposal included the final revised estimate of the ending balance for 2012–13—a positive balance of $1.6 billion in the SFEU. With revenues and transfers outpacing expenditures by nearly $1.5 billion in 2013–14, the ending balance for 2013–14 is expected to grow to nearly $3 billion (after adjusting for other changes).
2014–15 Projected to End With $2.1 Billion in Total Reserves. The budget plan assumes expenditures will grow $7.3 billion, or 7.2 percent, in 2014–15. Revenue growth of 4.8 percent in 2014–15 produces a small operating deficit—that is, the difference between General Fund revenues and expenditures in that year—of $892 million. Consequently, total state reserves decline, from $2.9 billion at the end of 2013–14 to $2.1 billion at the end of 2014–15. The 2014–15 reserve is a combination of $1.6 billion in the BSA and $450 million in the SFEU.
Major Features of the 2014–15 Spending Plan
Similar to the 2013–14 budget, the 2014–15 spending plan makes targeted augmentations in a few areas while paying down several billion dollars in key liabilities. The major features of the budget package are summarized below. We discuss these and other actions in more detail in “Chapter 2.” In addition, if certain revenue and other targets are met, additional spending—mostly for paying down debt—would be “triggered” under the budget plan. We discuss these spending triggers in the box below.
Budget Plan Includes Three Spending Triggers
If the Director of Finance determines that certain conditions have been met, additional spending would be authorized under the 2014–15 budget. The three spending triggers are:
- Education Deferral Pay Downs. By the 2015 May Revision, the Director of Finance will determine whether the Proposition 98 minimum guarantee for 2013–14 and 2014–15 is higher than that assumed in the 2014–15 budget package. If the guarantee has increased, the state would use up to $992 million to retire all remaining school and community college payment deferrals.
- City, County, and Special District Mandates. By the 2015 May Revision, the Director of Finance will estimate whether General Fund revenues exceed the administration’s May 2014 forecast. If so, after setting aside funds necessary to satisfy the Proposition 98 guarantee, any remaining revenue—up to $800 million—would be allocated to cities, counties, and special districts for outstanding mandate claims from prior to 2004.
- Deferred Maintenance. The enacted budget plan included up to $200 million in one–time General Fund spending for various state entities to reduce their maintenance backlogs. The deferred maintenance trigger was dependent on whether local school property taxes as shown in a preliminary 2013–14 estimate exceeded the estimate included in the Governor’s 2014 May Revision. On July 16, 2014, the Director of Finance determined that the preliminary estimate did not exceed the May 2014 estimate. Therefore, the additional spending for deferred maintenance was not authorized. Later changes in property tax estimates will not affect this action.
Fully Funds CalSTRS Pension Program. As of the end of 2012–13, the California State Teachers’ Retirement System (CalSTRS) had a $74 billion shortfall. Budget–related legislation aims to erase the unfunded liability in 32 years by increasing contributions from the state, school and community college districts, and teachers.
Proposition 98. The budget plan includes large Proposition 98 funding increases for schools and community colleges. The Proposition 98 budget continues implementation of the Local Control Funding Formula, pays down most of the remaining payment deferrals, and pays down several hundred million dollars of other Proposition 98 obligations.
Creates Additional Child Care Slots. The budget augments spending on child care and preschool by $255 million. This total includes $67 million for 7,500 additional preschool slots, bringing the total number of slots to almost 150,000. (In addition, the budget includes $3 million for another 4,000 preschool slots effective June 15, 2015.) The budget also includes $68 million for provider rate increases, and $75 million (including $25 million one time) for various quality improvement activities.
Makes Limited Augmentations to Health and Human Services Programs. Similar to recent years, the budget includes targeted augmentations in health and human services programs. The budget increases In–Home Supportive Services funding by $172.2 million to comply with new federal labor regulations for home care workers. In addition, the budget includes a total of about $80 million for various policy–related augmentations in the California Work Opportunity and Responsibility to Kids program (including a 5 percent grant increase) and $54 million for increased capacity for patients at state hospitals.
Enacts Cap–And–Trade Spending Plan. The 2014–15 budget includes $832 million from the Greenhouse Gas Reduction Fund for various programs, including $250 million for the state’s high–speed rail project. In addition, budget–related legislation specifies how the state will spend cap–and–trade auction revenues beginning in 2015–16.
Pays Down Remainder of Economic Recovery Bonds (ERBs). The budget transfers 3 percent of General Fund revenues—or $3.2 billion—to the BSA. Under Proposition 58, one–half of those revenues must be used to accelerate the repayment of the state’s prior deficit financing bonds, known as ERBs. The $1.6 billion payment is expected to pay off the remaining principal on the ERBs during 2014–15.
Increases Pay for Most State Employees. Most state employees will receive a 2 percent pay increase beginning July 1, 2014. Other groups of state employees, including highway patrol officers and correctional officers, will receive higher pay increases during the 2014–15 fiscal year. In total, the budget includes $500 million ($220 million from the General Fund) for pay increases in 2014–15.
Provides Funding for Multifamily Housing. The budget includes $100 million in one–time funding for the Multifamily Housing Program, which provides deferred–payment loans to developers of affordable housing projects. One–half of the funds will be dedicated to projects that include support services, such as job training and substance abuse counseling.
The Governor signed the 2014–15 Budget Act on June 20, 2014. Between that date and October 2014, the Governor signed 26 budget–related bills into law. The budget and related bills are detailed in Figure 4.
Figure 4
Selected Budget–Related Legislation
|
Bill Number
|
Chaptera
|
Subject
|
|
SB 852a
|
25
|
2014–15 Budget Act
|
|
AB 1468
|
26
|
Public safety
|
|
AB 1469a
|
47
|
CalSTRS funding plan
|
|
AB 1476
|
663
|
Amendments to the 2014–15 Budget Act
|
|
AB 1478
|
664
|
Public resources
|
|
SB 853
|
27
|
Transportation
|
|
SB 854
|
28
|
State and local government
|
|
SB 855
|
29
|
Human services
|
|
SB 856
|
30
|
Developmental services
|
|
SB 857
|
31
|
Health
|
|
SB 858
|
32
|
Education
|
|
SB 859
|
33
|
Local Control Funding Formula
|
|
SB 860
|
34
|
Higher education
|
|
SB 861
|
35
|
Public resources
|
|
SB 862
|
36
|
Cap–and–trade spending plan
|
|
SB 863
|
37
|
Correctional facilities
|
|
SB 865
|
38
|
Amendments to the 2013–14 Budget Act
|
|
SB 869
|
39
|
School facilities
|
|
SB 870
|
40
|
Health
|
|
SB 871
|
41
|
Property tax exemption for solar facilities
|
|
SB 873
|
685
|
Human services amendments
|
|
SB 875
|
686
|
Public safety
|
|
SB 876
|
687
|
Education
|
|
SB 877
|
688
|
Correctional facilities
|
|
SB 878
|
689
|
In–Home Supportive Services
|
|
SB 879
|
690
|
State employees: memoranda of understanding
|
|
SB 883a
|
691
|
West Contra Costa Healthcare District
|
January Budget Proposed $2.3 Billion Reserve. On January 9, 2014, the Governor released his 2014–15 budget proposal. The Governor proposed to make the first deposit in the BSA since 2007–08. Total reserves under the budget plan were to be $2.3 billion—$1.6 billion in the BSA and $693 million in the SFEU. The Governor proposed a new rainy–day fund measure that, with some changes, later became Proposition 2. (Proposition 2 will be before the voters in November 2014.) The budget proposal also paid down several billion dollars of key liabilities, included large funding increases under Proposition 98, proposed a cap–and–trade spending plan, continued the Governor’s multiyear plan for the universities, and included $815 million for deferred maintenance projects.
February Drought Legislation. In February 2014, the Governor signed two bills that appropriated a total of $687 million ($75 million from the General Fund) to address the state’s drought. This included funding for local water supply projects, flood protection, groundwater management activities, and assistance programs for individuals affected by the drought. (The 2014–15 Budget Act provides an additional $151 million—$123 million from the General Fund—in mostly one–time funding for other drought programs.)
May Revision Contained Higher Revenue Forecast. The administration’s May 2014 forecast included about $2.4 billion in higher General Fund and Education Protection Account revenues compared with the administration’s January forecast. These revenues were offset by higher spending requirements under Proposition 98 and various cost increases in health and human services programs. As a result, the May Revision proposed total reserves of $2.1 billion, down slightly from the January budget plan. Most notably, the May Revision contained a proposal to fully fund the CalSTRS pension program within 32 years.
Legislature Passes Budget Package. Our office’s May 2014 revenue forecast was about $2.5 billion higher than that of the administration for four fiscal years combined (2011–12 through 2014–15). Much of the higher revenues in our forecast, however, resulted in increased General Fund requirements under Proposition 98, leaving little “bottom line” benefit for the rest of the budget. During budget hearings in late May, the budget committees in the Assembly and Senate adopted our office’s higher revenue estimates, as well as our office’s lower estimate of Medi–Cal spending related to the federal Patient Protection and Affordable Care Act. Both houses adopted a broad set of spending augmentations, most notably in the education and health and human services areas of the budget. After negotiations with the Governor, however, the Legislature passed a budget package on June 15, 2014 that incorporated the administration’s lower revenue estimates and excluded many of the augmentations that were discussed in Conference Committee.
Budget Package Signed by Governor. The budget bill and most trailer bills were signed on June 20, 2014. The Governor did not veto any General Fund appropriations, but vetoed $38 million in appropriations from other funds.
Legislature Adopts Additional Budget–Related Legislation. In August, the Legislature sent nine additional budget–related bills to the Governor. As passed by the Legislature, Chapter 663, Statutes of 2014 (AB 1476, Committee on Budget), increased the University of California and California State University budgets by $50 million each. Budget language stated that the augmentations were for one–time purposes, including deferred maintenance. The Governor, however, used his line–item veto authority to eliminate these augmentations.
Calculating the Minimum Annual Funding Requirement for Schools and Community Colleges. Approved by voters in 1988, Proposition 98 establishes a minimum annual funding requirement for schools and the California Community Colleges (CCC). This funding level, commonly known as the “minimum guarantee,” is determined by one of three formulas. The formulas—commonly called “tests”—take into account various factors including General Fund revenues, per capita personal income, and K–12 average daily attendance. The guarantee generally grows at least as quickly as the overall state economy (as measured by per capita personal income). In some cases, the guarantee, however, grows more slowly. In these years, the state creates an out–year obligation known as “maintenance factor.” In ensuing years, the state is required to pay off maintenance factor by increasing school and community college funding to a level at least as high as it would have been had the guarantee always grown with the economy. The guarantee is met through a combination of state General Fund and local property tax revenues.
Below, we describe how the minimum guarantee has changed for 2012–13, 2013–14, and 2014–15. We then describe associated changes in spending for schools and community colleges.
As a result of changes in General Fund revenues, local property tax revenues, and student attendance, the budget plan includes revised estimates of the 2012–13 and 2013–14 minimum guarantees. We describe these changes in greater detail below. We then describe major factors driving the estimate of the 2014–15 minimum guarantee.
2012–13 Minimum Guarantee Up $1.3 Billion From June 2013 Estimate. As shown in Figure 1, the revised estimate of the 2012–13 minimum guarantee is $57.8 billion. This is an increase of $1.3 billion over the June 2013 estimate (and $4.3 billion above the 2012–13 Budget Act estimate). Nearly all of the increase since June 2013 is due to General Fund revenues now being $1.2 billion higher than prior estimates. Changes in 2012–13 revenue estimates have a nearly dollar–for–dollar effect on the minimum guarantee. This is because Test 1 is operative and a maintenance factor payment is required. The remaining increase in the 2012–13 guarantee is due to local property tax revenues being $101 million higher than was previously assumed. Because 2012–13 is a Test 1 year, increases in property tax revenues increase the minimum guarantee.
Figure 1
Proposition 98 Funding
(In Millions)
|
|
2012–13
Revised
|
2013–14
|
|
2014–15
|
|
June 2013 Estimate
|
June 2014 Estimate
|
Change
|
Enacted
|
Change From 2013–14
|
|
Preschool
|
$481
|
$507
|
$507
|
—
|
|
$664
|
$157
|
|
K–12 Education
|
|
|
|
|
|
|
|
|
General Fund
|
$37,271
|
$34,730
|
$37,958
|
$3,229
|
|
$39,427
|
$1,469
|
|
Local property tax revenue
|
13,848
|
13,936
|
13,405
|
–531
|
|
14,089
|
684
|
|
Subtotals
|
($51,119)
|
($48,665)
|
($51,363)
|
($2,698)
|
|
($53,516)
|
($2,153)
|
|
California Community Colleges
|
|
|
|
|
|
|
|
|
General Fund
|
$3,853
|
$3,741
|
$4,187
|
$446
|
|
$4,293
|
$105
|
|
Local property tax revenue
|
2,264
|
2,291
|
2,167
|
–124
|
|
2,309
|
141
|
|
Subtotals
|
($6,117)
|
($6,032)
|
($6,355)
|
($323)
|
|
($6,601)
|
($247)
|
|
Other Agencies
|
$78
|
$77
|
$78
|
$1
|
|
$77
|
—
|
|
Totals
|
$57,795
|
$55,281
|
$58,302
|
$3,021
|
|
$60,859
|
$2,557
|
|
General Fund
|
$41,682
|
$39,055
|
$42,731
|
$3,676
|
|
$44,462
|
$1,732
|
|
Local property tax revenue
|
16,112
|
16,226
|
15,572
|
–655
|
|
16,397
|
826
|
2013–14 Minimum Guarantee Up $3 Billion From June 2013 Estimate. The revised estimate of the 2013–14 minimum guarantee is $58.3 billion—$3 billion higher than the June 2013 estimate. This increase is primarily due to an increase in the year–to–year growth in per capita General Fund revenues. The increase in General Fund revenues increases the minimum guarantee by $2.9 billion. The minimum guarantee also increases by $80 million due to higher–than–expected growth in K–12 attendance. (Because “Test 3” is operative in 2013–14, the guarantee depends on the prior–year funding level adjusted for growth in per capita General Fund revenues and K–12 attendance.)
2013–14 Guarantee Affected by “Spike Protection” Provision. The 2013–14 minimum guarantee would have been higher if not for the spike protection provision of Proposition 98. In a year when the minimum guarantee increases at a much faster rate than per capita personal income, the spike protection provision excludes a portion of Proposition 98 funding from the calculation of the minimum guarantee the subsequent year. This essentially prevents a portion of the prior–year Proposition 98 appropriation from permanently increasing the minimum guarantee in future years. The significant increase in the 2012–13 minimum guarantee triggered spike protection in 2013–14—the first time the provision ever has taken effect. The result was a corresponding $2.2 billion reduction in the 2013–14 minimum guarantee (from what it would have been absent the spike protection provision).
2013–14 Local Property Tax Revenues Down $655 Million. The 2013–14 estimate of local property tax revenues has decreased by $655 million since the adoption of the 2013–14 Budget Act. Of the decline, $436 million is due to lower estimates of redevelopment agency property tax revenues. The remaining $219 million is due to lower estimates of baseline property tax revenues.
2014–15 Minimum Guarantee Up $2.6 Billion Over Revised 2013–14 Levels. The 2014–15 minimum guarantee is $60.9 billion, an increase of $2.6 billion over the revised 2013–14 estimate. The increase is primarily driven by an increase in General Fund revenue. Since Test 1 is operative in 2014–15, the guarantee also increases due to growth in local property tax revenues.
Changes in Maintenance Factor Obligation Over Period. As shown in Figure 2, the state makes a $5.2 billion maintenance factor payment in 2012–13—the largest maintenance factor payment ever made to date. This payment reduces the state’s outstanding maintenance factor obligation from $11 billion to $5.8 billion. In 2013–14, $458 million in new maintenance factor is created, as Test 3 is operative and the minimum guarantee grows more slowly than the economy. In 2014–15, the state makes another large maintenance factor payment ($2.6 billion). The state is expected to end the three–year period with an outstanding maintenance factor of $4 billion.
Figure 2
Maintenance Factor Paid and Created Over Period
(Dollars in Millions)
|
|
2012–13
|
2013–14
|
2014–15
|
|
Operative Test
|
1
|
3
|
1
|
|
Maintenance factor created/paid (+/–)
|
–$5,155
|
$458
|
–$2,583
|
|
Outstanding maintenance factor
|
5,844
|
6,622
|
4,017
|
As discussed above, funding for K–14 education increases significantly under the new budget package. In the sections that follow, we describe how the state is spending these funds. We first describe crosscutting actions—deferrals, mandates, energy projects, and the Quality Education Investment Act (QEIA)—that affect both schools and community colleges. We then describe proposals specific to schools, followed by the proposals specific to community colleges. A discussion of preschool funding is included in the “Child Care and Preschool” section of this report.
Deferral Payments
Pays Down $5.2 Billion in Outstanding Deferrals. As Figure 3 shows, the budget package pays down $5.2 billion in outstanding deferrals ($4.7 billion for schools and $498 million for community colleges). Of the total paydown, $1.4 billion is designated as 2012–13 spending, $3.1 billion is designated as 2013–14 spending, and $662 million is designated as 2014–15 spending. Under the budget plan, $992 million in deferrals ($897 million for schools and $94 million for community colleges) would remain outstanding at the end of 2014–15.
Figure 3
State Paying Down Nearly All Remaining Deferrals
(In Millions)
|
|
K–12
Education
|
Community
Colleges
|
Totals
|
|
Outstanding Deferrals at End of 2013–14
|
$5,571
|
$592
|
$6,164
|
|
Paydowns scored to:
|
|
|
|
|
2012–13
|
$1,295
|
$139
|
$1,433
|
|
2013–14
|
2,781
|
296
|
3,077
|
|
2014–15
|
599
|
63
|
662
|
|
Total Paydowns
|
$4,674
|
$498
|
$5,172
|
|
Outstanding Deferrals at End of 2014–15a
|
$897
|
$94
|
$992
|
Eliminates Remaining Deferrals if Minimum Guarantee Exceeds Estimates. The budget package pays down additional deferrals (potentially eliminating all outstanding deferrals) if subsequent estimates of the 2013–14 and 2014–15 minimum guarantees are higher than the administration’s May 2015 estimates. Effectively, the budget plan earmarks the first $992 million in potential additional 2013–14 and 2014–15 spending for deferral paydowns.
Mandates
Pays Down $450 Million in Outstanding Education Mandate Claims. We estimate the state currently has a backlog of more than $5 billion in unpaid claims for education mandates. The budget includes $400 million to reduce the mandate backlog for schools. (Of this amount, $287 million is 2014–15 Proposition 98 funding and $113 million is from unspent prior–year fund.) The budget includes $50 million to reduce the backlog for community colleges (all 2014–15 Proposition 98 funding). Funds will be distributed to schools and community colleges on a per–student basis.
Adds Several Mandates to School and Community College Block Grants. The Commission on State Mandates recently approved seven new reimbursable education mandates. Six of these mandates apply to schools, two apply to community colleges, and one applies to both schools and community colleges. For schools, the budget adds to the block grant mandates related to (1) parental involvement procedures, (2) compliance activities associated with the Williams v. California case, (3) uniform complaint procedures, (4) developer fees, (5) charter school oversight, and (6) public contracts. For community colleges, the budget repeals one mandate related to certain information included in infrastructure plans and adds to the block grant one mandate related to public contracts. The budget does not increase funding for either block grant as the added costs are expected to be minimal.
Energy Grants
State Provides Second–Year Funding for Energy Projects. Passed by voters in November 2012, Proposition 39 increases state corporate tax revenues and requires for a five–year period, starting in 2013–14, that a portion of these revenues be used to improve energy efficiency and expand the use of alternative energy in public buildings. The 2014–15 budget provides $345 million Proposition 98 General Fund for Proposition 39 school and community college energy programs. Specifically, the budget provides $279 million for school grants, $38 million for community colleges grants, and $28 million for the revolving loan program for both schools and community colleges. (Estimates of Proposition 39 revenues are lower in 2014–15 compared to 2013–14, resulting in less provided for school and community college grants.) The budget also provides $8 million non–Proposition 98 General Fund for Proposition 39 job–training programs administered by the California Conservation Corps ($5 million) and the California Workforce Investment Board ($3 million).
Chapter 751 Obligation
Makes Final $410 Million Payment on Outstanding Proposition 98 Obligations From 2004–05 and 2005–06. The 2014–15 budget makes a final $410 million payment to retire the state’s obligation set forth in Chapter 751, Statutes of 2006 (SB 1133, Torlakson). Chapter 751 required the state to provide additional annual school and community college payments until a total of $2.8 billion had been provided. Of the amount provided in the budget package, $316 million is for continued funding of the QEIA program ($268 million for schools and $48 million for community colleges) and $94 million is to pay down a separate state obligation related to school facility repairs.
K–12 Education
As shown in Figure 4, the largest K–12 augmentation is for the second–year phase in of the recently adopted Local Control Funding Formula (LCFF). The budget also includes several other school–specific augmentations—some of which relate to school operations and some of which relate to school infrastructure. In addition to these budget actions, the Legislature adopted trailer legislation relating to school district reserves and independent study (IS) programs. The budget also includes augmentations for additional staff and workload at the California Department of Education (CDE) and California School Finance Authority (CSFA). We discuss these K–12 changes below.
Operational Funding
Figure 4
Proposition 98 Spending Changes
(In Millions)
|
Revised 2013–14 Spending
|
$58,302
|
|
Technical Adjustments
|
|
|
Remove prior–year deferral payments
|
–$3,349
|
|
Remove other one–time funds
|
–468
|
|
Fund QEIA outside of Proposition 98
|
–361
|
|
Adjust energy efficiency funds
|
–112
|
|
Make other adjustments
|
11
|
|
Subtotal
|
(–$4,278)
|
|
K–12 Education
|
|
|
Fund LCFF increase for school districts
|
$4,722
|
|
Pay down deferrals (one time)
|
599
|
|
Pay down mandate backlog (one time)a
|
287
|
|
Provide additional funding for CTE pathways
|
250
|
|
Increase funding for pupil testing
|
54
|
|
Provide 0.85 percent COLA for select programsb
|
33
|
|
Fund LCFF increase for COEs
|
26
|
|
Increase FCMAT funding
|
1
|
|
Subtotal
|
($5,971)
|
|
Preschool
|
$157
|
|
California Community Colleges
|
|
|
Augment Student Success and Support program
|
$170
|
|
Fund maintenance and instructional support (one time)
|
148
|
|
Fund 2.75 percent enrollment growth
|
140
|
|
Pay down deferrals (one time)
|
63
|
|
Increase CTE funding (one time)
|
50
|
|
Pay down mandate backlog (one time)
|
50
|
|
Provide 0.85 percent COLA for apportionments
|
47
|
|
Augment funding for Disabled Students Programs and Services
|
30
|
|
Fund Internet equipment (one time) and connectivity
|
6
|
|
Fund community college technical assistance initiative
|
3
|
|
Subtotal
|
($707)
|
|
Total 2014–15 Changes
|
$2,557
|
|
2014–15 Proposition 98 Spending Level
|
$60,859
|
Provides $4.7 Billion for LCFF Implementation. The budget plan includes $4.7 billion in additional funding for the school district LCFF—resulting in per–pupil LCFF funding that is 12 percent higher than 2013–14 levels. The additional funding is sufficient to close 29 percent of the gap between districts’ 2013–14 funding levels and their target funding rates. We estimate the 2014–15 funding level is approximately 80 percent of the full implementation cost. The budget also includes $26 million for the LCFF for county offices of education (COEs). This increase is sufficient to bring all COEs up to their LCFF funding targets in 2014–15. The budget also provides a $500,000 augmentation for the Fiscal Crisis and Management Assistance Team (FCMAT), an agency that provides fiscal advice and support to school districts. Since the adoption of LCFF, FCMAT has developed and maintained an online LCFF calculator, created an LCFF Help Desk to respond to questions from districts and charter schools, and developed a new regional training program to assist districts in budget development using the LCFF calculator. The additional funding is intended to provide ongoing support for these activities.
More Funding for Career Pathways Trust. The 2013–14 budget package provided $250 million in one–time Proposition 98 funding to create a “California Career Pathways Trust.” The CDE received a total of 123 eligible applications. In May 2014, CDE announced the 39 winners of the grant competition. The 2014–15 budget provides an additional $250 million in one–time Proposition 98 funding for the program. The trailer legislation allows CDE to set aside up to 1 percent of this appropriation for planning grants or to contract with a local educational agency (LEA) to provide technical assistance to grant applicants and recipients.
Other Notable K–12 Actions. The budget provides $54 million to continue implementation of new student assessments and $33 million to provide a cost–of–living adjustment (COLA) for several K–12 programs (including special education and child nutrition programs).
Infrastructure
Allocates $189 Million for Emergency Repair Program (ERP). Chapter 899, Statutes of 2004 (SB 6, Alpert), created the ERP to fund critical repair projects at certain low–performing schools. Chapter 899 requires the state to contribute a total of $800 million for the program. The state has provided $338 million to date. The budget provides $189 million for the ERP in 2014–15 ($94 million from unspent prior–year funds, $94 million from the state’s Chapter 751 obligation discussed above, and $436,000 from the School Building Aid Fund). A $273 million obligation would remain. Funds are allocated to school districts that have unfunded claims for emergency repairs from the most recent (2008) award cycle.
Allocates $27 Million in One–Time Funds for School Internet Infrastructure. The budget includes $27 million in one–time Proposition 98 funding for schools to purchase Internet connectivity infrastructure upgrades required to administer new computer–based tests. Grantees are to be selected based on the results of a statewide assessment of schools’ Internet connectivity infrastructure to be completed by the K–12 High–Speed Network (HSN) by March 1, 2015. (The HSN is run through the Imperial COE, which has an ongoing contract with CDE to assist schools with certain technology issues.) The HSN, with the approval of the Department of Finance (DOF), may use a portion of the grant funds to conduct the statewide assessment. The HSN, with the approval of CDE and the Executive Director of the State Board of Education (SBE), also may distribute some grants to schools prior to the completion of the statewide assessment. These expedited grants are for critical projects, with priority going to schools (1) currently unable to administer computer–based assessments and (2) having the greatest number of students that would be able to take computer assessments as a result of the grant.
Shifts Remaining Bond Authority Among Certain School Facility Programs. The budget package shifts remaining bond authority from the Career Technical Education (CTE) and High Performance Incentive (HPI) school facility programs to the New Construction and Modernization facility programs. Bond authority is transferred on January 1, 2015 and split equally between the New Construction and Modernization programs. (As of June 25, 2014, the CTE and HPI programs have $4.1 million and $32.9 million, respectively, in remaining bond authority.) In addition, trailer legislation requires the Office of Public School Construction to report to the State Allocation Board and the Legislature by March 1, 2015 on efforts to streamline and speed up the award of the remaining $148 million in the Seismic Mitigation school facility program.
Local Reserves
Requires School Districts to Disclose and Justify Reserves. Chapter 32, Statutes of 2014 (SB 858, Committee on Budget and Fiscal Review), creates new disclosure requirements effective beginning in 2015–16 for districts that have reserves exceeding state–recommended minimums. (State regulations recommend minimum reserves for most school districts that range from 1 percent to 5 percent of their annual expenditures. The exact percentage depends on the size of the district, with higher requirements for smaller districts.) If a district’s budget reserve exceeds the state minimum, Chapter 32 requires the district to identify the amount of reserves that exceed the minimum and explain why the higher reserve levels are necessary. The district must disclose this information in a public meeting and each time it submits a budget to its COE. For the purpose of this requirement, “reserves” includes both “unassigned” funds set aside for unanticipated developments as well as “assigned” funds set aside for specific local purposes (such as for purchasing textbooks). Available data from 2012–13 indicate that virtually all districts maintain reserves that exceed the state–specified minimums, thereby making them subject to the new disclosure requirements.
Caps Local Reserves Some Years if Proposition 2 Passes. Proposition 2 on the November 2014 ballot sets forth new constitutional provisions relating to state reserves, including provisions relating to a new state reserve for schools. If voters approve Proposition 2, certain provisions of Chapter 32 go into effect. These provisions cap school districts’ reserve levels the year after the state makes a deposit into the new state reserve for schools. The caps for most districts will range from 3 percent to 10 percent of a district’s annual expenditures. As with the requirement for disclosing reserves, the cap applies to unassigned and assigned funds combined. Chapter 32 allows COEs to exempt school districts from the cap for up to two consecutive years if districts demonstrate that they face “extraordinary fiscal circumstances,” including undertaking multiyear infrastructure or technology projects.
Independent Study
Reduces Administrative Requirements for IS Programs. Existing IS programs allow students to earn credit for academic work they complete independently under a written learning contract. For purposes of allocating per–pupil funding, the state requires a student’s teacher to equate every assignment to an equivalent amount of classroom instructional time. Trailer legislation allows local governing boards, beginning in 2015–16, to approve entire IS courses (rather than individual assignments) as equivalent to a given amount of instructional time. The local governing board is required to certify these courses are of the same quality as classroom–based courses and meet relevant state and local academic standards. Students enrolled in these courses need to demonstrate “satisfactory academic progress,” as determined twice each month by a teacher. For funding purposes, if more than 10 percent of the students attending an individual school district, COE, or charter school participate in the new IS option, per–pupil funding for students exceeding the 10 percent threshold will be reduced by the statewide average absence rate for students in grades K–8 or 9–12, whichever is applicable. (While CDE has not yet determined how these absence rates will be calculated, we estimate the reduction at 3 percent to 6 percent of a district’s per–pupil funding.) This provision is intended to discourage LEAs from converting their entire academic program to the new IS option. Beginning in 2014–15, IS programs also are allowed to store certain student records electronically and extend written learning contracts across an entire school year rather than a single semester.
Modifies IS Student–Teacher Ratio Requirements. The state historically has required the ratio of students to teachers in a school district IS program be no greater than the districtwide average student–teacher ratio. (Slightly different rules apply to COEs and charter schools.) The trailer legislation maintains this basic approach but requires separate calculations by grade span—K–3, 4–6, 7–8, and 9–12. (For example, the ratio requirement for IS programs serving grades 9–12 is based on the districtwide average student–teacher ratio for grades 9–12.) The trailer legislation allows the ratio requirement to be waived if an alternative ratio is negotiated as part of a local collective bargaining agreement.
California Department of Education
Authorizes 22.2 New CDE Positions. Of the 22.2 new CDE positions, 12.2 positions are permanent and 10 positions are limited term. The budget includes $2.9 million for the new positions—$1.9 million state non–Proposition 98 General Fund and $1 million federal funds. The additional staff is associated with various increases in CDE workload, including: implementing LCFF and Local Control and Accountability Plan requirements, developing in–house expertise in computer–based testing, administering the second round of Career Pathways Trust grants, administering the expanded State Preschool program, and undertaking additional work related to the federal Migrant Education Program.
Provides $6.1 Million for New Information Technology (IT) Project. The budget also provides CDE with $6.1 million ($3.6 million non–Proposition 98 General Fund and $2.5 million federal funds) to fund the first year of the Standardized Account Code Structure (SACS) Replacement Project. The department uses the SACS system to collect, review, and disseminate financial data from LEAs. The project will replace four out–of–date, offline SACS interfaces with a new, integrated interface that can be accessed online. The CDE is expected to select a vendor to develop the new SACS interface and complete a Special Project Report (SPR), which will include new cost and timeline estimates, by the fall of 2014.
Provides $4.5 Million for CDE to Create Materials for Visually Impaired Students. The budget redirects $4.5 million in federal special education funds for CDE to maintain and add to its centralized clearinghouse of accessible instructional materials for students who are blind or visually impaired. (Prior to the adoption of LCFF, this activity was funded with Proposition 98 funds.) The CDE produces, stores, and loans materials based on district requests.
California School Finance Authority
Provides $167,000 for Two New Positions at CSFA. The budget provides CSFA with $167,000 in non–Proposition 98 General Fund and two additional positions for the administration of the Charter School Facility Grant Program. This augmentation increases the number of full–time staff dedicated to reviewing charter school funding applications from one to three. The additional staff is intended to address the workload associated with (1) an increase in the number of funding applications (from about 200 in 2008–09 to more than 300 in 2013–14), and (2) statutory changes enacted last session that require a larger share of funding to be allocated to schools earlier in the fiscal year as well as the final allocation to be made within one month of the close of each fiscal year.
As shown in the bottom part of Figure 4, the 2014–15 budget funds CCC enrollment growth and a COLA as well as augments funding for a number of CCC categorical programs. The budget also provides additional staff and funding for the Chancellor’s Office. In addition, the budget package (1) increases funding for specified noncredit courses beginning in 2015–16, (2) provides financial support to City College of San Francisco (CCSF), and (3) appropriates bond monies for eight capital outlay projects.
Enrollment Growth and COLA
Funds Enrollment Growth, Requires New Growth Allocation Formula, and Provides COLA. The 2014–15 budget includes $140 million to fund 2.75 percent enrollment growth equating to an additional 30,000 full–time equivalent (FTE) students. The budget package also requires the Chancellor’s Office to implement a new enrollment growth allocation formula by 2015–16. (Regulations related to the system’s allocation formula expired several years ago.) In addition, the budget provides $47 million for a 0.85 percent COLA for general purpose apportionment funding.
Categorical Programs
As detailed below, the 2014–15 budget provides $407 million in augmentations for various CCC categorical programs. Of that total, $207 million is designated for ongoing purposes and $200 million for one–time purposes.
Student Success and Support Program (SSSP). The 2014–15 budget augments funding for SSSP by $170 million (bringing total SSSP funding up to $269 million). The program provides various support services, such as academic counseling and orientation for incoming students. Of the $170 million augmentation, $100 million is for support of all students and is distributed to community colleges based on enrollment—consistent with the existing SSSP allocation method. The remaining $70 million is for districts to serve “high need” (primarily low–income) students. The Chancellor’s Office is tasked with developing a method for allocating these latter monies to districts. The intent is for districts to use these funds to provide supplemental services—beyond base services provided by regular SSSP dollars—to reduce any achievement gaps identified by colleges in their student equity plans. (The Chancellor’s Office is requiring colleges to complete their equity plans by November 2014.)
Deferred Maintenance and Instructional Support. The budget provides $148 million (one time) for the Physical Plant and Instructional Support program. This program funds facility maintenance projects as well as replacement of instructional equipment and library materials. The 2014–15 budget deviates from the historic practices of (1) splitting the categorical funds evenly between maintenance and instructional equipment/materials and (2) requiring a local match. Instead, districts can decide for themselves how much they spend for each purpose and do not need to provide local matching funds.
CTE. The budget provides a $50 million increase (one time) for the Economic Development program (bringing total 2014–15 funding for the program to $73 million). The funds are provided for various CTE–related purposes, including purchasing instructional equipment and developing curriculum. Provisional language specifies that funds are to be allocated on a formula basis to existing regional consortia of CCC districts. Districts within each region must develop a plan for spending the funds. In addition, the Legislature adopted supplemental language requiring the Chancellor’s Office to report to the Legislature by March 1, 2015 on how districts spent their funds. The report is to include recommendations for (1) measuring student outcomes associated with this funding as well as (2) providing “appropriate funding levels” for CTE moving forward.
Disabled Students Programs and Services. The 2014–15 Budget Act includes a $30 million increase for programs that provide support services and educational accommodations to CCC students with disabilities. This augmentation brings total funding for the program up to $114 million.
Telecommunications and Technology Services. The budget augments by $6 million the Telecommunications and Technology Services program (bringing total 2014–15 funding up to $22 million). Of the $6 million, $1.4 million is one–time funding for community colleges to replace outdated routers and other networking–related equipment and $4.6 million is ongoing funding to operate primary and backup internet connections at every campus.
New Technical Assistance Initiative. The budget provides $2.5 million for technical assistance to CCCs in the areas of academic affairs, student services, CTE, and finance. Under the new initiative, colleges can request assistance directly or the Chancellor’s Office can initiate intervention. If colleges ask for assistance, they are required to provide a local match ($1 for every $2 in state support). If the Chancellor’s Office initiates intervention, no local match is required. In either case, the intent is for the Chancellor’s Office to contract with teams of community college experts (such as leading faculty) to consult with colleges in need of help. Beginning in 2015–16, the Chancellor’s Office must provide an annual report to the Joint Legislative Budget Committee (JLBC) and DOF on prior–year use of funds.
Chancellor’s Office
Funds Nine New Positions for Technical Assistance Initiative. The 2014–15 budget provides a $1.1 million (non–Proposition 98 General Fund) augmentation to add nine permanent positions at the Chancellor’s Office in support of the new technical assistance initiative discussed above. Specifically:
- Four positions are charged with (1) developing new performance measures for districts and colleges in the areas of academic affairs, student services, CTE, and finance; and (2) identifying and disseminating best practices.
- Two positions are to assist districts and colleges with improving their performance in areas such as transfer education and student support services.
- Three positions are assigned to the Technology, Research, and Information Systems Division to: (1) provide data in support of the above positions, (2) help develop systemwide and college–level performance goals, and (3) handle the logistics of assembling technical assistance teams.
Funds for Moving–Related Costs. The budget provides $500,000 (non–Proposition 98 General Fund) to cover Chancellor’s Office moving costs. In 2014–15, the Chancellor’s Office plans to consolidate space and move all personnel to a different floor in the same office building in Sacramento. The move is intended to result in future savings. At least 30 days prior to releasing the $500,000, DOF must report to the JLBC on the specific cost components of the move.
Noncredit Instruction
Increases Funding for Certain Noncredit Courses to Credit Rate Beginning in 2015–16. Historically, the state has provided one funding rate for credit instruction and two lower funding rates for noncredit instruction. Of the two noncredit rates, community colleges receive more for noncredit “career development and college preparation” (CDCP) courses that lead to noncredit certificates (such as a certificate of completion in medical assisting). Regular noncredit instruction, which includes courses such as home economics and parenting, receives the lower of the two noncredit rates. Trailer legislation increases the funding rate for CDCP instruction to the credit rate beginning in 2015–16 (at an annual cost of about $50 million). The legislation requires the Legislative Analyst’s Office (LAO) to report to the Legislature by March 1, 2017 on the effect of this funding change. The report is to include data on the extent to which community colleges respond to the higher rate by offering more CDCP courses.
City College of San Francisco
Accreditation Issues Lead to Declining Enrollment at CCSF. In 2013–14, CCSF enrollment declined by about 6,500 FTE students (falling about 20 percent short of its enrollment target). As a result, CCSF received $29 million in “stability” funding. (See the nearby box for a detailed explanation of stability funding.) This precipitous enrollment decline followed the decision last year by the Accrediting Commission for Community and Junior Colleges (ACCJC) to terminate the college’s accreditation effective July 2014. (The ACCJC has since indicated that it will consider maintaining CCSF’s accreditation status for up to two years while the college implements a comprehensive improvement plan.)
State Provides Some Districts With “Stability Funding”
State law allows a district that fails to meet its enrollment target to keep enrollment funding for unfilled slots for that year. This is known as stability funding. In the following year, districts lose from their base budget any funding associated with slots that remain unfilled. Although individual districts lose funding in these cases, the same amount of funding remains in the community college system’s base budget for three years. Statute allows districts to “restore” their enrollment funding base if they can regain lost enrollment within that three–year period. At the end of each year, any of this funding not used for restoration is available to the system for one–time purposes, such as covering shortfalls in local property tax or student fee revenues.
Budget Conditionally Provides CCSF With Three Extra Years of Stability Funding. Trailer legislation includes language intended to mitigate the amount of funding CCSF loses as a result of this enrollment decline. Specifically, to the extent CCSF’s enrollment in 2014–15 fails to grow back to its 2012–13 level (and the college maintains its accreditation status), the college will receive a second year of full stability funding. In addition, the trailer legislation would provide 95 percent of stability funding in 2015–16 and 90 percent of stability funding in 2016–17. (Stability funds in 2016–17 are conditioned on FCMAT making several determinations beforehand, including ensuring that “effective fiscal controls and systems are in place” at CCSF and that the college is maintaining “appropriate fiscal reserves.”) The trailer legislation requires that CCSF submit to the Legislature, LAO, Governor, and DOF regular updates on its accreditation status, enrollment, and fiscal condition. The first report is due April 15, 2015.
CCC Capital Outlay
Provides Bond Funding for Eight CCC Capital Outlay Projects. The 2014–15 budget appropriates a total of $21 million in general obligation bond funding for one continuing CCC project and seven new CCC projects. Future state costs for these projects are expected to total an additional $102 million. (In addition, community colleges are expected to contribute $21 million in local funds over the life of these projects.) The eight projects include renovations to the Solano College theater building (construction phase) and preliminary plans and working drawings for the following projects: (1) renovations to a building at Citrus College, (2) replacement of utility infrastructure at the College of the Redwoods’ Eureka campus, (3) a new instructional building at the El Camino College Compton Center, (4) a new fire alarm system at Mt. San Jacinto College, (5) upgrades to a tower at Rio Hondo College, (6) a new building to accommodate enrollment growth at the Sacramento City College Davis Center, and (7) a new campus center at Santa Barbara City College.
Budget Act Provides $2.4 Billion for Child Care and Preschool Programs. As shown in Figure 5, the 2014–15 budget includes $1.8 billion and $664 million for child care and preschool programs, respectively. This is a total of $281 million (13 percent) more than the revised 2013–14 funding level. Most of the increase is covered by higher Proposition 98 and non–Proposition 98 General Fund support, with federal funds increasing $37 million.
Figure 5
Child Care and Preschool Budget
(Dollars in Millions)
|
|
2012–13
Actual
|
2013–14
Reviseda
|
2014–15
Budget Act
|
Change From 2013–14
|
|
Amount
|
Percent
|
|
Child Care
|
|
|
|
|
|
|
CalWORKs Child Care
|
|
|
|
|
|
|
Stage 1
|
$289
|
$337
|
$372
|
$35
|
10%
|
|
Stage 2b
|
419
|
367
|
355
|
–13
|
–3
|
|
Stage 3
|
162
|
202
|
220
|
18
|
9
|
|
Subtotals
|
($870)
|
($906)
|
($946)
|
($40)
|
(4%)
|
|
Non–CalWORKs Child Care
|
|
|
|
|
|
|
General child care
|
$465
|
$464
|
$544
|
$80
|
17%
|
|
Alternative payment
|
174
|
177
|
182
|
5
|
3
|
|
Other child care
|
28
|
28
|
29
|
1
|
4
|
|
Subtotals
|
($666)
|
($669)
|
($755)
|
($86)
|
(13%)
|
|
Support Programs
|
$76
|
$74
|
$73
|
–$2
|
–2%
|
|
Totals
|
$1,612
|
$1,650
|
$1,774
|
$124
|
8%
|
|
State non–Proposition 98 General Fund
|
$765
|
$763
|
$850
|
$87
|
11%
|
|
Other state funds
|
14
|
—
|
—
|
—
|
—
|
|
Federal CCDF
|
549
|
556
|
570
|
14
|
2
|
|
Federal TANF
|
285
|
330
|
353
|
23
|
7
|
|
State Preschool (Proposition 98)
|
$481
|
$507
|
$664
|
$157
|
31%
|
Higher Spending Almost Entirely Attributable to Program Augmentations. Programmatic augmentations account for $255 million of the year–to–year increase, with caseload and statutory growth adjustments comprising the remainder of the increase. As shown in Figure 6, the largest programmatic augmentations are for the State Preschool program. We discuss these augmentations and caseload adjustments in greater detail below.
Figure 6
Major 2014–15 Child Care and Preschool Spending Changes
(In Millions)
|
Change
|
Amount
|
|
Provide 7,500 additional full–year, full–day State Preschool slotsa
|
$70
|
|
Provide QRIS grants for State Preschool
|
50
|
|
Increase the SRR by 5 percent
|
49
|
|
Caseload adjustmentsb
|
26
|
|
Fund quality improvement activities (one time)
|
25
|
|
Increase the RMR by 9 percentc
|
19
|
|
Repeal part–day State Preschool fees and backfill foregone revenue
|
15
|
|
Provide 1,000 additional General Child Care slots
|
13
|
|
Provide additional facilities loans for State Preschool
|
10
|
|
Provide 500 additional Alternative Payment Program slots
|
4
|
|
Totals
|
$281
|
Legislature Expands State Preschool Program. Budget trailer legislation—Chapter 32, Statutes of 2014 (SB 858, Committee on Budget and Fiscal Review)—states legislative intent to provide preschool opportunities for all low–income children. For 2014–15, the budget package provides $67 million to add 7,500 full–day, full–year State Preschool slots, bringing the total number of State Preschool slots to almost 150,000. Of this augmentation, $29 million (Proposition 98 General Fund) covers the cost of the additional slots for the part–day program. The remaining $38 million (non–Proposition 98 General Fund) is provided through the General Child Care program that covers the cost of the remainder of the full–day program as well as additional days of care. (The part–day State Preschool program operates a minimum of 3 hours per day for 175 days each year. The additional 7,500 slots support a minimum of 6.5 hours of care per day for no fewer than 245 days each year.) In addition to the 7,500 new slots, $3 million is provided for 4,000 more full–day State Preschool slots beginning June 15, 2015.
Three Other Changes to State Preschool Program. The budget provides $25 million (Proposition 98 General Fund) to increase the Standard Reimbursement Rate (SRR) for State Preschool by 5 percent, bringing the part–day State Preschool rate to almost $3,900 annually. In addition, trailer legislation repeals family fees for the part–day State Preschool program, and the budget provides $15 million (Proposition 98 General Fund) to backfill the foregone revenue. Lastly, the budget provides $10 million (Proposition 98 General Fund) for loans to LEAs to renovate existing preschool facilities or purchase new relocatable preschool facilities.
Budget Provides Funding for Quality Initiatives. The budget dedicates $50 million ongoing Proposition 98 General Fund for local Quality Rating and Improvement Systems (QRIS) designed to improve the quality of State Preschool. To date, local QRIS activities—which evaluate the quality of child care and preschool programs based on teacher qualifications, curriculum, and other metrics—have been supported by local and federal resources. The new state–supported QRIS grants build upon these existing efforts by funding additional professional development and stipends. Local consortia can apply for the new QRIS grants and locally determine how to distribute the funding to preschool providers within their area. The budget provides an additional $25 million one–time Proposition 98 General Fund for professional development and stipends for transitional kindergarten and State Preschool teachers.
Other Child Care Programs Receive Modest Increases. The budget package increases reimbursement rates for all other child care programs. The SRR for General Child Care increases by 5 percent (costing $24 million non–Proposition 98 General Fund). The Regional Market Rate (RMR), used for California Work Opportunity and Responsibility to Kids (CalWORKs) child care and the Alternative Payment Program, increases its cap to the 85th percentile of the 2009 regional market survey reduced by just over 10 percent (costing $19 million non–Proposition 98 General Fund). The RMR increases go into effect starting January 1, 2015. (In 2013–14, the RMR cap was set at the 85th percentile of the 2005 regional market survey.) The budget also provides $17 million (non–Proposition 98 General Fund) to provide 1,000 additional General Child Care slots and 500 additional Alternative Payment Program slots.
CalWORKs Child Care Caseload Increases Slightly. Overall, CalWORKs child care caseload increases by almost 5,000 slots, primarily due to more families projected to participate in welfare–to–work activities and projected to use Stage 1 child care. In conjunction with the increase to the RMR (described above) and higher cost of care per child, spending for the CalWORKs child care program increases by $40 million in 2014–15. Per–child costs rose from 2012–13 to 2013–14 due to more families choosing licensed child care settings, which is reimbursed at a higher rate than license–exempt care provided by family, friends, and neighbors. Given families’ improved economic conditions, the state expects this trend to continue in 2014–15.
Large General Fund Increase, Smaller Overall Increase. The budget provides a total of $19.8 billion in support for higher education in 2014–15—a $1.1 billion (6 percent) increase from 2013–14. Of this amount, $12.6 billion is from the state General Fund, $3.9 billion is tuition and fee revenue, $2.3 billion is local property tax revenue, and $1 billion comes from other sources. As Figure 7 shows, General Fund support increases $1.2 billion (11 percent) from 2013–14. Of this amount, $257 million is associated with fund swaps whereas $980 million reflects program augmentations. Tuition and fee revenue remains flat over the period. Local property tax revenue for the community colleges is expected to increase by $141 million (7 percent). Funding from other sources declines notably, with a $164 million reduction in federal Temporary Assistance for Needy Families (TANF) funds and a $98 million reduction in Student Loan Operating Fund (SLOF) support. In recent years, both TANF and SLOF monies have offset a portion of Cal Grant costs.
Figure 7
Higher Education Core Funding
(Dollars in Millions)
|
|
2012–13
Revised
|
2013–14
Revised
|
2014–15
Enacted
|
Change From 2013–14
|
|
Amount
|
Percent
|
|
University of California
|
|
|
|
|
|
|
General Funda
|
$2,566
|
$2,844
|
$2,991
|
$146
|
5%
|
|
Net tuitionb
|
2,525
|
2,605
|
2,651
|
46
|
2
|
|
Other UC core fundsc
|
351
|
344
|
331
|
–13
|
–4
|
|
Lottery
|
30
|
38
|
38
|
—
|
—
|
|
Subtotals
|
($5,471)
|
($5,831)
|
($6,010)
|
($179)
|
(3%)
|
|
California State University
|
|
General Funda
|
$2,473
|
$2,789
|
$2,966
|
$177
|
6%
|
|
Net tuitionb
|
2,009
|
2,014
|
2,055
|
41
|
2
|
|
Lottery
|
40
|
56
|
57
|
1
|
2
|
|
Subtotals
|
($4,522)
|
($4,859)
|
($5,078)
|
($219)
|
(5%)
|
|
California Community Colleges
|
|
General Funda
|
$4,219
|
$4,576
|
$4,732
|
$156
|
3%
|
|
Local property tax
|
2,264
|
2,167
|
2,309
|
141
|
7
|
|
Fees
|
425
|
410
|
423
|
13
|
3
|
|
Lottery
|
157
|
182
|
182
|
—
|
—
|
|
Subtotals
|
($7,065)
|
($7,335)
|
($7,645)
|
($310)
|
(4%)
|
|
Hastings College of the Law
|
|
Net tuitionb
|
$33
|
$33
|
$30
|
–$2
|
–7%
|
|
General Funda
|
9
|
10
|
11
|
1
|
12
|
|
Subtotalsd
|
($42)
|
($42)
|
($41)
|
(–$1)
|
(–3%)
|
|
California Student Aid Commission
|
|
General Fund
|
$671
|
$1,056
|
$1,585
|
$529
|
50%
|
|
SLOF
|
85
|
98
|
—
|
–98
|
–100
|
|
TANF funds
|
804
|
542
|
377
|
–164
|
–30
|
|
Other
|
29
|
30
|
36
|
6
|
19
|
|
Subtotals
|
($1,589)
|
($1,726)
|
($1,998)
|
($272)
|
(16%)
|
|
California Institute for Regenerative Medicine
|
|
General Funda
|
$53
|
$99
|
$277
|
$177
|
179%
|
|
Awards for Innovation in Higher Education
|
|
General Fund
|
—
|
—
|
$50
|
$50
|
N/A
|
|
Totalse
|
$17,686
|
$18,722
|
$19,835
|
$1,113
|
6%
|
|
General Fund
|
$9,991
|
$11,374
|
$12,611
|
$1,237
|
11%
|
|
Net tuition/feese
|
3,936
|
3,892
|
3,895
|
3
|
—
|
|
Local property tax
|
2,264
|
2,167
|
2,309
|
141
|
7
|
|
Other
|
1,269
|
1,014
|
744
|
–270
|
–27
|
|
Lottery
|
228
|
275
|
276
|
1
|
—
|
Below, we describe 2014–15 funding for the University of California (UC), Hastings College of the Law (Hastings), and California State University (CSU). (See the “Community Colleges” section of this report for budget information on CCC.) We then describe the new Awards for Innovation in Higher Education as well as major changes in financial aid funding.
UC, CSU, and Hastings
Continues Main Aspects of Governor’s Multiyear Funding Planfor UC, CSU, and Hastings. The 2014–15 budget effectively funds the second–year of the Governor’s four–year funding plan for the universities. Specifically, the budget provides General Fund base increases for each segment that are almost entirely unallocated—giving the segments broad discretion over how to spend the funds. The budget implicitly assumes no tuition increases for California students, as all three segments indicate their intent to continue a tuition freeze in exchange for the base budget increases. The budget sets no enrollment expectations and includes no funding specifically designated for enrollment growth. As discussed in the nearby box, the budget includes a new requirement for UC and CSU (but not Hastings) to adopt annual “sustainability plans.” These were proposed by the Governor in an effort to encourage the universities to adopt internal budget plans consistent with the state’s multiyear funding plan.
Sustainability Plans for UC and CSU
Requires University of California (UC) and California State University (CSU) to Adopt Plans Based on Governor’s Multiyear Funding Assumptions. Provisional budget language requires the UC and CSU governing boards to adopt three–year sustainability plans by November 30, 2014. The universities are required to project their expenditures for each year from 2015–16 through 2017–18 and describe changes needed to ensure expenditures do not exceed available resources. The universities are to use General Fund and tuition assumptions provided by the Department of Finance (DOF) in estimating available resources. In addition, the segments are required to project resident and nonresident enrollment for each of the three years and set targets for each of the performance measures approved as part of the 2013–14 budget package. These measures relate to enrollment, student progress, graduation, degrees awarded, funding per degree, and efficiency, with several of the measures disaggregated for undergraduate and graduate students; transfer students; low–income students; and students in science, technology, engineering, and mathematics disciplines. Budget trailer legislation also calls for the appropriate legislative committees to review these measures in collaboration with DOF, the Legislative Analyst’s Office, the segments, and higher education experts, and consider any recommended modifications.
Provides $3 Billion in General Fund Support for UC. This is an increase of $146 million (5 percent) from 2013–14. Of this increase, $142 million is ongoing and the remaining $4 million is one time. Though most of UC’s General Fund support is unallocated, the budget designates a small portion for defined purposes. Specifically, it earmarks (1) $4 million ($2 million ongoing and $2 million one time) to support two UC centers on labor research and education, (2) $2 million (one time) to support a new brain research program, and (3) $677,000 (ongoing) for an elections database housed at the Berkeley campus. Besides its state support, UC expects to receive $2.7 billion in student tuition payments. (The Cal Grant program will pay about $800 million of this amount on behalf of students.)
Provides $3 Billion in General Fund Support for CSU. This is an increase of $177 million (6 percent) from 2013–14. This includes an unallocated increase of $142 million, $35 million in adjustments relating to existing debt–service costs and benefit rate changes for employees and retirees, and $442,000 for the Center for California Studies to increase stipends in the Assembly, Senate, Executive, and Judicial Fellows programs. The budget also shifts $189 million in general obligation bond debt–service from a separate budget item to CSU’s main support appropriation, as discussed below. Besides its General Fund support, CSU expects to receive about $1.9 billion in student tuition payments. (The Cal Grant program will pay about $460 million of this amount on behalf of students.)
Places Moratorium on CSU Student Success Fees. Trailer legislation imposes an 18–month moratorium on new student success fees. Student success fees are campus–based fees used for academic enhancements and other strategies to improve students’ college experience. Twelve campuses have imposed such fees, ranging from $162 to $780 annually. The trailer legislation requires the CSU Chancellor to review the Board of Trustees’ policy related to these fees and report recommended changes to DOF and the Legislature by February 1, 2015.
Provides $11 Million in General Fund Support for Hastings. This is an increase of $1.2 million (12 percent) from 2013–14. Hastings has discretion in deciding how to use all of this increase. In addition to state support, Hastings expects to receive $30 million in student tuition payments—$2.3 million (7 percent) less than in 2013–14. The lower expected tuition revenues are attributable to Hastings’ plan to reduce student enrollment by 77 FTE students in 2014–15.
Adds Control Section 6.10 to Budget. The Legislature added a control section to the budget that was not part of the Governor’s higher education plan. Specifically, Control Section 6.10 authorizes an additional $50 million (General Fund) on a one–time basis for each UC and CSU to spend on deferred maintenance or any other one–time purpose in the event that preliminary estimates of certain tax revenues are higher than anticipated. In a July 16, 2014 letter, DOF determined that the revenue condition had not been met and the additional spending would not be triggered. Later changes in property tax estimates will not affect this action. (The department’s determination affects several other state agencies, including the state special schools for students with disabilities.)
Capital Outlay
Authorizes UC to Fund 11 Capital Outlay Projects From Support Appropriation. As part of a new process adopted last year, the state granted UC authorization to fund 11 capital outlay projects from its support appropriation starting in 2014–15. (This process is similar to the new capital outlay process adopted this year for CSU, as described below.) Total state costs for the projects are $278 million, with future state costs for subsequent project phases expected to be an additional $34 million. In addition to state funding, the university is expected to provide $78 million toward the projects from non–state sources. The 11 projects include: (1) campus infrastructure expansions at Merced, (2) equipment for a new business school building at Irvine, (3) a new coastal biology research building at Santa Cruz, (4) seismic repairs and space reconfigurations for a classroom building at Davis, (5) campus infrastructure improvements at Santa Barbara, (6) campus infrastructure and fire safety upgrades at San Diego, (7) campus fire and life safety improvements at Santa Cruz, (8) seismic and fire safety upgrades at a chemistry building at Davis, (9) new research and meeting space at the Intermountain Research Center, (10) new electrical system components at Irvine, and (11) a replacement building at Berkeley to address seismic concerns with an existing building.
Authorizes New Capital Outlay Process for CSU. The budget shifts funds for existing debt service on CSU capital outlay projects from a separate budget item to the university’s main support appropriation. It does this as part of a new capital outlay process, similar to one adopted for UC in 2013. Under the new process, CSU may pledge its General Fund support appropriation (excluding the amounts necessary to repay existing debt service) to issue its own debt for capital outlay projects involving academic facilities. In addition, the new process allows CSU to restructure some of the state’s outstanding debt on CSU projects. The new process limits the university to spending, at most, 12 percent of its General Fund appropriation on (1) debt service on new bonds for academic facilities and (2) pay–as–you–go academic facility projects. (The 12 percent cap excludes amounts needed to fund state–authorized general obligation and lease revenue bond payments.) In order to use the new authority, the university is required to submit certain information about its capital plans to the Legislature for review and to DOF for approval.
Funds a Few CSU Capital Outlay Projects. The budget also authorizes $5.8 million in equipment purchases for three previously approved capital outlay projects at CSU. The projects will equip academic buildings at Chico, East Bay, and Monterey Bay.
Awards for Innovation
Funds $50 Million in One–Time Innovation Awards. The budget provides $50 million in one–time funding to promote innovative models of higher education at UC, CSU, and CCC campuses. Campuses with initiatives to increase the number of bachelor’s degrees awarded, improve four–year completion rates, or ease transfer across segments can apply for awards. A new committee of seven members—five Governor’s appointees representing DOF, the three segments, and SBE as well as two legislative appointees selected by the Speaker of the Assembly and the Senate Rules Committee—will make award decisions. The committee will accept applications through January 9, 2015. Successful applicants will be required to report on the effectiveness of their initiatives by January 1, 2018 and January 1, 2020.
Financial Aid
Provides $1.6 Billion in General Fund Support for Financial Aid. The spending plan provides a total of $2 billion for student financial aid. Of this amount, $1.6 billion is from the General Fund and $377 million is federal TANF funding. Overall financial aid spending increases $272 million (16 percent) from 2013–14 to 2014–15. Though General Fund spending increases by $529 million, half of this increase offsets a reduction in other funding. Of the funds provided, the vast majority is for Cal Grants, with the remainder for first–year implementation of the Middle Class Scholarship Program approved in 2013 as well as loan assumption programs, specialized grant programs, and outreach. The budget includes three Cal Grant expansions. In addition, trailer legislation makes one change to Cal Grant eligibility rules for schools, as described in the nearby box. The main components of the budget package are discussed below.
Cal Grant Eligibility Standards for Colleges
Maximum Default Rate, Minimum Graduation Rate. Budget legislation in 2011 and 2012 set new institutional eligibility standards for Cal Grant programs. Under these standards, a college must maintain a student loan default rate below 15.5 percent and a graduation rate above 30 percent to participate in Cal Grant programs. The default rate measures the share of students from each college defaulting on federal student loans in the first three years of their repayment period. The graduation rate reflects the share of students graduating within 150 percent of their program length. This is three years for a typical associate degree program and six years for a typical bachelor’s degree program.
Exceptions. The eligibility standards apply only to colleges with 40 percent or more of their undergraduates borrowing federal student loans (effectively exempting all community colleges). In addition, 2012 legislation created a temporary exception, permitting a college with a graduation rate between 20 percent and 30 percent to remain eligible for Cal Grants through 2016–17 if its default rate is below 10 percent.
2014–15 Budget Package Adjusts Exception. Budget trailer legislation adjusts the latter exception. Under the new language, a college with a graduation rate between 20 percent and 30 percent must have a default rate below 15.5 percent (instead of 10 percent, as originally required). Colleges meeting these criteria may remain eligible for Cal Grant programs through 2016–17. Based on currently available information, this change appears to affect only one institution—California State University, Dominguez Hills. The campus believes it is experiencing poor student outcomes due to admissions decisions it made several years ago. Campus leaders have since improved admission and student support practices and expect to be able to meet the regular eligibility standards—a default rate below 15.5 percent and a graduation rate above 30 percent—by 2017–18.
Fully Funds Cal Grants, Expands Renewal Eligibility, and Increases Some Award Amounts. The budget increases Cal Grant support by $166 million (10 percent) from 2013–14 to 2014–15 (bringing total Cal Grant funding to $1.8 billion). The augmentation includes:
- $111 million to reflect increased participation in Cal Grant programs. Much of this growth is related to a large (18 percent) increase in new awards in 2013–14, resulting in larger Cal Grant cohorts moving forward. Some of the remaining growth is related to the continued phase in of the Dream Act, which provides grants to certain nonresident students and undocumented students.
- $30 million to increase the Cal Grant B access award from $1,473 to $1,648 per year. This award helps the lowest–income Cal Grant recipients with costs other than tuition.
- $16 million to permit recipients who lose eligibility due to a temporary income gain to regain eligibility if their income subsequently drops below the income cap.
- $9 million (one time) to delay a reduction in the maximum award for students at private colleges accredited by the Western Association of Schools and Colleges. The 2012–13 budget scheduled a reduction in the maximum award for these students from the 2013–14 level of $9,084 to $8,056 in 2014–15. Under the current budget package, this reduction is delayed until 2015–16.
Provides $107 Million for First Year of Middle Class Scholarships. The budget package provides first–year funding for the Middle Class Scholarship Program, a financial aid program created last year for certain UC and CSU students. The program is designed for undergraduate students who do not have at least 40 percent of their tuition covered by Cal Grants and other public financial aid programs. Specifically, students with family incomes up to $100,000 will qualify to have up to 40 percent of their tuition covered (when combined with all other public financial aid). The percent of tuition covered declines for students with family income between $100,000 and $150,000, such that a student with a family income of $150,000 will qualify to have up to 10 percent of tuition covered. The program will be phased in over four years. For 2014–15, maximum awards for students with family incomes of up to $100,000 are set at 14 percent of tuition, then 20 percent, 30 percent, and 40 percent the following three years, respectively. Budget legislation provides $107 million for the program in 2014–15, $152 million in 2015–16, and $228 million in 2016–17, with funding for the program capped at $305 million beginning in 2017–18. If the appropriation is insufficient to provide full awards to all eligible applicants, the California Student Aid Commission (CSAC) is to reduce award amounts proportionately. Based on fall 2014 participation, no reduction in award amounts is necessary for 2014–15.
Creates Reimbursement Mechanism for Data Sharing. The budget provides $52,000 in reimbursement authority so that CSAC can recover the costs of providing data on Cal Grants and other financial aid programs to external researchers and analysts. This will enable CSAC to fulfill approved data requests that could result in valuable information about the effectiveness of CSAC programs.
General Fund Support Up for Local Libraries, Down for State Operations. The 2014–15 budget provides the California State Library (State Library) $27 million in state General Fund support. Of this amount, $16 million is for state operations and $11 million is for assistance to local libraries. General Fund support for state operations decreases by $3.5 million (18 percent) from 2013–14, primarily due to expiring one–time funds previously used for relocating the State Library. General Fund support for local assistance increases by $6.3 million from 2013–14 (more than doubling state funding). As discussed below, the increased state funding for local libraries is designated for Internet connectivity, interlibrary loan programs, and literacy programs.
Provides $3.3 Million to Improve Local Library Internet Connectivity. The budget includes $3.3 million (General Fund) for the State Library to create a new program to increase Internet speeds at local libraries. Of this amount, $1 million is provided on a one–time basis for grants to local libraries to purchase networking equipment (such as routers). The remainder is provided on an ongoing basis to cover a portion of the annual contract costs associated with local libraries accessing a statewide, high–speed Internet network. The State Library indicates it likely will enter into a contract with the Corporation for Education Network Initiatives in California (CENIC)—a nonprofit organization that provides Internet–related services to the four segments of California’s public education system as well as to several private and out–of–state education and research entities. The annual cost of the CENIC contract is expected to be $4.5 million (double the statewide appropriation). The remainder of funding needed to cover CENIC’s annual contract costs is expected to come from the California Teleconnect Fund (CTF). This state special fund, operated by the California Public Utilities Commission, provides certain organizations, including libraries, with a 50 percent discount on telecommunication and Internet services. The State Library indicates that, if it were to enter into a contract with CENIC, CENIC would seek reimbursement from the CTF to cover remaining contract costs.
Provides $2 Million for Interlibrary Loan Programs. The budget includes $2 million in one–time General Fund to support interlibrary loan programs at local libraries. Interlibrary loans allow a member of one public library to borrow books from another public library. Traditionally, the state provided funding for the costs (such as shipping) associated with interlibrary loans. In 2011–12, however, the state eliminated the entire $10 million in state funding for the program. Since that time, virtually all libraries have continued providing the service using local funds. The State Library indicates the additional state funding provided in 2014–15 would offset these local costs. State funding would be provided to libraries proportionately based on how much state funding they historically received.
Augments Funding for Library Literacy Programs by $1 Million. The budget increases state General Fund support for local library literacy programs by $1 million on a one–time basis. This brings total General Fund spending for this purpose to $3.8 million in 2014–15. (In 2012–13, local libraries contributed $15 million in local funding for literacy programs.) The additional state funding will be used to expand and enhance local literacy programs. For example, local libraries may use the funding to train more volunteers to provide additional one–on–one literacy tutoring services to adults in their communities during the coming year. Currently, about half of local libraries operate state–funded literacy programs.
The California State Teachers’ Retirement System (CalSTRS) administers pension and other retirement programs for its 868,000 members. CalSTRS members are current, former, and retired teachers and administrators, as well as their beneficiaries. These programs include the defined benefit (DB) program—the primary pension benefit for CalSTRS members—and the Supplemental Benefits Maintenance Account (SBMA), a program that protects the purchasing power of retirees’ benefits from the effects of inflation. The budget provides $1.5 billion in state contributions to CalSTRS. Most of this total ($904 million) is for DB program contributions, with the remainder ($582 million) for the SBMA. Of the DB program contributions, $59 million represents the state’s costs in the first year of a long–term funding plan aimed at erasing the unfunded liability in the program.
Budget Marks First Year of 32–Year Funding Plan
Plan to Fully Fund Pension Program. CalSTRS has not been appropriately funded for most of its history. During the dot–com bubble, the state reduced its contribution to the DB program and increased member benefits. During the 2000s, the system recorded large investment loses. These factors produced a $74 billion unfunded liability in the DB program as of the end of 2012–13. (An unfunded liability is the amount of pension benefits that have been earned by members but are not funded by assets on hand.) Chapter 47, Statutes of 2014 (AB 1469, Bonta), aims to erase the unfunded liability within 32 years by increasing CalSTRS contributions from the state, districts, and teachers.
Responsibility Shared Between State, Districts, and Teachers. Under prior law, districts and teachers funded roughly 75 percent of DB program contributions, with the remaining contributions funded by the state. For example, in 2012–13 employees contributed $2.3 billion, districts contributed $2.3 billion, and the state contributed $1.4 billion. Under the funding plan, these three groups will face higher contributions to fully fund the system. Specifically, the state will pay for unfunded liabilities associated with the benefit structure that was in place as of 1990. This means that the state is responsible for about $20 billion of the unfunded liability. In exchange for “vesting”—or guaranteeing—a benefit that adjusts teachers’ pensions in retirement, teachers will pay about $8 billion of the unfunded liability. (We discuss this exchange in more detail below.) Finally, districts will be responsible for the remaining $47 billion. State and teacher contributions will be ramped up over three years, while district contributions will be ramped up over seven years. For the first time, the funding plan provides CalSTRS with authority to adjust certain state and district contributions when experience deviates from actuarial assumptions.
Districts Pay About 70 Percent of Increased Costs. Figure 8 displays CalSTRS’ projections of increased contributions above previous law. (These projections incorporate various assumptions, including CalSTRS’ assumptions concerning future district payroll increases.) As shown in the figure, district rates will more than double over the seven year ramp–up period—from 8.25 percent of payroll under previous law to 19.1 percent in 2020–21. Districts will pay 71 percent of the estimated costs of the funding plan. The budget package makes no adjustment to Proposition 98 related to the additional funding responsibility for districts.
Figure 8
Projected CalSTRS Contributions Under Funding Plan
(Dollars in Millions)
|
|
2014–15
|
2015–16
|
2016–17
|
2017–18
|
2018–19
|
2019–20
|
2020–21
|
|
Districts
|
|
Old rate
|
8.25%
|
8.25%
|
8.25%
|
8.25%
|
8.25%
|
8.25%
|
8.25%
|
|
Increase
|
0.63
|
2.48
|
4.33
|
6.18
|
8.03
|
9.88
|
10.85
|
|
New Rate
|
8.88%
|
10.73%
|
12.58%
|
14.43%
|
16.28%
|
18.13%
|
19.10%
|
|
Increased Contribution, All Districts Combined
|
$175
|
$714
|
$1,293
|
$1,915
|
$2,580
|
$3,293
|
$3,751
|
|
State
|
|
Old rate
|
3.29%
|
3.52%
|
3.52%
|
3.52%
|
3.52%
|
3.52%
|
3.52%
|
|
Increase
|
0.16
|
1.37
|
2.81
|
2.81
|
2.81
|
2.81
|
2.81
|
|
New Rate
|
3.45%
|
4.89%
|
6.33%
|
6.33%
|
6.33%
|
6.33%
|
6.33%
|
|
Increased Contributiona
|
$59
|
$384
|
$783
|
$812
|
$842
|
$874
|
$906
|
|
Teachers Hired Prior to January 1, 2013
|
|
Old rate
|
8.00%
|
8.00%
|
8.00%
|
8.00%
|
8.00%
|
8.00%
|
8.00%
|
|
Increase
|
0.15
|
1.20
|
2.25
|
2.25
|
2.25
|
2.25
|
2.25
|
|
New Rate
|
8.15%
|
9.20%
|
10.25%
|
10.25%
|
10.25%
|
10.25%
|
10.25%
|
|
Increased Contribution, All Teachers Combined
|
$39
|
$314
|
$592
|
$594
|
$595
|
$595
|
$594
|
|
Teachers Hired After January 1, 2013
|
|
Old rate
|
8.00%
|
8.00%
|
8.00%
|
8.00%
|
8.00%
|
8.00%
|
8.00%
|
|
Increase
|
0.15
|
0.56
|
1.21
|
1.21
|
1.21
|
1.21
|
1.21
|
|
New Rate
|
8.15%
|
8.56%
|
9.21%
|
9.21%
|
9.21%
|
9.21%
|
9.21%
|
|
Increased Contribution, All Teachers Combined
|
$3
|
$15
|
$43
|
$55
|
$69
|
$83
|
$98
|
|
Grand Total, Projected Contributions
|
$276
|
$1,427
|
$2,711
|
$3,376
|
$4,086
|
$4,845
|
$5,349
|
State Pays About 20 Percent of Increased Costs. Over three years, the state’s rate will increase from 3.29 percent under previous law to 6.33 percent in 2016–17. (These rates are for the DB program alone—if the state’s 2.5 percent SMBA contribution were included, the rate would increase from 5.79 percent under previous law to 8.83 percent in 2016–17.) In addition, the budget package accelerates part of the state’s annual DB program payment from October 1st to July 1st. (This acceleration costs $16 million, or roughly 25 percent of the $59 million state contribution increase in 2014–15 under the funding plan.) Over the next 32 years, the state will pay 18 percent of the total estimated costs to address the CalSTRS unfunded liability.
Teachers Pay About 10 Percent of Increased Costs. Under California case law, the state cannot increase the contribution rates of existing members of a public pension system without providing an offsetting advantage to the employee group. In exchange for increasing contributions from active teachers, the budget package guarantees an existing benefit that increases teachers’ pensions by a simple 2 percent per year in retirement. (The state previously reserved the right to adjust this benefit for teachers hired after January 1, 2014. The Legislature maintains the right to adjust this benefit for teachers who retired prior to January 1, 2014.) Because teachers hired after January 1, 2013 earn comparably less generous pensions than their pre–2013 counterparts, the 2 percent benefit adjustment provides them less benefit in retirement. For this reason, the amount by which the budget package increases the contributions of teachers hired after January 1, 2013 is somewhat lower than for pre–2013 hires. Specifically, contributions for teachers hired before January 1, 2013 will ramp up over three years from 8 percent to 10.25 percent, while rates for teachers hired after that date will increase from 8 percent to 9.21 percent over the same period. Teachers collectively will pay 11 percent of the estimated costs associated with the funding plan.
Authorizes CalSTRS to Adjust State and District Rates. For the first time, Chapter 47 gives CalSTRS the authority to adjust state and district rates up or down when the funding plan deviates from actuarial assumptions. Specifically, CalSTRS can adjust the state’s rate by up to 0.5 percentage points per year beginning in 2017–18 when the state’s rate increase is fully phased in. Similarly, CalSTRS can adjust districts’ rates by up to 1 percentage point per year beginning in 2021–22 after district rate increases are fully phased in. CalSTRS could adjust district rates by up to 12 percent of teacher payroll. The authority applies only to unfunded liabilities as of July 1, 2014. Chapter 47 does not specify a policy for assigning responsibility for unfunded liabilities that arise after that date.
Poison Pill. In Chapter 47, the Legislature finds and declares that district contribution increases do not (1) require any adjustment to Proposition 98 funding levels or (2) constitute a state reimbursable mandate. Chapter 47 provides 60 days in which a court challenge to these findings can be filed. If a final court decision finds that the increased district contributions require a Proposition 98 adjustment or constitute a reimbursable mandate with state costs over $10 million, all provisions of Chapter 47 become inoperable.
The spending plan provides $19.3 billion from the General Fund for health programs. This is an increase of almost $700 million, or 3.7 percent, compared to the revised 2013–14 spending level, as shown in Figure 9. This reflects both increases in caseload and utilization of services, implementation of the Patient Protection and Affordable Care Act (ACA)—also known as federal health care reform—and other health care initiatives. The major program–specific changes are summarized in Figure 10 and discussed in more detail.
Figure 9
Major Health Programs and Departments—Spending Trends
General Fund (Dollars in Millions)
|
|
2012–13
|
2013–14
|
2014–15
|
Change From
2013–14 to 2014–15
|
|
Amount
|
Percent
|
|
Medi–Cal—local assistance
|
$14,862
|
$16,647
|
$17,280
|
$633
|
3.8%
|
|
Department of State Hospitals
|
1,277
|
1,505
|
1,520
|
15
|
1.0
|
|
Healthy Families Program—local assistance
|
176
|
22
|
—
|
–22
|
–100.0
|
|
Department of Public Health
|
129
|
130
|
118
|
–12
|
–9.2
|
|
Department of Alcohol and Drug Programs
|
34
|
—
|
—
|
—
|
—
|
|
Other Department of Health Care Services programs
|
110
|
79
|
150
|
71
|
89.9
|
|
Emergency Medical Services Authority
|
7
|
7
|
8
|
1
|
12.2
|
|
All other health programs (including state support)
|
151
|
168
|
177
|
9
|
5.4
|
|
Totals
|
$16,746
|
$18,558
|
$19,253
|
$695
|
3.7%
|
Figure 10
Major Changes—State Health Programs
2014–15 General Fund Effect (In Millions)
|
Program
|
Amount
|
|
Medi–Cal—Department of Health Care Services
|
|
|
Changes to services for certain pregnant women
|
–$17.0
|
|
Increases payments for Programs of All–Inclusive Care for the Elderly
|
1.8
|
|
Authorizes collection of supplemental rebates for specialty drugs in managed care
|
–6.0
|
|
Department of Public Health
|
|
|
Increases funding for Black Infant Health Program and HIV demonstration projects
|
$7.0
|
|
Department of State Hospitals
|
|
|
Increases capacity for CDCR–committed patients
|
$26.0
|
|
Increases capacity for incompetent to stand trial patients
|
28.0
|
|
Increases capacity for the Restoration of Competency program
|
4.0
|
|
Establishes a statewide Patient Management Unit
|
1.0
|
Department of Health Care Services (DHCS)—Medi–Cal
The spending plan provides $17.3 billion from the General Fund for Medi–Cal local assistance expenditures administered by DHCS. This is an increase of $633 million, or 3.8 percent, compared to the revised prior–year spending level. Spending in 2013–14 was $553 million greater than the 2013–14 budget appropriation. The major factors that contributed to the Medi–Cal deficiency in 2013–14 are:
- An erosion of $382 million in General Fund savings from provider payment reductions, due to (1) revised utilization estimates, (2) exemption of certain specialty drugs from payment reductions, and (3) delays in implementing payment reductions for certain classes of providers. We discuss the provider payment reductions in more detail below.
- A shift of $155 million in General Fund savings from 2013–14 to 2014–15, due to a delay in federal approval of the hospital quality assurance fee. The fee provides revenues that offset General Fund costs for providing children’s health coverage.
Differences in Medi–Cal spending between 2013–14 and 2014–15 are in large part the result of underlying cost drivers in the program, such as changes to caseload and the cost of providing health care services. We discuss some major policies that were adopted or maintained as part of the 2014–15 Medi–Cal Program budget below.
Maintains Certain Provider Payment Reductions. In 2011, budget–related legislation authorized a reduction in certain Medi–Cal fee–for–service provider payments by up to 10 percent, as well as a related reduction in payments to Medi–Cal managed care plans. Provider payment reductions were initially delayed by a court injunction while the state awaited court approval to implement them. Based on the court lifting the injunction, the state now has the authority to both (1) apply the reductions to current and future payments on an ongoing basis, and (2) retroactively recoup the reductions from past payments that were made when the court injunction was in effect. The spending plan maintains the reductions and recoupments that have not been legislatively or administratively exempted. (The spending plan assumes $36 million in increased General Fund expenditures due to foregone savings from exempting certain classes of providers from the recoupments.) The estimated General Fund savings from the remaining reductions and recoupments is $272 million in 2014–15.
ACA Implementation Has Many Different Fiscal Effects. The budget assumes a wide variety of fiscal effects—some major and some minor—associated with implementing various provisions of state and federal law related to the ACA. Many of the ACA–related changes that affect the Medi–Cal Program went into effect in 2013 or early 2014 and the impacts of these changes are still highly uncertain. Some of the major ACA–related fiscal effects assumed in the 2014–15 Medi–Cal local assistance budget are:
- Optional Expansion. Effective January 1, 2014, Medi–Cal eligibility expanded to include previously ineligible adults with incomes up to 138 percent of the federal poverty level (FPL)—largely, childless adults. The budget assumes roughly 1.6 million newly eligible beneficiaries will enroll in 2014–15, and most of them will receive services through Medi–Cal managed care. (This estimate does not include newly eligible persons who enroll through new enrollment pathways such as Express Lane enrollment or hospital presumptive eligibility.) The federal government is paying for 100 percent of the health care costs for the newly eligible population through 2016. Due to the increase in Medi–Cal managed care enrollment, the budget assumes $408 million in additional General Fund offsets from an existing tax on Medi–Cal managed care plans.
- Mandatory Expansion. The ACA includes requirements that will increase Medi–Cal enrollment among individuals who were previously eligible, but unenrolled—often referred to as the mandatory expansion. Generally, the state will continue to be responsible for 50 percent of the costs of providing services to mandatory expansion enrollees. The budget assumes 815,000 additional mandatory expansion enrollees will result in $766 million General Fund costs in 2014–15.
- Enhanced Federal Match for Certain Eligibility Determination Functions. Generally, payments to counties for making Medi–Cal eligibility determinations for both the previously and newly eligible populations are eligible for a 50 percent federal match. However, federal guidance released in 2011 allows California to receive a 75 percent federal match for certain eligibility determination functions if they meet certain minimum eligibility system requirements outlined by the federal government. The 2014–15 budget assumes enhanced federal funding for certain Medi–Cal eligibility determination costs will reduce state General Fund spending by $248 million.
The 2014–15 state budget includes other significant ACA fiscal effects. For example, the budget assumes $725 million in General Fund offsets in the budget of the CalWORKs program resulting from the optional expansion and changes to 1991 health realignment that were enacted as part of the 2013–14 budget.
Changes to Services for Certain Pregnant Women. The 2014–15 budget makes two significant changes to services available to certain pregnant women in Medi–Cal. Specifically, it: (1) provides full–scope coverage to pregnant women up to 138 percent of FPL who previously received pregnancy–only coverage, and (2) provides “wrap–around” coverage to pregnant women between 139 percent and 208 percent of FPL who obtain coverage through California’s health benefit exchange—known as Covered California. (The 2013–14 budget assumed savings from a similar proposal to shift certain pregnant women from Medi–Cal to coverage offered through Covered California, but the statutory language authorizing such a shift was never enacted.) The budget assumes General Fund savings of $17 million in 2014–15 from these changes.
Increases Payments for Programs of All–Inclusive Care for the Elderly (PACE). The spending plan includes increased General Fund expenditures of $1.8 million due to changes in the Medi–Cal payment methodology for PACE. (Program providers receive capitation payments to provide medical and social services benefits to adults over 55 who would otherwise reside in nursing facilities.) These payment changes take effect on April 1, 2015. The estimated full–year cost of these changes is about $8 million General Fund.
Authorizes Collection of Supplemental Rebates for Specialty Drugs in Managed Care. The spending plan assumes $6 million in General Fund savings from authorizing DHCS to collect state supplemental rebates for certain drugs provided through Medi–Cal managed care plans. (Previously the state was prohibited from collecting supplemental rebates for drugs provided through Medi–Cal managed care plans, except for county–organized health systems.) Specifically, the budget extends supplemental rebates to managed care drugs that the state will fund separately from the plans’ regular capitated rates. According to the administration, these separately funded drugs will be limited to certain high–cost specialty drugs, such as hepatitis C treatments.
Behavioral Health Therapy (BHT) Services Added as a Medi–Cal Benefit After the 2014–15 Budget Act. The 2014–15 Budget Act included trailer bill language requiring DHCS to add BHT services, such as Applied Behavioral Analysis (ABA), as a covered Medi–Cal benefit to the extent required by federal law. Subsequent to passage of the 2014–15 Budget Act, the federal government issued guidance which indicated that BHT should be a covered Medicaid benefit for eligible children and adolescents with autism spectrum disorder. The DHCS is in the process of obtaining federal approval for the provision of BHT. In the interim, as of September 15, 2014, Medi–Cal managed care plans are required to provide medically necessary ABA services for eligible children and adolescents with autism spectrum disorder. Provision of other BHT services will be implemented at a later as–yet undetermined date. No funds were included in the spending plan for BHT services in Medi–Cal and the administration has not given an estimate for the cost of providing these services since the federal government issued guidance.
Department of State Hospitals (DSH)
Under the budget plan, General Fund spending for DSH will be approximately $1.5 billion in 2014–15, an increase of $15 million, or 1 percent, from the revised 2013–14 level. The net year–over–year increase in General Fund support is largely due to increased capacity in the state hospitals and psychiatric programs.
Population Adjustments. The budget plan includes a net $31.5 million General Fund increase for the maintenance and activation of an additional 242 patient beds. This total includes (1) a net $3.7 million for 137 beds at DSH–Vacaville and DSH–Salinas Valley to treat patients referred by the California Department of Corrections and Rehabilitation (CDCR) and (2) $27.8 million for 105 beds to treat incompetent to stand trial (IST) patients in DSH facilities.
Restoration of Competency (ROC) Expansion. The budget includes $4 million to expand the ROC program by 45 to 55 beds. Historically, the ROC program provides treatment to IST patients in county jails (rather than in DSH facilities). The 2014–15 budget package provides funding for additional capacity for the program and allows ROC services to be provided in community–based facilities.
Patient Management Unit. Historically, judges making commitments to DSH could order that patients be placed in specific DSH facilities. As part of the budget package, the Legislature adopted trailer legislation to have judges commit patients to the DSH system at large and DSH determine which facility is most appropriate for each patient. To facilitate DSH’s ability to appropriately place patients, the budget includes $1 million for the department to develop a statewide patient management unit. This unit will allow DSH to centralize and coordinate patient placement statewide and track patient data.
Department of Public Health (DPH)
The spending plan provides $2.5 billion from all fund sources for DPH programs. This is a decrease of $474 million, or about 16 percent, compared to the revised prior–year spending level. Of this total, the spending plan provides $118 million General Fund for DPH, a decrease of $12 million or 9 percent. This year–over–year net decrease in General Fund and total fund expenditures is mainly attributable to the transfer of the Drinking Water Program from DPH to the State Water Resources Control Board (SWRCB). (We describe this transfer in the “Resources and Environmental Protection” section of this report.) The decrease in funding due to the transfer is partially offset by funding increases for other DPH programs.
Funding for Black Infant Health (BIH) Program and HIV Demonstration Projects. The spending plan includes two General Fund augmentations totaling $7 million, as follows:
- BIH—$4 million for BIH, to improve health among black mothers and babies and address disproportionately high rates of preterm births and infant mortality.
- HIV Demonstration Projects—$3 million for HIV demonstration projects that will address outreach, screening, and care for underserved Californians living with or at risk for HIV.
HIV/AIDS Program Changes. The budget also includes $26.1 million in federal funds (net of savings from drug rebates) to add two new Hepatitis C virus drugs to the AIDS Drug Assistance Program (ADAP) drug formulary. The budget also includes language to develop the capacity to pay out–of–pocket medical expenses, in addition to premiums, for eligible ADAP clients who choose to purchase insurance through Covered California, if the director determines that this subsidization would result in cost savings to the state.
Dental Director. The budget also includes $474,000 ($250,000 General Fund) to establish a State Dental Director and provide the resources to develop a statewide dental health plan.
Health and Human Services Agency (HHSA)
The spending plan provides $4.3 million General Fund for HHSA. This is an increase of $1.1 million, or 36 percent, compared to the revised prior–year spending level. This year–over–year General Fund growth is largely due to an increase of $787,000 for the establishment of the Office of Law Enforcement Support (OLES) within HHSA. The OLES will provide centralized oversight to the nine individual Offices of Protective Services (OPS)—which perform law enforcement functions—at five state hospitals and four Developmental Centers (DCs) operated by DSH and the Department of Developmental Services (DDS), respectively. In addition to providing centralized oversight, OLES will develop standardized policies and procedures, and introduce measures to improve recruitment and training for the peace officers employed by OPS.
Managed Risk Medical Insurance Board (MRMIB)
The spending plan eliminates MRMIB effective July 1, 2014, and shifts funding and position authority for three programs administered by MRMIB from MRMIB to DHCS. Specifically, the spending plans shifts the Major Risk Medical Insurance Program, Access for Infants and Mothers, and the County Health Initiative Matching Fund Program to DHCS. We note that California’s federal Children’s Health Insurance Program (CHIP) was formerly administered by MRMIB and known as the Healthy Families Program (HFP). Chapter 28, Statutes of 2012 (AB 1494, Committee on Budget), was enacted by the Legislature to implement a modified version of the Governor’s proposal to shift all HFP enrollees into Medi–Cal. The shift of HFP enrollees into Medi–Cal was completed during 2013–14, and the name of California’s CHIP was changed from HFP to the Targeted Low–Income Children’s Program. The DHCS state operations budget increases by $6.1 million ($1 million General Fund) in 2014–15 to reflect the shift of MRMIB programs from MRMIB to DHCS.
Overview of Total Spending. The spending plan provides $10.3 billion from the General Fund for human services programs. This is an increase of $98 million, or 1 percent, compared to the revised prior–year spending level, as shown in Figure 11. (Note that, unlike prior–year Spending Plan documents, this report includes the DDS as a human services department in any human services budget summary figure.) This modest net increase in General Fund expenditures reflects increases in various programs that are largely offset by a net decrease in General Fund support for the CalWORKs program due to the shifting of costs from the General Fund to other fund sources.
Figure 11
Major Human Services Programs and Departments—Spending Trends
General Fund (Dollars in Millions)
|
|
2012–13
|
2013–14
|
2014–15
|
Change From
2013–14 to 2014–15
|
|
Amount
|
Percent
|
|
SSI/SSP
|
$2,752.6
|
$2,780.4
|
$2,810.4
|
$30.0
|
1.1%
|
|
Department of Developmental Services
|
2,674.5
|
2,809.6
|
2,961.5
|
151.9
|
5.4
|
|
CalWORKs
|
1,544.5
|
1,194.6a
|
732.7b
|
–461.9
|
–38.7
|
|
In–Home Supportive Services
|
1,705.9
|
2,017.9
|
2,219.8
|
201.9
|
10.0
|
|
County Administration/Automation
|
617.0
|
761.8
|
848.4
|
86.6
|
11.4
|
|
Department of Child Support Services
|
298.9
|
313.0
|
312.8
|
–0.2
|
–0.1
|
|
Department of Rehabilitation
|
55.3
|
57.0
|
57.0
|
—
|
0.1
|
|
Department of Aging
|
31.4
|
32.2
|
32.2
|
—
|
—
|
|
All other social services (including state support)
|
239.3
|
265.7
|
355.8
|
90.1
|
33.9
|
|
Totals
|
$9,919.4
|
$10,232.1
|
$10,330.6
|
$98.4
|
1.0%
|
Summary of Major Changes. Figure 12 shows the major General Fund changes in the 2014–15 Budget Act for human services programs. (Figure 12 does not reflect funding shifts that do not change overall program funding levels.) Most of the budget changes were in the CalWORKs and In–Home Supportive Services (IHSS) programs. Absent the changes shown in the figure, General Fund spending for human services programs in 2014–15 would have been $325 million lower. Below, we discuss the major changes in each program area.
CalWORKs
Figure 12
Major Changes—Human Services Programs
2014–15 General Fund Effect (In Millions)
|
Program
|
Amount
|
|
CalWORKs
|
|
|
5 percent grant increasea
|
$46.6
|
|
Funding for homeless and housing supports
|
20.0
|
|
Drug felon eligibilityb
|
10.7
|
|
Increased child care reimbursementsc
|
6.3
|
|
Utility Assistance
|
|
|
State–funded utility subsidy to leverage federal CalFresh benefits
|
10.9
|
|
In–Home Supportive Services
|
|
|
Compliance with federal labor regulations for home care workersc
|
172.2
|
|
Developmental Services
|
|
|
Implementation of Developmental Centers’ Task Force recommendations
|
15.3
|
|
Restoration of pre–2009 Early Start eligibility criteriac
|
7.9
|
|
Compliance with federal labor regulations for home care workersc
|
9.4
|
|
Child Welfare Services
|
|
|
Increase foster care payments for nonfederally eligible foster youthc
|
15.0
|
|
Services for commercially sexually exploited childrenc
|
5.0
|
|
Community Care Licensing
|
|
|
Quality enhancements and program improvements
|
5.8
|
|
Total
|
$325.1
|
The spending plan provides a total of $5.6 billion (all funds) to support the CalWORKs program, a net increase of $146 million (3 percent) over the prior year. Of this increase, $82 million is the result of policy changes (discussed below), with the balance consisting of the net effect of caseload changes and the full–year implementation of prior policy changes. Within the total funding amount, the spending plan provides $733 million from the General Fund to support CalWORKs, a net decrease of $462 million (39 percent) from the prior year. This significant decrease in General Fund support reflects an increasing shift of funding responsibility from the state General Fund to other funding sources. Specifically, as a result of the Medi–Cal expansion, $725 million in funds previously dedicated to local health programs under 1991 realignment are estimated to be available to offset General Fund spending in CalWORKs in 2014–15. This is a $425 million increase over estimated realignment funds available to offset General Fund spending in the prior year. Additionally, an ongoing funding swap between CSAC and CalWORKs (which has the effect of decreasing federal funding for CalWORKs and increasing General Fund support by a like amount) is partially reversed in 2014–15, resulting in decreased use of General Fund in CalWORKs. Taken together, year–over–year changes in these two funding shifts result in $589 million less General Fund spending in CalWORKs than would otherwise have been the case, with no net impact on total program spending.
5 Percent Grant Increase. Effective April 2015, budget legislation increases maximum monthly CalWORKs grants by 5 percent, with an estimated partial–year cost of $47 million (General Fund). The estimated full–year cost of this increase is approximately $180 million. As displayed in Figure 13, the increase is estimated to result in up to $34 of additional cash assistance per month for a family of three with no other income. As the CalWORKs grant is counted as income for purposes of determining CalFresh food benefits, this increase will be partially offset by a corresponding decrease in food assistance.
Figure 13
Monthly CalWORKs Grant and CalFresh Benefita
|
|
March 2015
|
April 2015b
|
Change
|
|
Amount
|
Percent
|
|
High–Cost Counties
|
|
|
|
|
|
Grant
|
$670
|
$704
|
$34
|
5%
|
|
CalFresh benefit
|
503
|
493
|
–10
|
–2
|
|
Totals
|
$1,173
|
$1,197
|
$24
|
2%
|
|
Grant as percent of FPL
|
41%
|
43%
|
|
|
|
Grant and CalFresh benefit as percent of FPL
|
71%
|
73%
|
|
|
|
Low–Cost Counties
|
|
|
|
|
|
Grant
|
$638
|
$670
|
$32
|
5%
|
|
CalFresh benefit
|
511
|
503
|
–8
|
–2
|
|
Totals
|
$1,149
|
$1,173
|
$24
|
2%
|
|
Grant as percent of FPL
|
39%
|
41%
|
|
|
|
Grant and CalFresh benefit as percent of FPL
|
70%
|
71%
|
|
|
The April 2015 grant increase is in addition to a 5 percent grant increase previously provided in March 2014. Both increases are funded through a statutory mechanism that automatically provides grant increases in years in which a dedicated funding source (consisting of the redirected growth in certain 1991 realignment revenues) is sufficient to support the new increase and all past increases provided through the mechanism. The April 2015 increase is an exception to this process in that it was enacted directly by the Legislature without regard to whether dedicated funds were fully available to fund the increase. Since dedicated funds are estimated to be sufficient only to cover most of the cost of the March 2014 increase during 2014–15, the cost of the April 2015 increase will be paid fully from the General Fund. In future years, the General Fund will continue to pay the portion of ongoing costs of the April 2015 increase that is not covered by dedicated funds. Available dedicated funds are expected to grow over time, gradually decreasing the need for General Fund support. No new grant increases will be provided under the statutory mechanism’s regular process until the dedicated funds are sufficient to cover the cost of both the March 2014 and April 2015 increases.
Funding for Homeless and Housing Supports. Budget legislation creates a new CalWORKs housing support component, through which counties may optionally receive state funds to provide financial assistance and services to CalWORKs recipients that are homeless or experiencing housing instability. The spending plan provides $20 million (General Fund) for the housing support component in 2014–15.
Drug Felon Eligibility. Under prior law, individuals convicted of a drug–related felony in 1998 or later were not eligible for CalWORKs assistance. Budget legislation repeals this ban on assistance, effective April 2015. The spending plan includes $11 million (General Fund) to pay for the partial–year costs of cash assistance, welfare–to–work services, and administration for newly eligible recipients, as well as some automation costs made necessary by the change. The estimated full–year cost of this change is approximately $33 million. (Budget legislation also repeals a more limited ban on CalFresh assistance for individuals convicted of certain drug–related felonies, also effective April 2015. The spending plan provides $85,000 General Fund [$153,000 all funds] to provide administration and state–funded food assistance for newly eligible adults in 2014–15.)
Increase in Child Care Reimbursement Rates. Under prior law, child care providers for CalWORKs recipients were reimbursed up to a maximum amount that was tied to the 85th percentile of a 2005 survey of RMRs. Budget legislation (1) requires that maximum reimbursements be tied instead to the 85th percentile of a more recent 2009 regional market survey and (2) reduces the maximum reimbursement amounts for most areas under this more recent survey by roughly 10 percent. This change results in higher maximum reimbursement rates in many areas of the state, and the spending plan provides an additional $6 million (General Fund) for CalWORKs to reflect these higher rates. For more information on this change and its broader effect on the state budget, see the “Child Care and Preschool” write–up in the “Education” section of this report.
CalFresh–Related Utility Assistance
State Utility Assistance Subsidy (SUAS) to Leverage Increased Federal Food Assistance. Under prior state law, the state used federal funds to provide a nominal utility assistance benefit to all households that received CalFresh food assistance. Under prior federal law, receiving this nominal benefit allowed certain CalFresh households to receive higher federally funded CalFresh benefits than they would otherwise. The federal Agricultural Act of 2014 (also known as the Farm Bill) altered federal law to require a significantly higher utility assistance payment for households to continue to receive higher CalFresh benefits. In response to this change in federal law, budget legislation creates the SUAS, a state–funded program that will target the higher utility assistance payment required by federal law to those households that meet all other criteria to receive increased food assistance. The spending plan includes $11 million (General Fund) for SUAS. The Department of Social Services (DSS) estimates that this action will result in an average of $62 in additional CalFresh benefits each month for approximately 349,000 households during 2014–15.
In–Home Supportive Services
The budget increases General Fund support for IHSS by $202 million (10 percent) in 2014–15 when compared to the revised 2013–14 level. The major budget–related changes for IHSS involve compliance with new federal labor regulations for home care workers and new requirements for the IHSS provider orientation. Below, we describe the major changes to the IHSS program.
New Federal Labor Regulations Affect the IHSS Program. The federal Department of Labor recently released new federal regulations that affect home care workers, including IHSS providers. Beginning January 1, 2015, these regulations require the state to do the following: (1) pay overtime—that is, one–and–a–half times the regular pay rate—to IHSS providers for all hours worked that exceed 40 in a week and (2) compensate IHSS providers for time spent waiting during medical appointments and traveling between the homes of IHSS recipients—two work activities for which providers are not currently paid. We note that the federal government is continuing to release guidance related to the implementation of these regulations.
2014–15 Budget Funds Overtime and Newly Compensable Work Activities . . . In January, the Governor had proposed to respond to the new federal labor regulations by paying for the newly compensable work activities of wait and travel time, but restricting IHSS providers to working no more than 40 hours per week to avoid overtime payments. The 2014–15 spending plan rejects the overtime component of the Governor’s January proposal. Instead, the 2014–15 budget provides funding to pay IHSS providers for overtime (with some limitations described below) and for the newly compensable work activities beginning January 1, 2015, at a total cost of $172 million General Fund. The funding also includes the cost of related administrative activities and changes to the IT system that stores IHSS case records, provides program data reports, and authorizes IHSS provider payments. Figure 14 provides a breakdown of the budgeted General Fund cost of complying with the new federal labor regulations in 2014–15.
Figure 14
IHSS Program: General Fund Cost of Complying With New Federal Labor Regulations
2014–15 (In Millions)
|
Overtime payments
|
$92.7
|
|
Payments for newly compensable work activities
|
69.9
|
|
Administrative activities
|
5.8
|
|
Information technology system changes
|
3.8
|
|
Total
|
$172.2
|
. . . But Places Limitations on Amount of Overtime That Can Be Worked and Amount of Weekly Care That Can Be Received. Currently, IHSS providers face no limitations on the number of hours they may work each week, as long as they do not provide care so as to exceed recipients’ total authorized service hours each month. Similarly, recipients currently face no limitations on the number of hours of care they may receive each week, as long as they do not exceed their total number of monthly authorized hours. However, budget–related legislation places some new limitations on the amount of overtime that may be worked by IHSS providers each week, effective January 1, 2015. First, it limits the total number of hours that providers may work each week to no more than 66—generally reduced to 61 while a 7 percent reduction in service hours under current law is in place. This limit generally applies regardless of whether an IHSS provider works for a single recipient or more than one recipient (a narrow exception to this limit is described below). Second, the legislation generally limits the total hours of care that a recipient may receive each week to about a fourth of his/her total monthly authorized hours. Both of these rules are intended to limit a potential increase in the cost of paying for overtime as a result of IHSS providers increasing their weekly work hours or otherwise changing their work schedules.
Exceptions to New Limits on Overtime Worked and Care Received. Under the budget legislation, there are several ways in which recipients may be granted exceptions to the limit on their weekly hours of care received. First, the county welfare department may adjust the weekly authorized hours for any particular week for known recurring or periodic needs of the recipient. Second, the recipient may request that the county welfare department adjust the weekly authorized hours for unexpected extraordinary circumstances. Finally, a recipient may adjust his/her weekly authorized hours without notifying the county welfare department if the adjustment would not cause the recipient to receive more than 40 hours of care within the given week. Regardless of any adjustment to weekly authorized hours, all recipients continue to be required to receive no more than the total number of monthly authorized hours each month. Under certain circumstances, the legislation authorizes a provider to work more than 66 weekly hours—as long as the provider rebalances his/her work schedule in other weeks of the month so that he/she does not accrue more overtime hours in the month than would have accrued had no adjustment to the weekly work schedule been made.
Limits IHSS Providers to No More Than Seven Hours of Travel Time Each Week. While the 2014–15 spending plan provides funding to pay IHSS providers for time spent traveling directly between the homes of recipients, budget–related legislation stipulates that providers cannot engage in more than seven hours of travel time per week. There is some uncertainty regarding whether the federal government will pay a share of the costs for travel time. Given this uncertainty, the legislation further stipulates that travel time hours will be counted toward providers’ weekly limit of 66 work hours if federal financial participation is unavailable for travel time costs. If federal financial participation is available, then the travel time hours will not be counted toward providers’ weekly limit of 66 work hours.
IHSS Providers Can Be Terminated if They Violate Work Limitations on Multiple Occasions. The budget–related legislation establishes a grace period for the first three months after the federal labor regulations go into effect. During this time, IHSS providers will be compensated, rather than penalized, for working more than 66 hours per week, exceeding a recipient’s weekly authorized hours, and/or engaging in more than seven hours of weekly travel time. After the three–month grace period, budget–related legislation stipulates that IHSS providers who violate the work limitations on multiple occasions could be terminated from the IHSS program by either the state or the county in which the provider works.
Study on Implementation of the New Work Limitations. The budget–related legislation requires DSS to conduct a study and report to the Legislature on the implementation of the new work limitations over the 24–month period following the three–month grace period. The legislation specifies the intent of the Legislature to make any appropriate adjustments to the state’s compliance with the new federal labor regulations through subsequent legislation.
New Requirements for the IHSS Provider Orientation. All individuals seeking to work for the IHSS program are required to undergo an orientation—administered by the county—prior to working as a provider. Currently, counties have the authority to administer the IHSS provider orientation in different ways—including using a web–based tool or providing in–person instruction. The 2014–15 budget implements new requirements for the IHSS provider orientation. Beginning April 1, 2015, all counties must administer an on–site orientation that all prospective providers must attend in person. A new requirement of the in–person orientation is that it inform providers of new overtime rules as well as paid travel and wait time. The legislation also allows the local union representing IHSS providers to make a presentation of up to 30 minutes during the in–person orientation. Prospective providers are not compensated for the time they spend attending the orientation. The 2014–15 budget did not include any specific funding for this change in the administration of IHSS provider orientations.
Community Care Licensing (CCL)
Funds CCL Quality Enhancements. The 2014–15 spending plan funds the Governor’s proposal for quality enhancements and improvements at the CCL division within DSS. This includes 71.5 positions and $5.8 million General Fund to do such things as (1) create a more robust training program for licensing inspectors, (2) create a quality assurance unit that is trained to detect instances of systemic noncompliance, (3) centralize and make more efficient the application and complaint intake process, and (4) create some medical capacity at DSS to begin considering the increasing medical needs of those in assisted living facilities. For instances when the license of a facility is suspended or revoked, budget–related legislation allows for the department to appoint a qualified temporary manager or receiver to: (1) assume responsibility of the operation of the facility and assist in bringing it into compliance, (2) facilitate the transfer of ownership of the facility to a new licensee, or (3) coordinate and oversee the transfer of clients to a new facility if the facility is closing.
Penalties and Fees. The Legislature rejected the administration’s proposal to increase the penalty assessed on licensees for instances of serious noncompliance, and instead included trailer bill language that signals its intention to increase the penalties for all facilities for instances of serious noncompliance (with an emphasis on violations that result in serious injury or death) through subsequent legislation. Effective January 2015, the 2014–15 spending plan also includes a 10 percent increase in annual licensing and application fees. This increase in fees is estimated to generate $1 million in revenue in 2014–15 and $2 million in revenue annually thereafter.
Intent to Increase Inspection Frequency. The final budget package includes intent language specifying that it is the intent of the Legislature to, over time, increase the frequency of facility inspections to annually for some or all facilities.
Department of Developmental Services
Under the budget plan, General Fund spending for DDS will increase from $2.8 billion in 2013–14 to nearly $3 billion in 2014–15, or by 5.4 percent. Below, we discuss the most significant spending changes that were adopted in the DDS budget.
Enacts Governor’s Proposals for Transitioning DC Residents to Community Settings. The DCs are large, state–run institutional facilities that serve individuals with developmental disabilities. In 2013, the administration convened a task force on the future of DCs—comprised of consumers, consumer advocates, regional center (RC) representatives, community service providers, members of organized labor, families of DC residents, members of the Legislature, and DDS staff—that released a plan for the long–term future of DCs. The plan recognizes the varying needs of existing DC residents and makes recommendations for improving community services and supports (as an alternative to the DCs), while retaining institutional facilities for individuals who are in acute crisis or involved in the criminal justice system. The budget enacts the Governor’s May Revision package of proposals that adopts some of the task force recommendations, for a total cost of about $15 million General Fund in 2014–15. Below, we provide a breakdown for how these funds will be spent in 2014–15.
- New Community Homes for DC Residents Transitioning to Community. The budget provides about $12 million General Fund to begin to develop additional homes in the community, which will include new models of care to primarily serve consumers with challenging behavioral needs.
- Additional Funding for RC Staffing and DC Acute Crisis Units. The budget provides about $1 million General Fund for additional RC staff positions to support design and development of the new community homes, ensure safe consumer transitions and consumers’ continuing health and safety, and conduct ongoing quality assurance and monitoring. The budget also provides $2 million General Fund to develop acute crisis units at Fairview DC and Sonoma DC, which will operate as a placement of last resort for consumers found to be a danger to themselves or others and who are in need of short–term crisis stabilization services.
Continues Improvements at Sonoma DC. The 2014–15 budget provides $5 million General Fund ($1 million above the amount provided in 2013–14) to continue to implement improvements needed at Sonoma DC to regain federal certification of four Intermediate Care Facility (ICF) units decertified in January 2013 as a result of health and safety violations. Because certification is a requirement for receipt of federal Medicaid funds, the decertification of the four ICF units led to the loss of $16 million in federal funds in 2013–14. The budget assumes that certification of the four ICF units will be regained, and that the $16 million in federal funding will be restored beginning July 1, 2014.
Restores Early Start Eligibility Criteria to Less Stringent Threshold. Early Start is California’s program that provides early intervention services to infants and toddlers in order to reduce the effects of a developmental disability or delay—in response to the federal Individuals with Disabilities Education Act. The budget provides $8 million General Fund to restore Early Start eligibility criteria, beginning January 1, 2015, to the less stringent threshold that was in effect prior to budget reductions made in 2009. This means that for children 24 months of age or older, the eligibility threshold will return to a developmental delay of at least 33 percent in one of five developmental areas as opposed to the more stringent criteria implemented in 2009—either a developmental delay of at least 50 percent in one area or a developmental delay of at least 33 percent in two or more areas. In addition, infants and toddlers who are considered at risk of a substantial developmental disability due to a combination of risk factors will return to being eligible for Early Start. Since 2009, infants and toddlers considered to be at risk have not been eligible for Early Start services.
Provides a Rate Increase to RC Vendors of Home Care Services for Overtime Costs. The budget provides about $9 million General Fund in order to fund a 5.82 percent rate increase beginning January 1, 2015 to RC vendors employing workers providing home care services. Vendors that employ workers providing services—including personal assistance, supported living services, and in–home respite—to consumers in their homes are impacted by new federal labor regulations requiring overtime pay for home care workers. (We describe the new federal labor regulations in greater detail in the “In–Home Supportive Services” section of this report.) The 5.82 percent rate increase is intended to provide vendors of home care services the ability to pay employees overtime—that is, one–and–a–half times the regular pay rate—for hours that exceed 40 in a week pursuant to the new federal labor regulations.
Authorizes RCs to Pay for Private Health Insurance Deductibles. Beginning in 2013–14, RCs were authorized to pay for private health insurance co–payment and coinsurance costs for services identified as necessary in a consumer’s individual program plan—generally for consumers whose families earn at or below 400 percent of the FPL. Budget–related legislation authorizes RCs to also pay for private health insurance deductibles beginning July 1, 2014. The budget provides about $10 million General Fund to pay for private health insurance co–payments, coinsurance, and deductibles in 2014–15.
Governor Vetoes Budget Act Language to Establish Stakeholder Workgroups for Rate–Setting Methodologies and Core–Staffing Formula. The Legislature included language in the budget bill sent to the Governor to establish stakeholder workgroups to review and make recommendations on (1) rate–setting methodologies for community services and supports and (2) the core–staffing formula used to determine the operations budget for RCs. The Governor vetoed these provisions and instead directed the HHSA to convene a task force to review these two issues along with other community issues identified by the task force on the future of DCs.
Child Welfare Services
Establishes the Commercially Sexually Exploited Children (CSEC) Program. Effective January 1, 2015, the 2014–15 budget provides $5 million General Fund for support of the newly established CSEC program. Counties will have the option of participating in this program, which is intended to provide prevention activities, intervention activities, and services to children who are victims, or at risk of being victims, of commercial sexual exploitation. Counties interested in participating in the program are required to submit plans to DSS. These plans are required to include the formation of a multidisciplinary team to serve the children. The team will be comprised of representatives from the county child welfare, probation, mental health, substance abuse disorder, and public health departments. The DSS, in consultation with the County Welfare Directors Association, will develop an allocation methodology to distribute the funding for the program amongst counties electing to participate. No later than April 1, 2017, DSS shall report to the Legislature on the implementation of the program. Ongoing funding for the CSEC program is estimated to be $14 million General Fund.
Creates the Approved Relative Caregiver Funding Option Program. Effective January 1, 2015, the 2014–15 budget provides $15 million General Fund for the support of the newly established Approved Relative Caregiver Funding Option program. Currently, the estimated 5,200 foster youth in California who are not eligible for federal foster care payments and are placed with a relative provider receive a lower foster care payment than the youth who are eligible for federal foster care. The state General Fund cost to make foster care payments for these nonfederally eligible youth equal to the foster care payments of federally eligible youth—the objective of this new program—is estimated to be $15 million in 2014–15 (half–year effect) and about $30 million annually thereafter (to be adjusted annually by the California Necessities Index). Participation in this program is optional for counties. The program is intended to fund the cost of the caseload of nonfederally eligible foster youth placed with relatives as of July 1, 2014. Any county that opts to participate in the program assumes the sole responsibility to pay for any additional costs above the amount of the total budgeted funding allocated to it. A county could experience a growth in the cost of the optional program if, for example, the caseload grows beyond the caseload in place on July 1, 2014. Budget–related legislation gives counties the flexibility to opt out of participating in the program if they provide a 120–day notice to DSS and a 90–day notice to the relative caregiver.
Minimum Age Requirement for Group Home Employees. Effective October 2014, budget–related legislation created a new minimum age requirement of 21 years of age for group home employees and managers who provide direct care and supervision to group home residents.
Support for Undocumented, Unaccompanied Minors
In response to an increase in the number of unaccompanied, undocumented immigrant minors in California, 2014–15 budget–related legislation affirms the right of state courts to make the findings necessary to enable a child to petition the United States Citizenship and Immigration Service to be classified as a special immigrant juvenile (SIJ). Once this SIJ status is granted, the child is eligible to become a lawful permanent resident. Additionally, the budget provides $3 million from the General Fund for DSS to contract with qualified nonprofit legal services organizations to provide legal services to these minors in the state. Future–year support for these activities is subject to available funding.
Background. The Global Warming Solutions Act of 2006 (Chapter 488, Statutes of 2006 [AB 32, Nuñez/Pavley]), commonly referred to as AB 32, established the goal of reducing greenhouse gas (GHG) emissions statewide to 1990 levels by 2020. In order to help achieve this goal, the California Air Resources Board (ARB) adopted a regulation that establishes a cap–and–trade program that places a “cap” on aggregate GHG emissions from entities responsible for roughly 85 percent of the state’s GHG emissions. To implement the cap–and–trade program, ARB allocates a certain number of carbon allowances equal to the cap. Each allowance equals one ton of carbon dioxide equivalent. The ARB provides some allowances for free, while making others available for purchase at auctions. Once the allowances have been allocated, entities can then “trade” (buy and sell on the open market) the allowances in order to obtain enough to cover their total emissions for a given period of time.
The ARB has conducted eight auctions since November of 2012, which have generated a total of $833 million in state revenue. Future quarterly auctions are expected to raise additional revenue. Auction revenues are deposited into the Greenhouse Gas Reduction Fund (GGRF) for expenditure by various entities. In 2013–14, $500 million in cap–and–trade auction revenue was loaned to the General Fund. In addition, the Legislature approved emergency drought legislation in February 2014 that, among other changes, appropriated $40 million from the GGRF for the Department of Water Resources (DWR) and the California Department of Food and Agriculture (CDFA) to implement water–efficiency projects. This included $20 million for water conservation grants, $10 million for more water efficient irrigation systems, and $10 million to install a more energy–efficient turbine at a State Water Project facility.
Expenditure Plan for 2014–15. As shown in Figure 15, the 2014–15 budget includes $832 million from the GGRF for various programs designed to reduce GHG emissions. This includes:
- High–Speed Rail ($250 Million). The budget includes $250 million to support the (1) environmental planning and permitting activities for the first phase of the state’s high–speed rail project (service between San Francisco and Anaheim) and (2) purchase of land and some construction activities for the Initial Operating Segment (from Madera to the San Fernando Valley). According to the administration, the availability of a high–speed rail system in California will reduce vehicle miles traveled in cars, as well as planes.
- Low Carbon Transportation ($200 Million). This program will allow ARB to fund several activities designed to encourage the purchase and use of vehicles that produce lower carbon emissions. This includes incentive programs for zero and low–emission passenger vehicles, clean buses and trucks, and sustainable freight technology.
- Affordable Housing and Sustainable Communities ($130 Million). The budget includes $130 million for the Strategic Growth Council to provide grants to local agencies for projects designed to reduce GHG emissions through land use, housing, transportation, and agricultural land preservation practices. This could include affordable housing projects that support infill and compact development, transit projects that support ridership, and active transportation projects for pedestrians and bicyclists.
- Low–Income Weatherization and Solar Programs ($75 Million). The Weatherization Assistance Program is administered by the Department of Community and Services Development and provides low–income Californians with weatherization services such as weather stripping, insulation, and water heater replacement. In addition, the department administers programs that install solar photovoltaic systems on low–income homes. Historically, the above programs have been funded by federal monies.
- Low Carbon Transit ($25 Million). Under this program, the Department of Transportation (Caltrans) will provide grants to local transit agencies for new or expanded bus or rail services or expanded intermodal transit facilities. In order to be eligible for funding, local agencies will have to demonstrate that projects will reduce GHG emissions by increasing people’s use of these forms of transportation.
- Sustainable Forests ($25 Million). Funding for sustainable forests would support programs administered by the California Department of Forestry and Fire Protection (CalFire) that could reduce GHG emissions by increasing the number and health of forests, as well as reducing the frequency and severity of wildland fires. This could include: (1) CalFire’s vegetation management program, which is a cost–sharing program with landowners; (2) the forest legacy program, which invests in forestlands to prevent conversion to non–forest use; (3) reforestation services; (4) research at demonstration state forests and cooperative wildlands; (5) forest pest control programs; and (6) the forest practice program, which regulates timber harvests.
- Transit and Inter–City Rail ($25 Million). The California Transportation Agency will administer this program to award grants to public entities to improve intercity, commuter, and urban rail systems. This could include capital or operational investments designed to reduce GHG emissions by, for example, increasing rail ridership through better integrating different rail systems with each other and with other transportation systems.
- Waste Diversion ($25 Million). This program is designed to increase recycling and composting through grant and loan programs administered by the Department of Resources Recycling and Recovery (CalRecycle). Increased recycling and composting would reduce GHG emissions by: (1) reducing methane emissions by diverting organic waste from landfills, and (2) increasing recycling, which could produce fewer GHG emissions than manufacturing new products.
- Wetlands and Watershed Restoration ($25 Million). This funding would support Department of Fish and Wildlife (DFW) grants for ecosystem restoration throughout the state, which would increase the amount of land that can naturally capture and store carbon. The funding could also be used to support measures to reduce the energy needed to transport water to wetlands currently managed by DFW.
- Energy Conservation Assistance Account (ECAA) for Public Buildings ($20 Million). The ECAA program, administered by the Energy Resources Conservation and Development Commission, provides low and no–interest loans to state and local governments, schools, colleges, and public hospitals to implement projects that will reduce energy usage. These can include updating lighting systems, installing insulation, and improving air conditioning and heating systems. It can also include energy generation, such as installing rooftop solar systems.
- Urban Forestry ($17 Million). This program will fund CalFire’s program that provides local assistance grants for urban and community forestry. This is intended to increase the number of trees that can capture and store carbon.
- Agricultural Energy and Operational Efficiency ($15 Million). This funding is provided to CDFA to support (1) grants for “digesters” that capture methane from animal waste in order to generate electricity or create transportation fuel and (2) development of technical standards that would allow low–carbon agricultural biofuels to be sold in California.
Figure 15
Cap–and–Trade Expenditure Plan
(Dollars in Millions)
|
2014–15 Expendituresa
|
|
|
Program
|
Amount
|
|
High–speed rail
|
$250
|
|
Low carbon transportation
|
200
|
|
Affordable housing and sustainable communities
|
130
|
|
Low–income weatherization and solar
|
75
|
|
Low carbon transit
|
25
|
|
Sustainable forests
|
25
|
|
Transit and intercity rail
|
25
|
|
Waste diversion
|
25
|
|
Wetlands and watershed restoration
|
25
|
|
ECAA for public buildings
|
20
|
|
Urban forestry
|
17
|
|
Agricultural energy and operational efficiency
|
15
|
|
Total
|
$832
|
|
Ongoing Expenditures Beginning in 2015–16
|
|
|
Program
|
Percent of Revenues
|
|
High–speed rail
|
25%
|
|
Affordable housing and sustainable communities
|
20
|
|
Intercity rail capital
|
10
|
|
Low carbon transit operations
|
5
|
|
Other programs—allocations determined in future
|
40
|
|
Total
|
100%
|
The budget also provides $7.5 million from the GGRF for the ARB to perform coordination, analytical, and other administrative functions related to the expenditure of cap–and–trade auction revenues. Budget trailer legislation also includes a one–time transfer of $30 million in 2013–14 from the GGRF to the ARB to support the Clean Vehicle Rebate Program and the Hybrid and Zero–Emission Truck and Bus Voucher Incentive Project. This transfer replaces funding previously provided on a one–time basis from the Vehicle Inspection and Repair Account. In addition, the budget assumes the GGRF receives repayment of the first $100 million of the $500 million loan to the General Fund.
Expenditure Plan for Future Years. Budget trailer legislation specifies how the state will allocate most cap–and–trade auction revenues in 2015–16 and beyond. For all future revenues, the legislation continuously appropriates (1) 25 percent for high–speed rail, (2) 20 percent for affordable housing and sustainable communities grants (with at least half this amount for affordable housing), (3) 10 percent for inter–city rail capital projects, and (4) 5 percent for low carbon transit operations. The remaining 40 percent would be available for annual appropriation by the Legislature. The legislation also requires that when the remaining $400 million from the loan made from the GGRF to the General Fund is repaid, that the funding be directed to high–speed rail.
The 2014–15 budget provides a total of $8 billion from various funds for programs administered by the Natural Resources and Environmental Protection Agencies. This is a decrease of $2.6 billion, or 24 percent, when compared to revised 2013–14 expenditures. Most of this reduction reflects lower bond expenditures in 2014–15.
2014 Drought Legislation. In February 2014, the Legislature approved and the Governor signed two bills—Chapter 2, Statutes of 2014 (SB 103, Committee on Budget and Fiscal Review) and Chapter 3, Statutes of 2014 (SB 104, Committee on Budget and Fiscal Review)—that appropriated a total of $687 million from various fund sources (including $75 million General Fund) in 2013–14 to address the state’s drought. This included funding for local water supply projects, flood protection, groundwater management activities, as well as employment, housing, and food assistance for individuals affected by the drought. In addition, the 2014–15 Budget Act includes an additional $151 million ($123 million General Fund) in mostly one–time funding for drought–related activities, such as for fire suppression and prevention and habitat protection. Figure 16 lists the drought–related funding provided in 2013–14 and 2014–15, and several of these activities are described in more detail elsewhere in this report where we describe the major budget changes for the affected departments.
Figure 16
Drought–Related Appropriations for 2013–14 and 2014–15
(In Millions)
|
Purpose
|
Department
|
2013–14
|
2014–15
|
Totals
|
|
Grants for local water supply projects
|
Water Resources
|
$472.5
|
—
|
$472.5
|
|
Flood control projects
|
Water Resources
|
77.0
|
—
|
77.0
|
|
Increased fire suppression and prevention
|
Forestry and Fire Protection
|
—a
|
$66.0
|
66.0
|
|
Actions to protect fish and wildlife
|
Fish and Wildlife
|
2.3
|
38.8
|
41.1
|
|
Food assistance
|
Social Services
|
25.3
|
5.0
|
30.3
|
|
Groundwater cleanup and sustainable management
|
Water Resources/SWRCB
|
14.0
|
9.1
|
23.1
|
|
Housing assistance
|
Housing and Community Development
|
21.0
|
—
|
21.0
|
|
Grants for projects that save water and energy
|
Water Resources
|
20.0
|
—
|
20.0
|
|
Emergency water supply activities and education
|
Water Resources
|
1.0
|
18.1
|
19.1
|
|
Emergency drinking water supplies
|
Public Health
|
15.0
|
—
|
15.0
|
|
Drought response and water efficiency
|
California Conservation Corps
|
13.0
|
—
|
13.0
|
|
Grants for irrigation improvements to save water and energy
|
Food and Agriculture
|
10.0
|
—
|
10.0
|
|
SWP water–energy efficiency
|
Water Resources
|
10.0
|
—
|
10.0
|
|
Emergency regulations and enforcement
|
SWRCB
|
2.5
|
4.3
|
6.8
|
|
Drought response coordination and guidance
|
Office of Emergency Services
|
1.8
|
4.4
|
6.2
|
|
Water conservation in state facilities
|
General Services
|
—
|
5.4
|
5.4
|
|
Training for workers affected by drought
|
Employment Development
|
2.0
|
—
|
2.0
|
|
Totals
|
|
$687.4
|
$151.1
|
$838.5
|
As shown in Figure 17, the budget includes $4.4 billion (including $2.3 billion from the General Fund) for the support of various resources programs in 2014–15. This is a decrease of $3.1 billion, or 41 percent, from the revised 2013–14 spending level. Most of this reduction in year–over–year spending is attributable to a decline in bond fund spending.
Department of Forestry and Fire Protection
Figure 17
Resources Budget Summary
(Dollars in Millions)
|
|
2012–13
|
2013–14
|
2014–15
|
Change From 2013–14
|
|
Amount
|
Percent
|
|
Expenditures
|
|
|
|
|
|
|
Department of Forestry and Fire Protection
|
$934
|
$927
|
$1,009
|
$82
|
9%
|
|
General obligation bond debt service
|
888
|
1,008
|
972
|
–36
|
–4
|
|
Department of Parks and Recreation
|
530
|
623
|
557
|
–66
|
–11
|
|
Energy Resources Conservation
|
300
|
613
|
505
|
–108
|
–18
|
|
Department of Water Resources
|
483
|
2,693
|
429
|
–2,264
|
–84
|
|
Department of Fish and Wildlife
|
309
|
418
|
406
|
–12
|
–3
|
|
Wildlife Conservation Board
|
75
|
602
|
106
|
–496
|
–82
|
|
Department of Conservation
|
79
|
113
|
87
|
–26
|
–23
|
|
California Conservation Corps
|
79
|
94
|
80
|
–15
|
–15
|
|
Other resources programs
|
259
|
398
|
254
|
–144
|
–36
|
|
Totals
|
$3,936
|
$7,488
|
$4,406
|
–$3,082
|
–41%
|
|
Funding
|
|
|
|
|
|
|
General Fund
|
$2,096
|
$2,234
|
$2,260
|
$26
|
1%
|
|
Special funds
|
888
|
1,412
|
1,400
|
–12
|
–1
|
|
Bond funds
|
806
|
3,586
|
529
|
–3,057
|
–85
|
|
Federal funds
|
145
|
255
|
217
|
–39
|
–15
|
The budget provides $1 billion from various funds for support of CalFire in 2014–15. This is an increase of $82 million, or 9 percent, from estimated current–year expenditures. (This does not include spending which will be reimbursed from other governments for cooperative fire protection, which is expected to be $406 million in 2014–15.)
Drought–Related Funding. The budget provides a one–time increase of $66 million and 259 temporary positions to address heightened fire risk related to drought conditions. This includes: (1) $53.8 million (General Fund) to continue firefighter surge capacity, retain seasonal firefighters beyond the budgeted fire season, and enhance air attack capabilities to suppress wildfires; (2) $10 million (State Responsibility Area [SRA] Fire Prevention Fund) for local grants for fire prevention projects or for public education; and (3) $2.2 million (SRA Fire Prevention Fund) for additional defensible space inspectors.
SRA Protection Adjustment. The budget provides $14.2 million ($13.5 million General Fund and $670,000 SRA Fire Prevention Fund) to support 62.5 permanent positions in order to expand CalFire fire protection to 92,000 acres of high–risk, high–value land around the Lake Tahoe basin, Idyllwild (Riverside County), and Big Bear Lake (San Bernardino County). Fire protection in these areas was previously provided by federal agencies under a long–term, cooperative agreement between CalFire and the federal government. However, CalFire and the federal government determined that CalFire was better suited to provide primary fire protection in areas such as these that have a large number of homes in wildland areas.
Fireworks Disposal. The budget includes one–time funding of $1.5 million (Toxic Substances Control Account) for the State Fire Marshal’s Fireworks Disposal Program to address the stockpiles of about 400,000 pounds of seized illegal fireworks in need of disposal.
Department of Parks and Recreation (DPR)
The budget provides a total of $557 million for support of DPR. This is a decrease of $66 million, or 11 percent, from estimated prior–year expenditures. Most of this reduction reflects bond expenditures in 2014–15. The budget includes $118 million from the General Fund, $112 million from fees paid by park visitors, $180 million in other special funds, $98 million in bond funds, and $49 million in federal funds. Major expenditures include one–time increases of (1) $14 million (State Parks and Recreation Fund [SPRF]) to backfill expiring funding sources and continue the existing levels of service in 2014–15 and (2) $19.2 million (Proposition 84) to develop camping and day use beach access at the Fort Ord Dunes State Park in Monterey County. The budget also includes $521,000 (SPRF and the Lake Tahoe Conservancy Account) for the department to take over the operation and maintenance of Kings Beach SRA from local government.
Department of Water Resources
The budget includes $429 million from various fund sources to support DWR, a net reduction of about $2.3 billion, or 84 percent, from the revised 2013–14 level. This is primarily due to a reduction in planned bond expenditures. The budget does, however, include funding increases for certain DWR–related programs.
Drought–Related Funding. The budget provides $18.1 million (General Fund) to DWR for various emergency water supply activities in 2014–15. Most of this funding would support (1) improving monitoring of drought conditions and hydrology, (2) expediting water transfers, (3) helping local agencies assess and improve their drought response efforts, (4) overseeing state drought response, and (5) continuing a water conservation education campaign. The funding provided would support 72 existing positions that are being redirected towards drought activities. In addition, the budget includes provisional language that would allow the Director of Finance to allocate some expiring bond funds to fund installation of temporary barriers in the Sacramento–San Joaquin Delta in case they are necessary to preserve water quality.
Groundwater Management. The budget includes $5.4 million from the General Fund and five new positions for DWR to (1) comprehensively assess the water quality of and supply available in the state’s groundwater basins, (2) define “sustainable” groundwater management, (3) review groundwater management plans developed by local agencies, and (4) develop an IT system so that individuals who drill wells can submit well records online. (The drought legislation discussed above included an additional $1 million for these purposes.) In part, these resources will be used to implement three policy bills designed to improve groundwater management by requiring local management of groundwater in certain areas, as well as establishing state oversight of groundwater pumping.
Department of Fish and Wildlife
The budget includes $406 million from various fund sources to support DFW, a net reduction of $12 million, or 3 percent, from the revised 2013–14 level. This is primarily due to a reduction in planned bond expenditures. The budget does, however, include increased funding for certain DFW–related programs.
Oil Spill Response and Recovery. The budget provides an increase of $8.7 million from the Oil Spill Prevention Administrative Fund to expand DFW’s oil spill prevention and response activities to include the prevention of inland spills. (Previously, the department’s authority was limited to preventing marine spills and responding to both marine and inland spills.) This amount includes (1) $6.2 million and 38 permanent positions to expand prevention activities and respond to a greater number of inland spills as significantly more oil is transported over land and (2) $2.5 million (including a $2 million fund shift) to treat wildlife affected by an oil spill. In order to fund these activities, the budget package expands an existing fee on oil brought into California over marine waters to all oil delivered to California refineries.
Marijuana Enforcement. The budget provides $1.5 million to DFW from various sources to assess the impacts of marijuana cultivation on the environment, educate growers on permitting requirements (such as for altering streams or diverting water), and enforce laws relating to illegal cultivation of marijuana. This program will be operated in coordination with SWRCB, as discussed below. The budget package also includes statutory changes to allow DFW to administratively impose civil penalties for the production of controlled substances on public or private lands.
Drought–Related Funding. The budget provides $38.8 million (mostly General Fund) and 13 one–year limited–term positions for various emergency actions to protect fish and wildlife during the drought. This funding would allow the department to (1) restore habitat for vulnerable fish species such as salmon and steelhead, (2) improve the technology used to monitor the locations and prevalence of fish, (3) continue key drought response activities such as emergency permitting and consultation with other state agencies, and (4) improve water use on state wildlife refuges.
Department of Conservation (DOC)
The budget provides a total of $87 million for the DOC from various funding sources, a net decrease of $26 million, or 23 percent, from the revised 2013–14 level. The budget includes a roughly one–third increase in existing building permit fees to generate $1.5 million for the department’s work identifying and mapping fault zones.
Hydraulic Fracturing. The budget includes $18.7 million from increased fees on oil and natural gas produced in California for DOC to regulate well stimulation techniques such as hydraulic fracturing (commonly referred to as “fracking”) as required by Chapter 313, Statutes of 2013 (SB 4, Pavley). Specifically, SB 4 requires the development of regulations, a permitting process, and public notification and disclosure of wells that will undergo fracking and the types of chemicals used for these processes. The funds for DOC would support engineering and geological workload, such as monitoring compliance with state regulations at extraction sites, as well as completion of a legislatively mandated study and environmental review. Funds for DOC—as well as related efforts by SWRCB and ARB—will be generated by increased fees on oil and natural gas produced in California.
Other Resources Programs
Climate Change Activities. The budget provides $8 million on a one–time basis for climate change activities in the resources program area. This includes (1) $2.5 million (transferred from the Environmental License Plate Fund [ELPF] into a new California Climate Resilience Account) to support coastal zone management planning and activities that address the risks and impacts of climate change, (2) $5 million (ELPF) for the Secretary for Natural Resources Agency to complete the fourth climate change assessment, and (3) $529,000 (Cost of Implementation Account) for the agency to develop a forest carbon plan and complete other activities related to the AB 32 Scoping Plan.
California Coastal Commission. The budget provides a temporary increase of $3 million (mostly ELPF) for the commission to support the local coastal plans that local governments within the coastal zone develop to govern land use in those areas. This activity includes helping locals develop these plans and reviewing them for consistency with state law. The budget also includes a temporary increase of $1 million in General Fund support for grants to local governments, in order to help ensure that local plans are completed and up to date.
As shown in Figure 18, the budget includes $3.6 billion (mostly from special funds) for various environmental protection programs. This is an increase of $508 million, or 17 percent, from the revised 2013–14 spending level. This increase largely reflects additional funding from cap–and–trade auction revenues (described earlier in this report), as well as the transfer of the state’s drinking water program to the SWRCB, as described in more detail below.
Figure 18
Environmental Protection Budget Summary
(Dollars in Millions)
|
|
2012–13
|
2013–14
|
2014–15
|
Change From 2013–14
|
|
Amount
|
Percent
|
|
Expenditures
|
|
|
|
|
|
|
Department of Resources, Recycling, and Recovery
|
$1,459
|
$1,475
|
$1,491
|
$16
|
1%
|
|
State Water Resources Control Board
|
629
|
743
|
949
|
207
|
28
|
|
Air Resources Board
|
326
|
535
|
821
|
285
|
53
|
|
Department of Toxic Substances Control
|
155
|
191
|
189
|
–3
|
–1
|
|
Department of Pesticide Regulation
|
78
|
82
|
83
|
1
|
1
|
|
Other environmental programs
|
35
|
36
|
37
|
1
|
4
|
|
Totals
|
$2,682
|
$3,062
|
$3,570
|
$508
|
17%
|
|
Funding
|
|
|
|
|
|
|
General Fund
|
$46
|
$51
|
$63
|
$12
|
24%
|
|
Special funds
|
2,340
|
2,528
|
2,712
|
184
|
7
|
|
Bond funds
|
52
|
281
|
427
|
147
|
52
|
|
Federal funds
|
245
|
202
|
368
|
165
|
32
|
Department of Resources Recycling and Recovery
The budget provides a total of $1.5 billion for support of CalRecycle. This is an increase of $16 million, or 1 percent, from estimated prior–year expenditures.
Beverage Container Recycling Fund (BCRF). The budget shifts some funding for the Local Conservation Corps (LCC) from the BCRF, which has a $100 million structural deficit, to three other fund sources. This shift will be phased in over two years, with the intent of maintaining total LCC funding at its prior–year levels. Specifically, in 2014–15 the budget provides (1) $4 million from the Electronic Waste Recovery and Recycling Account, (2) $2.5 million from the California Tire Recycling Management Fund, and (3) $1 million from the California Used Oil Recycling Fund, while reducing BCRF funding by the same amount ($7.5 million). (In order to be eligible to receive funding from these alternative sources, the LCCs will have to increase their recycling activities related to electronic waste, tires, and oil.) Beginning in 2015–16, the amounts provided from these special funds will double, resulting in a further reduction in funding from the BCRF. While this fund shift was part of a larger package proposed by the Governor to address the BCRF’s structural deficit, the Legislature did not approve the rest of the package.
State Water Resources Control Board
The budget includes $949 million (mostly special funds and federal funds) to support SWRCB, a net increase of $207 million, or 28 percent, from the revised 2013–14 level. This is primarily due to the transfer of the drinking water program from the DPH to SWRCB.
Drinking Water Program Transfer. The budget provides a total of $310 million in 2014–15—including $45 million for state operations and $265 million for local assistance (mostly bond and federal funding for grants)—to transfer the drinking water program from DPH to SWRCB. With the exception of $1.8 million in one–time transition expenditures, the transfer does not, on net, result in added costs or savings in the budget as a whole. In addition, the budget package includes statutory changes to improve the functioning and increase the use of a revolving loan fund associated with the program. For example, these changes allow SWRCB to lower interest rates, which could help disadvantaged communities to qualify for loans from the fund.
Drought–Related Funding. The budget provides $4.3 million from the General Fund to support 75 existing positions redirected from other tasks to perform various emergency actions related to the drought. These actions include (1) monitoring drought conditions in real time, (2) adjusting water quality regulations to ensure that the limited water available during the drought is used most effectively, (3) enforcing restrictions on water use, and (4) expediting the processing of water transfers.
Groundwater Monitoring. The budget provides a total of $9.9 million for activities relating to groundwater monitoring and management. This amount includes:
- $6.2 million from the Oil, Gas, and Geothermal Administrative Fund and 14 positions to develop and implement a program to monitor groundwater quality in areas where hydraulic fracturing is taking place.
- $1.9 million from the General Fund and ten positions to begin implementing a program to regulate some of the state’s groundwater. Specifically, SWRCB will act as a “backstop” to take over management of groundwater basins where local agencies have not sustainably managed their groundwater.
- $1.8 million from the Waste Discharge Permit Fund (WDPF)—supported by polluter fees—to change the fund source for a portion of the Groundwater Ambient Monitoring and Assessment program. This program, which was previously supported by bond funds, allows the board to monitor water quality in groundwater basins that are used for drinking water.
Marijuana Enforcement. The budget provides $1.8 million from WDPF and 11 positions to begin a pilot program to address the water quality impacts associated with marijuana cultivation on private and public lands. Specifically, SWRCB will assess the impacts of marijuana cultivation on bodies of water, educate growers on existing permitting requirements (such as related to agricultural discharges), and gather information for enforcement actions.
Air Resources Board
The budget provides a total of $821 million to the ARB, an increase of $285 million, or 53 percent, from the revised 2013–14 level. This increase largely reflects $200 million in cap–and–trade auction revenues provided to ARB for low carbon transportation programs, including an expansion of the Clean Vehicle Rebate Project. The budget also provides $7.5 million for the ARB to perform various administrative functions related to the expenditure of cap–and–trade auction revenues. These resources are primarily intended to allow the board to (1) provide other state departments implementing cap–and–trade programs with evaluation criteria and other program guidance and (2) track and report on implementation progress. The ARB will also monitor the market for cap–and–trade allowances to identify potential market manipulation. In addition, the budget includes six positions and $1.3 million for ARB to develop regulations to control and mitigate GHG emissions, “criteria pollutants,” and toxic air contaminants resulting from well stimulation.
Department of Toxic Substances Control (DTSC)
The budget includes $189 million for support of DTSC. This is a decrease of $3 million, or 1 percent, from estimated prior–year expenditures. The budget includes $5.3 million and 30.5 limited term positions in 2014–15 from the Hazardous Waste Control Account and the Toxic Substances Control Account to implement certain aspects of the department’s “Fixing the Foundation” initiative and address recent concerns regarding DTSC’s ability to carry out its responsibilities. This includes funding to address the department’s cost recovery and permit renewal backlogs, update cost estimates for site cleanups, rebuild the hazardous waste tracking system, correct errors in the hazardous waste manifest data, and implement the hazardous waste permitting work plan.
The spending plan provides $16.8 billion from various fund sources for transportation programs. As shown in Figure 19, this is a decrease of $264 million, or 2 percent, when compared to the revised level of spending in the prior year.
Figure 19
Transportation Program Expenditures
Various Funds (Dollars in Millions)
|
Program/Department
|
2012–13
|
2013–14
|
2014–15
|
Change From
2013–14
|
|
Amount
|
Percent
|
|
Department of Transportation
|
$11,702
|
$12,731
|
$11,065
|
–$1,665
|
–13%
|
|
High–Speed Rail Authority
|
231
|
620
|
1,390
|
770
|
124
|
|
California Highway Patrol
|
1,895
|
1,935
|
1,992
|
57
|
3
|
|
Department of Motor Vehicles
|
929
|
1,020
|
1,061
|
40
|
4
|
|
Transit Capital
(Proposition 1B)
|
753
|
299
|
824
|
525
|
176
|
|
State Transit Assistance
|
418
|
390
|
398
|
8
|
2
|
|
California Transportation Commission
|
56
|
28
|
28
|
—
|
—
|
|
Totals
|
$15,984
|
$17,022
|
$16,758
|
–$264
|
–2%
|
Department of Transportation
The budget plan includes total expenditures of $11.1 billion from various fund sources for Caltrans. This level of expenditures is less than in 2013–14 by roughly $1.7 billion (or 13 percent). The reduction is due primarily to lower bond spending (as discussed below). The budget provides approximately $4.2 billion for transportation capital outlay, $2.2 billion for local assistance, $1.8 billion for highway maintenance and operations, and $1.7 billion for capital outlay support (COS). The budget also provides $680 million for Caltrans’ mass transportation and rail programs, and $222 million for transportation planning. The balance of the funding goes for program development, legal services, and other purposes.
Proposition 1B Appropriations. Proposition 1B, a ballot measure approved by voters in November 2006, authorized the issuance of $20 billion in general obligations bonds for state and local transportation improvements. The budget includes total expenditures of about $1 billion of Proposition 1B funds for various Caltrans projects, which is 50 percent less than the estimated level of expenditures for 2013–14. This decline in spending reflects the fact that many of the Proposition 1B projects are completed or near completion. Much of Caltrans’ planned Proposition 1B spending in 2014–15 will be funded from appropriations approved by the Legislature in prior budgets. However, the budget does appropriate $413 million in Proposition 1B bond funds in order to complete remaining projects, procure intercity railcars, and provide grants to local agencies. The budget essentially appropriates all of the funds authorized in Proposition 1B for Caltrans projects, with only about $40 million remaining for future local projects.
Early Repayment of Transportation Loans. The budget plan includes $351 million for the early repayment of loans taken from several transportation accounts in prior years, including $337 million to the Highway Users Tax Account (HUTA). Of the total repayment, the budget allocates $210 to the State Highway Operation and Protection Program, $100 million to cities and counties for local streets and roads, $27 million for highway maintenance, $9 million for active transportation projects, and $5 million for environmental mitigation. (In addition, the budget allocates $142 million in HUTA revenues to cities and counties that were mistakenly withheld in a prior year.)
Transit and Intercity Rail Program. The budget provides $25 million from cap–and–trade auction revenues in 2014–15 to Caltrans for a new program to fund transit and intercity rail capital projects and operational improvements. The new program, administered by the California Transportation Agency, is intended to reduce GHG emissions by increasing transit and intercity rail ridership and encouraging transit and rail operators to adopt clean technologies. In addition, the budget package continuously appropriates 10 percent of future cap–and–trade auction revenues to this new program beginning in 2015–16.
COS Improvements. The budget provides $1.7 billion for 9,894 FTE staff in the COS program to support Caltrans’ capital outlay projects, which is about $20 million and 255 FTEs less than the level authorized in 2013–14. Staff in the COS program conduct environmental reviews, design and engineer projects, oversee construction, and perform various other related activities. In response to a review of the program conducted in 2013–14, the budget plan includes improvements that Caltrans will develop and implement, including:
- A data quality management plan to improve the accuracy of Caltrans’ project data.
- A “predictive tool” to improve the accuracy of Caltrans’ initial project estimates.
- Three–year workload projections by type of workload for each Caltrans district.
In addition, due to concerns about declining workload in the program and the quality of the information provided to the Legislature, the budget includes provisional language requiring Caltrans to provide information about the program to the Legislature by January 10, 2015.
Transit Programs
Proposition 1B Transit Capital. As noted above, Proposition 1B authorized the state to sell $20 billion in general obligation bonds for transportation, which includes $3.6 billion for capital improvements to local transit systems. The budget plan provides $824 million in bond funds for transit capital expenditures in 2014–15, which fully appropriates Proposition 1B funding for transit capital projects.
State Transit Assistance (STA) Program. The budget plan provides $398 million for the STA program to support local transit operations, including $25 million from cap–and–trade auction revenues. This level of expenditures is higher than in 2013–14 by roughly $8 million (or 2 percent). Cap–and–trade auction revenues are a new source of funding for the STA program and are required to support “low carbon transit”—transit operations that reduce GHG emissions, such as by expanding services to increase transit ridership. Caltrans, in coordination with the ARB, will develop guidelines for the program and determine if proposed expenditures are allowable before providing grants to transit operators. In addition, the budget package continuously appropriates 5 percent of future cap–and–trade auction revenues to the STA program beginning in 2015–16.
High–Speed Rail Authority (HSRA)
The budget plan includes total expenditures of $1.4 billion for HSRA. This is an increase of $770.4 million, or 124 percent, compared to the level of funding in 2013–14, which is due to the availability of cap–and–trade auction revenue and the timing of the expenditure of funds available for the high–speed rail project. Specifically, the $1.4 billion in total expenditures includes:
- $1.1 billion in federal funds.
- $250 million from cap–and–trade auction revenue. This includes $58.6 million for environmental planning and permitting activities for the first phase of the project (between San Francisco and Anaheim) and $191.4 million to purchase land and partially support construction of the Initial Construction Segment (from Madera to Bakersfield).
- $29.3 million loan from the Public Transportation Account to fund the operation of the HSRA while Proposition 1A bond funds are not available because of legal challenges to their use. Provisional language specifies that the loan amount could be augmented by up to $5.3 million if the administration determines that additional HSRA staff are necessary to provide project management.
As discussed earlier in this report, budget trailer legislation continuously appropriates, beginning in 2015–16, 25 percent of all cap–and–trade auction revenue for the planning and capital costs of the first phase of the high–speed rail project. The legislation specifies that such revenues could be used to repay any loans made to HSRA to fund the project.
California Highway Patrol (CHP)
The budget provides $2 billion to fund CHP operations, $57 million, or 3 percent, more than 2013–14. Almost all of this amount is from the Motor Vehicle Account (MVA), which generates its revenues primarily from driver license and vehicle registration fees. The budget includes $16 million for CHP to replace four aircraft in 2014–15 as part of an ongoing air fleet replacement plan. In addition, the budget provides (1) $32.4 million to fund the acquisition and design for five new CHP area offices in Crescent City, Quincy, San Diego, Santa Barbara, and Truckee and (2) $1.7 million for advanced planning and site selection to replace up to five unspecified additional CHP area offices. The budget also includes $9.4 million for CHP, in coordination with the Department of Justice, to expand state assistance for multijurisdictional local law enforcement operations that target organized crime.
Department of Motor Vehicles (DMV)
The budget provides $1.1 billion for DMV operations, $40 million, or 4 percent, more than in 2013–14. Of this total amount, 97 percent is from the MVA. The budget includes $67.4 million for DMV to implement Chapter 524, Statutes of 2013 (AB 60, Alejo). Specifically, the legislation requires that, beginning January 1, 2015, DMV accept driver license applications from persons who are unable to submit satisfactory proof of legal presence in the U.S. (such as a social security number), provided they meet all other application requirements and provide proof of identity and California residency. The additional funding will support 822 new limited–term positions and five temporary facilities to process additional driver license applications.
The 2014–15 budget provides $11.2 billion from the General Fund for judicial and criminal justice programs, including support for ongoing programs and capital outlay projects as shown in Figure 20 below. This is an increase of $464 million, or 4.3 percent, above the revised 2013–14 General Fund spending level.
Figure 20
Judicial and Criminal Justice Budget Summary
General Fund (Dollars in Millions)
|
Program/Department
|
2012–13
|
2013–14
|
2014–15
|
Change From
2013–14
|
|
Amount
|
Percent
|
|
Department of Corrections and Rehabilitation
|
$8,570
|
$9,306
|
$9,547
|
$241
|
2.6%
|
|
Judicial Branch
|
748
|
1,220
|
1,427
|
207
|
17.0
|
|
Department of Justice
|
154
|
178
|
194
|
17
|
9.0
|
|
Board of State and Community Corrections
|
40
|
44
|
69
|
24
|
55.0
|
|
Other criminal justice programsa
|
49
|
34
|
9
|
–26
|
–75.0
|
|
Totals
|
$9,559
|
$10,783
|
$11,246
|
$464
|
4.3%
|
Judicial Branch
The budget provides $3.4 billion for support of the judicial branch—an increase of $405 million, or 13.4 percent, from the revised 2013–14 level. This amount includes $1.4 billion from the General Fund and $499 million from the counties, with most of the remaining balance from fine, penalty, and court fee revenues. The General Fund amount is an increase of $207 million, or 17 percent, from the revised 2013–14 amount. Funding for trial court operations is the single largest component of the judicial branch budget, accounting for around four–fifths of total spending.
Trial Court Operations Funding. The budget package includes an ongoing $86 million (or 5 percent) General Fund augmentation to trial court operations in 2014–15. The administration intends to propose an additional 5 percent General Fund augmentation—$91 million—in 2015–16. (The statewide courts and branch entities—the Supreme Court, Courts of Appeal, and Judicial Council—received a General Fund augmentation of $7 million for operations and increased rent costs.) As shown in Figure 21, the $86 million augmentation reduces the amount of ongoing prior–year reductions to the trial courts to $577 million in 2014–15. The budget also assumes that $249 million in actions will be taken to help offset a large portion of this reduction. These actions were used previously, such as transfers from various special funds and revenues from fine and fee increases made in prior years. However, the budget reduces on a one–time basis an ongoing construction fund transfer by $40 million and provides an equivalent amount from the General Fund. On net, this leaves $329 million in reductions allocated to the trial courts in 2014–15, an increase of $114 million over the prior year.
Figure 21
Trial Court Budget Reductions
(In Millions)
|
|
2012–13
|
2013–14
Estimated
|
2014–15
Budgeted
|
|
General Fund Reduction
|
|
|
|
|
One–time reduction
|
–$418
|
—
|
—
|
|
Ongoing reductions (cumulative)
|
–724
|
–$664
|
–$577
|
|
Total Reductions
|
–$1,142
|
–$664
|
–$577
|
|
Actions to Address Reduction
|
|
|
|
|
Construction fund transfers
|
$299
|
$55
|
$55a
|
|
Other special fund transfers
|
102
|
52
|
52
|
|
Trial court reserves
|
385
|
200
|
—
|
|
Revenue from previously increased fines and fees
|
121
|
121
|
121
|
|
Statewide programmatic changes
|
21
|
21
|
21
|
|
Total Actions
|
$928
|
$449
|
$249
|
|
Net Reductions Allocated to the Trial Courtsb
|
–$214
|
–$215
|
–$329
|
Employee Compensation. The budget provides a $43 million General Fund augmentation for increased trial court health benefits and retirement costs from previous years. (The administration indicates that it will propose funding for similar increases in the future if trial courts make sufficient progress in implementing the Public Employees’ Pension Reform Act—state law that sets standards on employee contributions towards retirement costs.)
Fine and Fee Backfill. In recent years, the amount of fine and fee revenue collected to support trial court operations has been lower than expected. In recognition of this, the budget authorizes $31 million in additional General Fund support on a one–time basis to backfill an expected decline in fine and fee revenue in 2014–15. However, if the amount of fine and fee revenue collected to support trial court operations is greater than expected, this General Fund augmentation would be reduced accordingly.
Capital Outlay. The budget provides $329 million for various court construction projects. This amount consists of: (1) $102 million in lease revenue bond authority for the construction of three previously approved projects (Red Bluff, Los Banos, and Willows); (2) $224 million from the Immediate and Critical Needs Account (ICNA) for acquisition, design, and construction activities for 15 projects; and (3) $3 million from the State Court Facilities Construction Fund (SCFCF) for design activities for one project. (In accordance with state law, ICNA and SCFCF receive revenue from certain court fee and fine increases.) The budget also includes the reversion of nearly $72 million in unspent ICNA funds due to lower–than–anticipated acquisition costs for four projects. In addition, the budget authorizes the judicial branch to spend an additional $15 million annually for ten years from the SCFCF to fund trial court facility modification projects.
Corrections and Rehabilitation
The budget act contains $9.5 billion from the General Fund for support of CDCR. This is a net increase of $241 million, or 2.6 percent, above the revised 2013–14 level of spending. This increase primarily reflects (1) a projected increase in the prison population, (2) the expansion of the correctional officer training academy, (3) increased workers’ compensation expenses, (4) the expansion of rehabilitation programs, and (5) increased use of in–state contract beds for inmates. These increases are partially offset by additional savings primarily from the decline of the state parolee population due to the 2011 realignment, which shifted responsibility for managing many lower–level adult offenders from the state to counties.
Adult Correctional Population. Figure 22 shows the recent and projected changes in the inmate and parolee populations. As shown in the figure, the prison population is projected to increase slightly to about 138,000 inmates by the end of 2014–15. The parole population is projected to decline to about 40,000 parolees by the end of 2014–15, primarily due to the effect of the 2011 realignment.
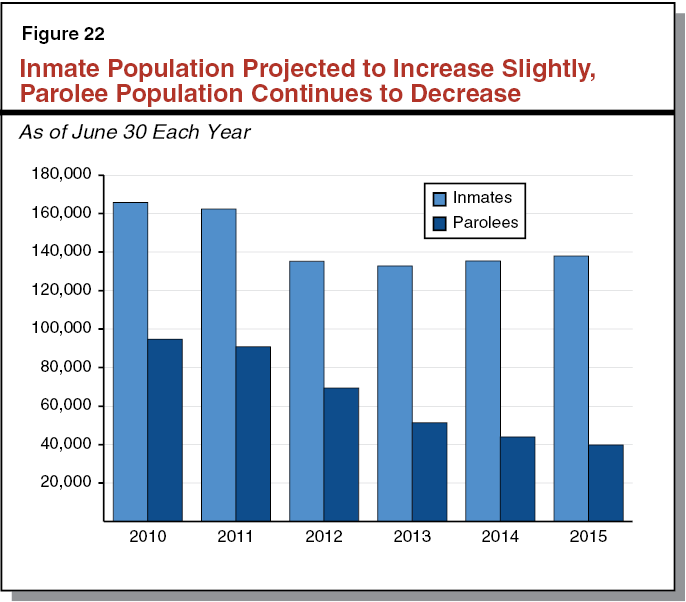
Meeting the Prison Population Cap. In January 2013, a federal three–judge panel ordered the state to reduce its inmate population to no more than 137.5 percent of the design capacity by December 31, 2013. In September 2013, the Legislature passed and the Governor signed Chapter 310, Statutes of 2013 (SB 105, Steinberg), in response to the order. Chapter 310 provided CDCR with $315 million (General Fund) in 2013–14 and authorized the department to enter into contracts to secure a sufficient amount of inmate housing to meet the court order and to avoid the early release of inmates which might otherwise be necessary. The measure also required that if the federal court modified its order capping the prison population, a share of the $315 million appropriation in Chapter 310 would be deposited into the Recidivism Reduction Fund (RRF). The court subsequently extended the deadline for the state to comply with the limit to February 28, 2016. As a result, $91 million is projected to be deposited into the RRF to support programs that reduce recidivism beginning in 2014–15.
The budget package reflects three strategies for complying with the court order in 2014–15:
- Contracting for Additional Inmate Housing. The budget includes a total of $486 million from the General Fund to house about 7,000 inmates in in–state contract beds and about 9,000 inmates in out–of–state contract beds in 2014–15. This represents an increase of about $95 million and 4,400 contract beds above the 2013–14 level.
- Reducing Recidivism. The budget package allocates a total of $95.2 million—$91 million from the RRF and $4.2 million from the Inmate Welfare Fund—for various initiatives intended to reduce recidivism and thus the prison population. As shown in Figure 23, these funds are provided to CDCR and other state agencies, such as the Board of State and Community Corrections (BSCC). For example, the budget allocates $20 million from the RRF to CDCR for community reentry facilities to provide rehabilitation services primarily to mentally–ill inmates who are approaching the end of their prison sentences.
- Implementing Court–Ordered Population Reduction Measures. The budget also includes $4.2 million from the General Fund to implement a series of court–ordered measures intended to reduce the state’s prison population. For example, the court ordered the administration to increase the amount of sentence reduction credits that certain inmates can earn for good behavior. As shown in Figure 24, the administration estimates that the various measures will reduce the prison population by around 2,000 inmates by February 2016. In ordering these measures, the court waived any conflicting statute and, thus, the administration did not require legislative approval to implement these changes.
Figure 23
2014–15 Spending to Reduce Recidivism
(In Millions)
|
Recidivism Reduction Measure
|
Department
|
Amount
|
|
Community reentry facilities
|
CDCR
|
$20.0
|
|
Reestablish Mentally Ill Offender Crime Reduction Grant program
|
BSCC
|
18.0
|
|
Competitive grants for collaborative courts
|
Judicial Council
|
15.0
|
|
Expand substance abuse treatment in prisons
|
CDCR
|
11.8
|
|
Grants to CBOs to expand community based programs
|
BSCC
|
8.0
|
|
Social innovation bonds
|
BSCC
|
5.0
|
|
Cognitive behavioral treatment at in–state contract facilities
|
CDCR
|
3.8
|
|
Grants to CBOs to expand in–prison programs
|
CDCR
|
2.5
|
|
Pilot case management program for mentally ill parolees
|
CDCR
|
2.5
|
|
Expanded provision of identification cards to inmates prior to release
|
CDCR
|
2.2
|
|
Community college grants for inmate education
|
CDCR
|
2.0
|
|
Grants to high–crime cities
|
BSCC
|
2.0
|
|
Workforce investment boards
|
EDD
|
1.0
|
|
Study of pilot youth reentry program
|
CDCR
|
0.9
|
|
Evaluation of Integrated Services for Mentally Ill Parolees program
|
CDCR
|
0.5
|
|
Total
|
|
$95.2
|
Figure 24
Population Reduction Measures—Expected Reduction in Inmates
|
Measure
|
February 28, 2016
(Final Population Deadline)
|
|
Credit enhancements
|
1,400
|
|
Parole hearings for second–strikers
|
350
|
|
Expanded medical parole
|
100
|
|
Elderly parole
|
85
|
|
Expanded alternative custody for women
|
80
|
|
Total
|
2,015
|
Workforce Issues. The budget also includes several changes related to CDCR’s workforce. For example, the budget reduces CDCR’s overtime budget by $75 million and redirects these funds to purchase leave balances from employees separating from state service ($52 million) and support health benefits for staff on leave for workers’ compensation ($23 million). In addition, the budget includes a one–time increase of $75 million for increased workers’ compensation expenses. The budget also includes $62 million to expand CDCR’s recruitment and training of correctional officer candidates.
Capital Outlay. The budget package includes $145 million in lease revenue bond funds to replace the heating, ventilation, and air conditioning system, and to repair damage caused by the deterioration of the existing system, at Ironwood State Prison in Blythe.
Other Criminal Justice Programs
2011 Realignment. As part of the 2011–12 budget package, the Legislature made a number of changes to realign certain state program responsibilities and revenues to local governments (primarily counties). In particular, the 2011 realignment requires counties to house and supervise certain lower–level felony offenders and shifts responsibility for trial court security from the state to county sheriffs. The 2014–15 budget package includes several provisions related to the 2011 realignment, including changes to:
- Split Sentencing. The 2011 realignment allows judges to sentence realigned felony offenders to “split sentences.” Offenders with split sentences serve the initial portion of their sentence in jail and the rest under community supervision. As part of the budget package, the Legislature approved the Governor’s proposal to make split sentences the presumptive sentence for these offenders. Thus, any county jail felony sentence would be a split sentence unless the judge finds that the facts of a case warrant a straight jail sentence.
- Post Release Community Supervision (PRCS) Funding. The 2011 realignment requires county probation departments to supervise nonviolent, nonserious offenders released to PRCS following their prison terms. Due to the early release of certain prison inmates that is part of the state’s plan to comply with the federal court order to reduce prison overcrowding, there will be a temporary increase in the PRCS population. In response, the budget includes $11.3 million in limited–term funding for county probation departments to supervise these offenders.
- Trial Court Security. Following the implementation of the 2011 realignment, new court facilities have been constructed in several counties. The sheriff departments in some of these counties have indicated that the new facilities have increased their court security costs above the amount of funding currently provided through the 2011 realignment. The 2014–15 budget authorizes DOF to allocate up to $1 million from the General Fund to county sheriffs for these increased costs in court facilities occupied on or after October 9, 2011. Sheriffs must demonstrate that the new court facility requires more trial court security services relative to the old facility.
BSCC. The budget includes $186 million ($69 million from the General Fund and $117 million from other funds) for BSCC, which is responsible for administering various public safety grants, overseeing local correctional standards, providing technical assistance to local criminal justice agencies, and collecting data. The budget includes a $13 million increase in funding for law enforcement grants to cities, bringing the total to $40 million. The budget also provides an additional $500 million in lease revenue bonds for adult local criminal justice facilities (such as jails or day reporting centers) to be administered by the BSCC through a competitive grant process. Medical treatment and rehabilitation program space will receive priority for these grants.
California Prison Industry Authority (CalPIA). The budget includes $15 million for the federal court–appointed Receiver—who oversees inmate medical care—to enter into a statewide contract with CalPIA to clean prison healthcare spaces at all state prisons. Under the contract, CalPIA will provide cleaning supplies, train inmate laborers to clean the facilities, and provide oversight and auditing services.
Addressing Shortfalls in Indian Gaming Funds
Currently, tribal–state gaming compacts with 46 tribes require payments into various state accounts including:
- Revenue Sharing Trust Fund (RSTF). Funds deposited into the RSTF are distributed to certain federally recognized Indian tribes that either do not operate casinos or operate casinos with less than 350 slot machines. These tribes generally each receive $1.1 million annually. In 2014–15, 73 tribes are eligible to receive such payments.
- Special Distribution Fund (SDF). State law requires that the first priority for SDF funds are to ensure that the RSTF has sufficient funds to ensure that the above payments can be made to tribes. Any remaining SDF funds may then be used to support other purposes related to gaming, including: (1) funding programs to assist people with gambling problems, (2) paying the state’s costs to regulate tribal casinos, and (3) making grants to local governments affected by tribal casinos.
- General Fund. In 2006, five tribes negotiated amendments to their existing tribal–state compacts that require payments to the General Fund instead of the SDF. The state is generally not restricted in the way it uses the payments deposited in the General Fund. However, the compacts for three of these tribes required that a portion of their General Fund payments—up to $124 million—be available annually for redirection to address shortfalls in the RSTF (such as if there are insufficient funds in the SDF for transfer to the RSTF).
In 2014–15, the RSTF is projected to have a $27 million shortfall. Similar to prior years, the budget includes a transfer of funds from the SDF to the RSTF to address this shortfall. However, the SDF is projected to have insufficient funds in 2014–15 to fully address this RSTF shortfall as well as all budgeted state regulatory and problem gambling costs. Thus, the budget also authorizes the transfer of tribal General Fund payments to address the remaining shortfall in the RSTF. We estimate that this General Fund transfer will be about $7 million in 2014–15. While this will be the first year such a transfer would been necessary, such General Fund transfers would likely be required in the short run to maintain current levels of regulatory and problem gaming services.
FI$Cal
Financial Information System for California (FI$Cal). The FI$Cal project seeks to build an integrated financial information system for the state to replace the current systems, which are fragmented and outdated. Over the last two years since the vendor was selected and the development of the system began, project staff reports coming to a better understanding of the magnitude and complexity of FI$Cal. Drawing on lessons learned over this period, the project determined a different approach would be necessary moving forward in order to mitigate the risk of a significant disruption to the project in future years. In California state government, a feasibility study report (FSR) documents the initial justification for an IT project and lays out the project plan. Any significant subsequent changes to the project plan as presented in the FSR—including changes to project scope, schedule, and/or budget—are documented in SPRs. In January 2014, the Department of Technology (CalTech) approved SPR 5 for FI$Cal, which results in a 12–month schedule extension (to July 2017) and increases the project cost by $56 million—to a total cost of $673 million.
Provides Funding for New Project Plan, Accelerates General Fund Contributions. In previous budget years, the Governor proposed, and the Legislature agreed, to accelerate special fund contributions and defer General Fund support for FI$Cal to future years. The 2014–15 Budget Act shifts from prior practice by accelerating General Fund contributions, with the General Fund supporting $94 million (or 88 percent) of the $107 million of funding provided for the project. Significant General Fund contributions are expected to continue for the duration of the project, through 2017–18. Although the mix of special fund and General Fund contributions for FI$Cal has varied considerably among budget years, upon completion, the General Fund will cover 47 percent of the total project cost, as determined in the project funding model. The 2014–15 funding allows the project to implement the changes in the new project plan, as described in SPR 5. The project deployed Pre–Wave—the first of the five implementation waves—on July 1, 2013 successfully and without incident. The next stage of the project—Wave 1—was deployed in July 2014.
21st Century (TFC) Project
TFC Project Engaged in Litigation. In 2004, the State Controller’s Office (SCO) proposed the TFC Project, the IT effort to replace the existing statewide human resources management and payroll systems used to pay roughly 260,000 state employees. The new system was intended to allow the state to improve management processes such as payroll, benefits administration, and timekeeping. In February 2013, after the project experienced various problems during the pilot stage, SCO terminated the contract with the system vendor and the project was suspended. After contractually mandated mediation with the system vendor was unsuccessful, SCO filed a lawsuit against the system vendor in November 2013 for breach of contract (the vendor issued a counterclaim against the state in April 2014).
Supports Legal Activities. The 2014–15 Budget Act provides $6.5 million ($3.6 million General Fund) to support ongoing legal activities for the TFC Project. Specifically, the spending plan includes funds for outside legal counsel to assist with legal proceedings and resources that will be used primarily to support the legal effort, including responding to public records and discovery requests and providing technical assistance to the outside legal counsel. The Governor’s proposal for the $6.5 million indicated that $2.5 million is for outside legal counsel—an amount equaling roughly one–half of SCO’s estimate of projected costs for this purpose in 2014–15. Provisional language included in the budget act authorizes DOF to augment SCO’s budget “to fund additional litigation and related support efforts associated with the TFC Project payroll system” following written notification to the Legislature. The provisional language includes no cap on the amount that DOF could authorize for the project through this budgeting mechanism.
Funds Partial–Scope Independent Assessment. Since the suspension of the project, the Legislature has indicated its support for a comprehensive independent assessment that could identify the issues that contributed to the suspension of the project, recommend opportunities for improvement, and inform the state’s decision–making on a path forward for the project. The 2014–15 Budget Act includes $2.5 million (General Fund) for an independent assessment that will (1) identify how well the current system design meets the needs of the state, (2) evaluate whether the system as designed could be used going forward, and (3) determine the cost of completing the project. Project staff indicated during budget hearings its intent to make subsequent requests in future years for assessments that evaluate alternative approaches to modernizing the state’s payroll systems and identify lessons learned through a review of project management practices. Collectively, these independent assessments should provide a comprehensive view of the issues that affected the suspension of the TFC Project and the related lessons learned.
Department of Technology
CalTech is the state’s central IT organization. It has lead responsibility for approval and oversight of state IT projects, providing data center and telecommunications services, managing IT procurement, and establishing and enforcing IT plans and policies. The department’s statutory authority was set to expire on January 1, 2015. The budget package eliminated the sunset, thereby extending CalTech’s statutory authority permanently.
Statewide Project Management Office (PMO). The 2014–15 Budget Act provides $208,000 (General Fund) to plan for the establishment of a Statewide PMO, which would create a centralized team of skilled project management professionals who would manage state IT projects throughout the state. Although the Governor proposed establishing a Statewide PMO in 2014–15, the Legislature stated its need for additional details regarding several implementation issues before the office is established. Accordingly, the budget provides limited–term positions that are tasked with planning and establishing a framework for the Statewide PMO. A report is due to the Legislature by January 10, 2015 regarding the implementation of the office, including information on the office’s resource requirements and a timeline and transition plan for the office’s creation.
Labor Programs
Interest Payment for Federal Unemployment Insurance (UI) Loan. California’s UI fund has been insolvent since 2009, requiring the state to borrow from the federal government to continue payment of UI benefits. California’s outstanding federal loan is estimated to be $8.8 billion at the end of 2014 and $7.5 billion at the end of 2015. The state is required to make annual interest payments on this federal loan, and the estimated interest costs included in the 2014–15 budget are $219 million from the General Fund.
Addressing UI Administration Funding Shortfall. Based on the administration’s January budget estimate, the cost to administer the UI program in 2014–15 was projected to be higher than the level of federal funding available by $64 million. (Traditionally, UI administration has generally been supported by federal funds.) To make up for this shortfall, the 2014–15 spending plan reflects a combination of new funding strategies for UI administration that were proposed by the Governor in January. First, the budget includes $38 million from the UI Contingency Fund to support UI administration. Second, budget–related legislation increases revenue into the UI Contingency Fund by $10 million by increasing penalties on employers who pay into the fund. This additional revenue is to be used for UI administration. Finally, budget–related legislation provides for a one–year suspension of the statutory transfer of a portion of the funds within the UI Contingency Fund to the General Fund—thereby freeing up an additional $16 million to support UI administration.
Addressing Inefficiencies and Customer Service Concerns in UI Program. In early 2013, the Employment Development Department (EDD) was able to answer only 15 percent to 18 percent of customer services calls, and delays in eligibility determinations were leading to delays in payments to claimants. The administration acknowledged that the levels of payment delays and unanswered customer service calls were unacceptable. To address these problems, EDD added staff and took various actions to improve services.
The 2014–15 budget includes the approval of the Governor’s May Revision request for $47 million General Fund ($68 million total funds) to continue EDDs efforts to improve customer service and claim processing efficiencies. With this additional funding, EDD has established the following customer service level outcome targets:
- Answer 50,000 customer calls weekly.
- Schedule 95 percent of eligibility interviews on a timely basis.
- Process 100 percent of initial UI claims within three days of receipt.
- Process 100 percent of online inquiries within five days of receipt.
The budget also includes language requiring EDD to report to the Legislature by March 1, 2015 on its progress towards meeting these program outcome targets. Additionally, this report will include a discussion of any program or process efficiencies EDD has identified that may affect the resources needed to maintain service levels.
New Contractor Registration Fee Administered by Department of Industrial Relations (DIR). The 2014–15 budget package includes legislation that, beginning July 1, 2014, requires a contractor or subcontractor wishing to bid on a public works project to pay an annual fee (currently $300) and be registered with DIR. The fee will be used to fund the cost of administering the new registration process and to monitor public works projects and enforce prevailing wage provisions. Because the oversight of public works projects will now be funded by this new revenue source, the previous requirement that the cost of enforcement be paid by the awarding body of the public works project is eliminated.
Deferred Maintenance
$200 Million Maintenance Funding Not Triggered. The budget includes $903 million in funding to address various deferred maintenance needs across the state, including $200 million in General Fund resources for various departments dependent upon specific preliminary tax revenue estimates being met (as shown in Figure 25). The availability of these funds was contingent upon a preliminary estimate of school district 2013–14 property tax revenues being higher than the administration projected in May. In July, the administration determined that this preliminary estimate of school tax revenues did not exceed the administration’s May estimates. Thus, the $200 million was not authorized.
Figure 25
“Trigger Spending” on Deferred Maintenance That Will Not Be Provideda
(In Millions)
|
State Entity
|
Amount
|
|
California State University
|
$50
|
|
University of California
|
50
|
|
Parks and Recreation
|
40
|
|
Corrections and Rehabilitation
|
20
|
|
Developmental Services
|
10
|
|
State Hospitals
|
10
|
|
General Services
|
7
|
|
State Special Schools
|
5
|
|
Forestry and Fire Protection
|
3
|
|
Military
|
3
|
|
Food and Agriculture
|
2
|
|
Total
|
$200
|
Other Non–Trigger Spending for Maintenance. The budget provides other maintenance–related funding that was not subject to the trigger. This includes $351 million for transportation projects, $189 million for the K–12 schools’ ERP, $148 million for community colleges, and $15 million for the judicial branch. These expenditures are described in more detail in the sections of this report related to these state entities.
Department of General Services (DGS)
The budget provides DGS $1 billion in 2014–15 from various fund sources (including payments from other state departments for DGS–provided services). This is an increase of roughly $20 million, or 2 percent, when compared to the revised level of spending for the prior year. The budget includes $5.4 million in one–time funding from the Service Revolving Fund for water efficiency and conservation measures—such as replacing plumbing fixtures and sprinkler heads—in state facilities. The budget also includes (1) $3.7 million (General Fund) to begin cleanup of a contaminated state–owned site, (2) $2.5 million (General Fund) for a long–range planning study of office space in the Sacramento region, and (3) $1.8 million (Service Revolving Fund) for additional staff at the Office of Administrative Hearings to address backlogs in administrative hearing time frames.
Department of Consumer Affairs (DCA)
The budget provides DCA with $593 million from various special funds that are supported mainly by licensing and other fees. This is an increase of $15 million, or 3 percent, over the estimated spending level for 2013–14. This increase primarily reflects a $13 million augmentation for enforcement and licensing activities performed by DCA boards and bureaus that regulate certain professionals and businesses (such as physicians, contractors, and private postsecondary educational institutions). The additional resources are intended to improve consumer protection by enhancing enforcement efforts and expediting the processing of disciplinary cases against licensees. The funds are also expected to improve service to licensees by reducing licensing application processing times.
Employee Compensation
Pension Costs Reflect Higher Rates. The California Public Employees’ Retirement System (CalPERS) determines what percentage of payroll the state must contribute to the system to fund employee pension benefits. Based on the higher contribution rates adopted by the CalPERS board, the budget assumes that the state’s costs to pay these benefits will increase in 2014–15 by about $600 million ($352 million General Fund). As we explain in our March 4, 2014 report, The 2014–15 Budget: State Worker Salary, Health Benefit, and Pension Costs, most of this increase reflects new actuarial assumptions related to life expectancy and pay.
Pay Increases for Most Employees. The budget assumes that the state will spend about $500 million ($220 million General Fund) for employee pay increases in 2014–15. These pay increases generally are pursuant to current memoranda of understanding (MOUs) as well as administrative policies established for employees excluded from the collective bargaining process. Most state workers will receive a 2 percent pay increase July 1, 2014. Some employees will receive higher pay increases—highway patrol officers will receive a 7 percent pay increase in July 2014 and correctional officers will receive a 4 percent pay increase in January 2015.
Potential Costs for Pay Increases. State employees in three of the state’s 21 bargaining units—Bargaining Units 2 (Attorneys), 10 (Professional Scientists), and 13 (Stationary Engineers)—are working under the terms and conditions of expired MOUs and are not scheduled to receive a pay increase in 2014–15. In the case of Bargaining Unit 2 employees, the budget does not include funds for a pay increase in 2014–15. Thus, any agreement with this Bargaining Unit that provides a pay increase would require additional funds not anticipated in the budget. In the case of Bargaining Unit 10 and 13 employees, the budget includes about $7 million ($2 million General Fund) for pay increases pursuant to an MOU that the Legislature ratified, but that the employees subsequently rejected. If the Legislature and employees ratify an agreement that includes pay increases larger than those anticipated in the rejected MOU, state costs would increase.
Higher Health Care Premium Costs for Active Employees and Retirees. The budget assumes that health premiums for state employee and retiree health benefits will increase by 8.5 percent in 2015. This increases state costs in 2014–15 by about (1) $100 million ($50 million General Fund) to pay for these benefits for active employees and (2) $160 million (most from the General Fund) to pay for these benefits for retirees. Because the actual 2015 health premium rate increases adopted by CalPERS are less than half of what was assumed in the budget, state costs could be tens of millions of dollars lower than assumed in the budget.
State Mandates (Non–Education)
Few Mandates Funded. The budget plan provides $33.8 million from the General Fund for 15 mandates primarily related to criminal justice, health, and tax administration—including two new mandates concerned with tuberculosis control and local agency ethics. The budget act suspends 62 non–education mandates, including mandates related to elections and animal shelters. When a mandate is suspended, local government compliance with the mandate’s provisions is optional during the budget year. Similar to state budget actions in recent years, the budget deferred payment for two labor relations mandates: Peace Officer Procedural Bill of Rights and Local Government Employment Relations.
Pays Down Mandate Backlog. The state owes counties, cities, and special districts about $1.9 billion for unpaid mandate claims. This debt consists of approximately:
- $900 million for claims submitted prior to 2004. State law requires these claims to be paid by 2020–21.
- $1 billion for claims submitted in or after 2004. Almost all of these claims are for mandates that the state subsequently has suspended, repealed, or substantially revised. State law does not specify a payment plan for paying these mandate obligations.
The budget appropriates $100 million to pay pre–2004 mandate claims, with three–fourths of this funding going to counties. The budget package also includes trigger language that provides additional funds to pay pre–2004 claims if General Fund revenues exceed projections. Specifically, the trigger language dictates that if the administration’s 2015 May Revision estimates for 2013–14 and 2014–15 General Fund revenues exceed the amounts included in the 2014–15 budget act, any excess revenues not needed to satisfy the Proposition 98 minimum guarantee, up to $800 million, shall be used to pay pre–2004 claims.
Alternative Funding Identified for Tuberculosis Control Mandate. Budget trailer legislation stipulates that, beginning in 2014–15, local government costs for a mandate related to tuberculosis control shall be paid through a tuberculosis control program administered by the DPH instead of the traditional mandate reimbursement process. In recognition of this change, the budget augments funding for the tuberculosis control program by $250,000.
Multifamily Housing Program
The 2014–15 Budget Act includes $100 million for the Multifamily Housing Program, which provides deferred–payment loans to developers of multifamily affordable housing projects. (The Multifamily Housing Program had been funded in the past by general obligation bonds. In 2013, however, the Department of Housing and Community Development awarded the last of these bond funds.) In order to receive state bond funds under this program, housing units must be rented to low–income Californians. One–half of the funds included in the budget will be dedicated to housing projects that also include support services, such as job training, substance abuse counseling, mental and physical healthcare, and coordinated case management.
Property Tax Administration
The 2014–15 Budget Act includes $7.5 million for the first year of a three–year pilot project, the State–County Assessors’ Partnership Agreement Program. Under this program, the state will provide grants to nine county assessors’ offices to improve local administration of the property tax. Each participating county will match the state grant dollar–for–dollar. Funds will be used to identify newly constructed or sold properties, revalue properties to their current market value, and respond to property value appeals. These activities should yield additional local property taxes, a portion of which will be directed to school and community college districts, thereby offsetting state education spending under Proposition 98.