Most school districts in the state operate school bus programs to transport a portion of their students to and from school. As a component of its recent school finance reform efforts, the Legislature requested that our office review the state’s approach to funding school transportation. Specifically, the Legislature asked us to recommend how the state might address historical funding inequities and improve incentives for local educational agencies (LEAs) to provide efficient and effective pupil transportation services.
This report responds to this request. We begin by providing background on pupil transportation in California. Next, we describe key problems with the state’s existing approach to funding the HTST program. Given the significant shortcomings of the state’s existing funding approach, we recommend the Legislature replace it with one of three alternatives we set forth in the latter half of this report. Specifically, we describe and assess the trade–offs of the following three options: (1) funding transportation services within the new LCFF, (2) creating a new, targeted program to help districts facing extraordinarily high transportation costs, and (3) creating a broad–based program whereby the state pays a share of each district’s transportation costs.
In this section, we describe the policies, ridership trends, expenditures, and funding involved in providing pupil transportation. Because the vast majority of pupil transportation services currently are run by school districts, we generally use the term “school districts” throughout this report. Many county offices of education (COEs), however, also operate transportation programs, though those programs are relatively small compared to district programs. In some cases, COE data are available and included in the numbers we provide. Only a few charter schools operate transportation programs and those programs serve an even smaller number of students. Nonetheless, in cases for which charter school data are available, we also have included them in our numbers.
State Law Allows Districts to Determine Whether to Provide Transportation. In contrast to some other states, California does not require districts to transport students who live far from school. Instead, state law allows the district governing board to provide pupil transportation “whenever in the judgment of the board the transportation is advisable and good reasons exist therefor.” Generally, the state grants districts discretion over which students they will transport and how many school bus routes they will operate.
Federal Law Requires Districts to Provide Transportation to Certain Students. Federal law requires districts to transport the following three groups of students (these requirements also apply to COEs and charter schools).
- Students With Disabilities. The federal Individuals with Disabilities Education Act requires that all districts take special steps to ensure students with disabilities receive a “free and appropriate public education.” If school officials determine transportation is necessary for a student to access his/her education, the district must provide it. (Depending on the disability and needs involved, these students may receive transportation between service providers during the school day as well as transportation to and from school.)
- Students Attending Federally Sanctioned Schools. The federal No Child Left Behind (NCLB) Act of 2001 requires schools to meet annual performance expectations. Schools receiving federal funding that do not meet these expectations are subject to sanctions that include allowing students to transfer to a higher–performing school within the district and paying to transport those students to the higher performing school.
- Homeless Students. The federal McKinney–Vento Homeless Assistance Act requires districts to provide transportation for homeless students.
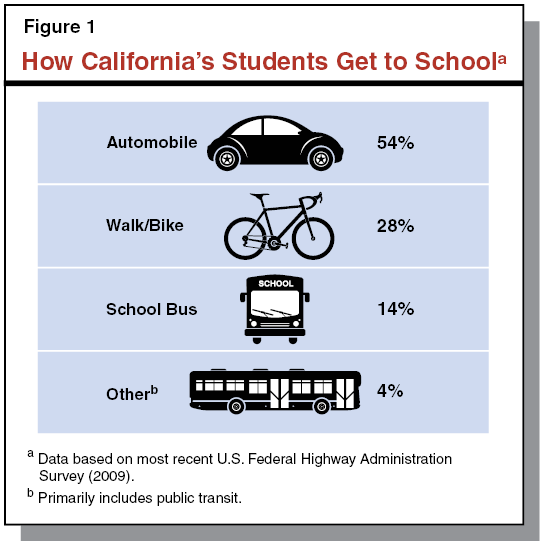
About One in Eight California Students Ride the Bus to School. Statewide data from 2011–12 (the most recent available) show that about 700,000, or about 12 percent, of California students ride the school bus on a daily basis. As shown in Figure 1, students are much more likely to get to school via private automobile or by walking or biking. (The figure shows a slightly higher percentage riding the bus—14 percent instead of 12 percent—because the data are slightly older and from a different source.) These ridership trends differ notably from many other states. Nationally, available data suggest up to 50 percent of students ride the bus to school. The difference is partially due to a greater proportion of students in California living within two miles of school (nearly 70 percent) compared with students across the nation (less than 50 percent). In addition, some states have established transportation requirements exceeding those found in federal law.
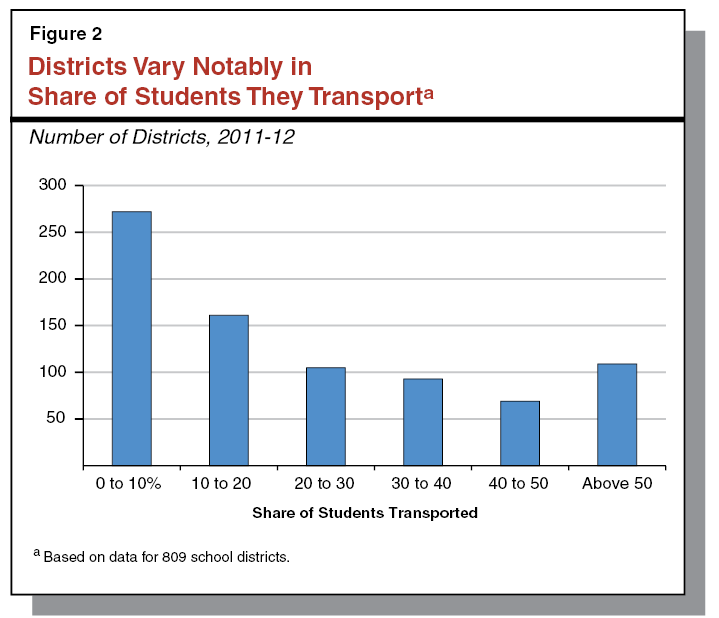
A Few Districts Transport a Significant Portion of Their Students. Although relatively few students ride the bus to school statewide, most school districts transport at least some, and a few districts transport most, of their students. Figure 2 displays the number of districts transporting various proportions of their overall enrollment. About 275 districts (just over one–quarter of the state’s roughly 950 districts) transport fewer than 10 percent of their students, whereas about 100 districts transport more than half of their students. The districts transporting larger shares of their pupils tend to have smaller enrollments, be located in more rural areas, and enroll larger proportions of students from low–income families compared to those with smaller pupil transportation programs, although these trends do not apply in all cases. (That districts with high ridership rates tend to be small helps explain how statewide average ridership remains relatively low.)
Most Pupil Transportation Offered Out of Concern That Students Might Not Otherwise Get to School. The range displayed in Figure 2 illustrates that districts differ in their decisions about what level of transportation service to offer. Most pupil transportation in California is offered at the discretion of the districts. (About one in five daily bus riders has a disability that necessitates transportation, and other federally required transportation constitutes only a minor share of ridership.) In our interviews with districts that run large transportation programs, most indicated they offer such services because many of their students lack viable alternatives for getting to school. For example, districts cited long distances between homes and schools, the absence of sidewalks, busy streets, and the presence of unsafe neighborhoods as reasons for providing bus service. (In addition to concerns about how absences affect student learning, many districts noted they provide transportation because California only provides funding for the days a student attends school, so higher absence rates would lead to funding reductions for districts.) Some districts also provide transportation for students to attend schools located outside of their neighborhoods (such as magnet schools) and because of strong parental preferences.
Sometimes Similar Districts Make Different Decisions About Transportation Services. As noted, our research identified some common trends across the types of districts that opt to run transportation programs and the reasons why districts decide to offer such services. Our review, however, revealed numerous examples of districts with similar demographics and geography that run notably different transportation programs. For example, not all districts whose students live far from school opt to offer school transportation. Because the state does not set expectations regarding what level of transportation service districts must provide, local governing boards respond differently to concerns over safety, attendance, community preferences, and other factors.
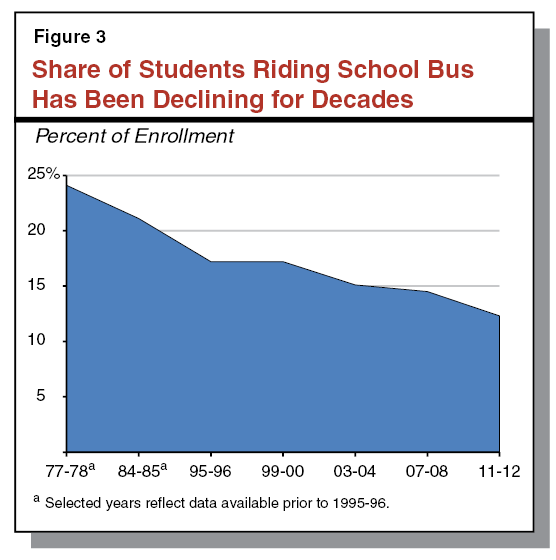
School Bus Ridership Has Been Declining for Many Years. As shown in Figure 3, over the past several decades school bus ridership has been declining. Since the late 1970s, for example, the share of students riding the bus has declined from roughly one in four to one in eight. Some of this change likely is due to demographic and societal changes. For example, California is somewhat more urbanized now—with more students living closer to school—than it was in the past. In addition, during the 1970s several districts ran large transportation programs to comply with court–ordered desegregation requirements that have since been lifted. Many districts interviewed for this report, however, noted that these trends also reflect shifting local priorities, and that their governing boards have decreased transportation services in order to fund other school programs.
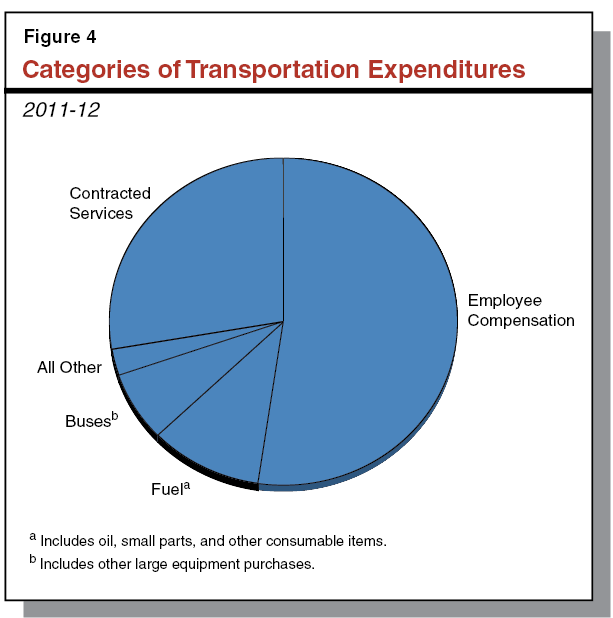
Districts Spend $1.4 Billion on Transportation. In 2011–12, districts reported spending $1.4 billion on pupil transportation. (Throughout this report, we rely on district–reported financial data collected through the state’s standardized accounting system. Though subject to some inconsistencies, these data represent the only available source of statewide expenditure information.) Figure 4 displays the major categories of district transportation expenditures. Nearly three–quarters of expenditures are for services districts provide directly, with the remainder representing payments to contracted entities such as private bus companies. As with most areas of school spending, the largest spending category is personnel. Of direct district services, nearly three–fourths of expenditures are for employee compensation, including compensation for districts’ bus drivers, dispatchers, and mechanics. Other significant expenditures include fuel (10 percent) and capital outlay for school bus purchases and other large equipment (7 percent). A few districts also fund alternative forms of transportation, such as purchasing passes for students to ride a city bus.
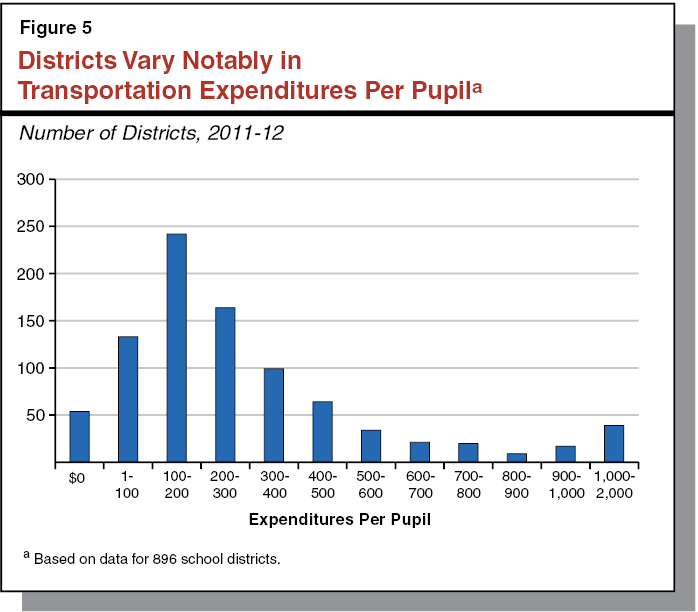
Spending Averages $240 Per Pupil, but Varies by District. Transportation spending per pupil averaged $240 during 2011–12. (This per–pupil figure is based on all pupils enrolled in a district, not just those riding the bus on a daily basis.) Similar to the variance in district transportation service levels, however, per–pupil spending rates also vary across the state. Figure 5 shows that just under 200 districts reported spending less than $100 per pupil in the district, whereas about 40 districts reported spending in excess of $1,000 per pupil.
Per–Rider Spending Also Varies by District. The amount districts spend on each student they actually transport also varies across the state. Specifically, while statewide per–rider expenditures averaged $1,800 in 2011–12, about one–quarter of districts spent less than $1,000 per rider and about one–quarter of districts spent more than $2,500 per rider. (These averages include spending for students both with and without disabilities. Districts with very high per–rider costs generally transport only students with disabilities.)
Variations in Expenditures Reflect Factors Within and Outside of District Control. Apart from how many students a district opts to transport, a number of other factors affect transportation costs. One significant factor is the share of students that has severe disabilities. Since these students frequently are provided door–to–door service, specialized buses, bus aides, and other specialized services, the average expenditure per individual rider is nearly six times higher than expenditures for other students. (Bus riders with disabilities cost an average of $6,100 annually, whereas riders without disabilities average $1,100.) Additional cost factors include the configuration and condition of local roadways, traffic conditions, and weather. These sorts of factors are outside of a district’s control. Many other cost factors, however, are directly influenced by a district, including decisions about the configuration of bus stops, bell schedules (staggering school start times often allows buses to make multiple runs), employee compensation levels, and the location of school sites.
Most Districts Fund Transportation From Two Major Sources. By far, the two largest funding sources for pupil transportation are contributions from local unrestricted revenues and the state HTST program. In addition, two other sources of revenue—federal grants and local fees—account for a small share of funding. Besides these ongoing sources of revenue, the state historically has funded a small program for certain districts to make one–time purchases of school buses, as described in the nearby box. (While below we cite the share of total statewide expenditures covered by each source, these proportions vary notably across districts based on the size of their programs, allocations of state and federal revenues, and local fee policies.)
Until 2013–14, State Funded Program for Small Districts to Purchase Buses. In addition to the Home–to–School Transportation (HTST) program, the state historically funded a school bus purchasing program for districts with fewer than 2,500 students. The program focused on replacing buses that did not meet federal standards. Most funding was awarded based on the age, mileage, and condition of the buses to be replaced. In 2012–13, $4.9 million was appropriated for the program, and 32 out of 170 applicants received grants of up to $155,000 to replace a single school bus.
2013–14 Budget Package Ends Bus Replacement Program, Merges Funding Into HTST Program. Beginning in 2013–14, the state discontinued the bus replacement program. Any district receiving bus replacement funds in 2012–13, however, had its regular HTST allocation permanently increased by that amount. That is, under current law, any district that received a one–time grant for bus replacement in 2012–13 will continue receiving this same amount but may use the freed–up funds for any transportation purpose.
Majority of Expenditures Covered With Local Unrestricted Funds. The largest source of funding for pupil transportation is from local unrestricted funds, which covered 62 percent of transportation expenditures in 2011–12—roughly $860 million. (This total also includes a small amount of funding from other state categorical programs—primarily special education—that can be used for transportation in limited cases.) Generally, districts first use any revenue available from the three funding sources described below to cover their transportation costs. To the degree these revenues are not sufficient, districts use discretionary funds to pay for their remaining expenses.
In Recent Years, State Has Appropriated About $500 Million Annually for HTST Program. The next largest funding source supporting pupil transportation services is the state HTST categorical program, which in 2011–12 totaled $491 million, covering 35 percent of total expenditures. As detailed in Figure 6, the state’s approach to funding HTST has undergone several changes since the program was established in 1947. While the program began by reimbursing districts for a share of their transportation expenditures, since the early 1980s districts have been “locked in” at the same funding levels with no adjustment for changes in costs, enrollment, or any other factor apart from uniform cost–of–living adjustments (COLAs) in some years. As noted in the figure, each district’s HTST allocation was reduced by 20 percent in 2008–09. A total of 890 school districts receive HTST funding, along with 38 COEs. (The district total includes 38 districts that receive no direct funding from the state but participate in one of several state–funded Joint Powers Authorities [JPAs]—consortia of districts organized to provide pupil transportation.)
Figure 6
Major Developments in the History of the HTST Program
|
|
|
|
1947–48
|
State Creates HTST Program.
|
|
|
- Reimburses transportation costs on a sliding scale, covering between 50 percent and 90 percent of costs beyond certain spending thresholds.
- Provides additional funding for districts with lower property tax values.
|
|
1951–52
|
State Creates a Special Education Transportation Program.
|
|
|
- Reimburses 100 percent of associated costs (up to a maximum amount per pupil) for transporting students with severe disabilities.
|
|
1981–82
|
State Revises HTST Formula (Part of State’s Larger Response to Passage of Proposition 13).
|
|
|
- Freezes funding allocations at prior–year levels.
- For future years, only mechanism to increase HTST allocations is through cost–of–living adjustments given to all districts.
- Introduces practice of making permanent, dollar–for–dollar reductions in the HTST allocation of a district failing to spend its entire allocation in a given year.
|
|
1984–85
|
State Consolidates General HTST and Special Education Transportation Funding.
|
|
|
- Freezes combined allocation at 1983–84 levels.
|
|
1992–93
|
State Establishes New HTST Spending Requirement for Students With Severe Disabilities.
|
|
|
- Requires districts to split HTST allocation into two pots, one for special education transportation (students with severe disabilities) and one for all other students, each with separate spending requirements.
- Freezes split at 1992–93 levels.
|
|
2008–09
|
State Makes Various Changes in Response to Budget Shortfall.
|
|
|
- Funding for HTST (and many other categorical programs) reduced by 20 percent.
- Continues requiring the HTST allocation to be spent on transportation, but waives requirements for many other categorical programs.
|
|
2011–12
|
State Eliminates, Then Restores HTST Program.
|
|
|
- Eliminates HTST funding when state revenues fall below projections, pursuant to “trigger cuts” included in the 2011–12 budget package.
- Subsequently rescinds cuts to HTST program.
|
|
2013–14
|
State Establishes New Funding System for Schools.
|
|
|
- Retains HTST program as a separate funding stream, freezes allocations at 2012–13 levels.
- Eliminates separate HTST spending requirements for general and special education transportation.
- Directs LAO to review HTST program and make recommendations to address historical inequities.
|
Some Federal Funds Can Be Used to Cover Mandatory Transportation. The federal government allows districts to use some federal grants to defray costs associated with providing transportation pursuant to federal requirements. In 2011–12, districts reported using about $25 million in federal funds for this purpose, sufficient to cover slightly less than 2 percent of expenditures statewide. Most of this funding is associated with Title I of NCLB and used to transport students who have opted out of attending low–performing schools.
Some Districts Charge Fees for Transportation. The final revenue source supporting pupil transportation is fees, which in 2011–12 generated $17 million and covered just over 1 percent of expenditures statewide. The state allows districts to charge fees to help cover some transportation costs under certain conditions. While districts have discretion over fee polices (including fee levels), state law specifically prohibits districts from (1) assessing fees on students who have disabilities or are indigent, (2) raising fee revenue in excess of the cost of providing transportation, and (3) charging more than the cost of providing comparable service via public transit. The first condition notably limits the degree to which districts apply fees. In 2011–12, only about 170 districts charged fees. These fees averaged about $315 per rider per year, but ranged from as low as $20 to as high as $960.
2013–14 Budget Package Initiates Comprehensive School Finance Reform. The 2013–14 budget package initiated a significant restructuring of state funding for schools. The LCFF is the centerpiece of these changes, replacing almost all former sources of state funding, including most state categorical programs. The LCFF establishes a per–pupil funding target that is adjusted for differences in grade levels but otherwise is uniform across the state. The LCFF also provides supplemental funding for districts to serve students who are low–income or English learners. The state currently is implementing the LCFF gradually by increasing funding until each district is funded at its LCFF “target” level. This transition is expected to take another seven years.
New Formula Retains HTST Funding but Freezes LEA Allocations. Although the budget package rolled most categorical programs into the LCFF, it retained HTST as a separate funding stream. More specifically, any district that received HTST funding in 2012–13 will continue to receive that same amount of funding in addition to its LCFF allocation each year. Unlike the state’s previous approach to HTST, however, these allocations will not receive future COLAs. While state law continues to require that districts spend HTST funding on pupil transportation, the state eliminated the separate spending requirement for students with severe disabilities. The state also discontinued the collection of detailed expenditure and ridership data from districts. Finally, the budget package included a temporary requirement that requires any district that transferred a portion of its HTST funding to a JPA in 2012–13 to continue transferring that same amount until the end of the 2014–15 fiscal year.
In this section, we discuss two key problems with the state’s HTST program.
Funding Allocations Are Outdated and Irrational. Because HTST allocations were locked in during the early 1980s, they fail to reflect districts’ current characteristics or level of transportation services. As a result, funding allocations now vary across similar districts for no apparent reason. Available data indicate that one–quarter of districts receive an HTST allocation sufficient to cover less than 30 percent of their costs, whereas another one–quarter of districts receive an HTST allocation that covers more than 60 percent of their costs. Figure 7 illustrates this difference. The three sample school districts provide transportation to a similar number of students at similar costs per rider, but receive notably different state funding allocations. The HTST funding allocations are particularly irrational for districts that have experienced notable demographic shifts over the past 30 years with no corresponding funding adjustment.
Figure 7
Three Districts Illustrate Disparities in HTST Funding Allocations
2011–12
|
|
Buckeye Union Elementary
|
Corning Union Elementary
|
Tulare City Elementary
|
|
Enrollment
|
5,000
|
2,000
|
9,000
|
|
Daily ridership
|
1,400
|
1,100
|
1,800
|
|
Expenditures
|
$729,000
|
$577,000
|
$984,000
|
|
Expenditures per rider
|
$520
|
$525
|
$545
|
|
HTST allocation
|
$548,000
|
$254,000
|
$223,000
|
|
Share of Costs Covered
|
75%
|
44%
|
23%
|
All Charter Schools and a Few Districts Excluded From Funding. In addition to the disparities in funding among districts receiving HTST allocations, some LEAs are excluded entirely from receiving any allocation. Most notably, all of the state’s approximately 1,100 charter schools (serving more than 450,000 students) do not receive HTST funding because charter schools were not authorized until the early 1990s. In addition, at least 20 school districts (serving more than 26,000 students) reported some transportation expenditures in 2011–12 but received no HTST funding. (These districts likely did not participate in the HTST program during the early 1980s, and therefore have been excluded ever since.)
Fundamental Questions Arise When Considering Future of HTST Funding. How the Legislature chooses to treat HTST funding moving forward will depend largely upon its perspective regarding a few key policy questions, including:
- Does transportation differ notably from other educational services such that it merits a separate stream of funding?
- Does pupil transportation represent a vital state need that—in the absence of targeted state funding—districts might choose not to prioritize?
- Should the state’s funding approach account for the diverse circumstances that districts face and the different decisions they historically have made about what transportation services to offer?
School Districts Divided on Future of HTST Funding. In 2012, we surveyed districts regarding how they thought existing state categorical programs should be treated under a new school finance system. With respect to HTST, about 40 percent of respondents preferred to maintain the existing program, about 40 percent preferred to eliminate the program, and about 20 percent preferred a restructured transportation program. This lack of consensus at the local level suggests that identifying an approach that meets the needs of all districts across the state will be difficult.
Three Options for Addressing Transportation Moving Forward. To assist the Legislature’s deliberations, we have identified three options for funding pupil transportation moving forward. The options primarily differ in the degree to which they account for transportation costs separately from the other costs districts face. These three options are to (1) fund transportation costs within the LCFF, (2) fund only extraordinary transportation costs, or (3) fund a share of all transportation costs. Although the basic approach for each option differs, all contain some key advantages. Most notably, all three options provide a means to phase out the use of allocations linked to historical factors and apply the same funding rules to all LEAs, addressing key problems with the state’s existing approach. In addition, all of the options would encourage efficiency by requiring local budgets to cover a notable share of total costs. Finally, all three options would be relatively simple to implement and easy for districts and the public to understand. In the remainder of this section, we describe each of the three options in more detail, provide the policy rationale behind why the Legislature might consider adopting it, and discuss associated costs and transition issues. (Each of these options would apply in the same way to all districts, COEs, and charter schools.)
Fund Transportation Costs Within LCFF. Under this option, the state no longer would provide additional funding for a discrete pupil transportation program. Instead, districts would pay for any transportation costs they face using their LCFF allocations. Individual districts would determine what level of transportation service to provide and how much to spend providing this service.
Treats Transportation Costs Consistently With Most Other District Costs. Funding transportation costs within the LCFF would be consistent with the state’s existing approach of funding most other school costs. As described earlier, transportation expenditures vary notably across districts. So too, however, do many other district costs for which the state does not provide differential amounts of funding. The primary example is teacher salaries, which make up more than half of all district spending and vary dramatically across the state. Specifically, about one–quarter of all school districts pay a teacher with ten years of experience less than $56,000 annually, whereas another one–quarter of districts pay a teacher with comparable experience more than $67,000 annually. While these differences frequently reflect factors outside of a district’s control—such as the salary a district must pay to remain competitive in the regional job market—the state does not provide additional funding to districts located in higher–cost areas. In addition, there is evidence that regional cost variations may somewhat offset each other in many cases, further undermining the need for associated funding adjustments. For example, rural districts typically offer lower teacher salaries and spend more on pupil transportation, whereas the reverse frequently is true in urban districts.
Treats HTST Program Consistently With Most Other Categorical Programs. Funding transportation costs within the LCFF also would be consistent with the way the state has treated nearly all other categorical programs. The LCFF replaced funding for the vast majority of categorical programs with a larger, more flexible grant that districts may use for locally determined priorities. Many of these former programs funded vital activities, such as facility maintenance, instructional materials, and school safety initiatives. The Legislature determined, however, that districts are better positioned to determine exactly how much education funding should be spent on each activity. Adopting a similar approach for pupil transportation would encourage districts to make decisions about transportation in the context of all other available resources and local priorities. Conversely, retaining the HTST program could create pressure for the Legislature to reestablish categorical programs for other local activities, undermining the goal of providing state funding in a more flexible and less complex manner.
LCFF Contains Incentives to Maximize Student Attendance. Because the LCFF maintains strong fiscal incentives for districts to maximize student attendance, eliminating the separate funding stream for transportation likely would not eliminate the incentive for districts to do what is necessary—including running buses—to get students to school. That HTST funding on average has covered less than half of associated costs suggests that this program has not been the principal reason that districts historically have offered transportation services. Rather, as discussed earlier, most districts indicate that facilitating student attendance has been the primary rationale for transporting students. The existing fiscal incentives to get students to school will continue under LCFF, as district funding will continue to be linked to student attendance. Moreover, beginning in 2014–15 all districts must set annual goals around student attendance and student outcomes as part of new local accountability plans. These state funding and accountability provisions give districts strong reasons to continue providing transportation to students who otherwise would not attend school.
LCFF Provides Additional Funding to Address Transportation Costs for Low–Income Students. While districts containing more low–income students may face higher transportation costs, the LCFF provides additional funding to cover those costs. As described earlier, higher levels of school bus ridership are more common in districts serving greater percentages of low–income students. The supplemental resources LCFF provides for these students could be used for helping transport them to school.
State Could Implement New Approach Gradually. Funding transportation costs through the LCFF ultimately would represent a decrease in overall funding levels for those districts currently receiving HTST funds. This is because those districts no longer would receive HTST allocations on top of their LCFF amounts. To help mitigate this transition, the change could be implemented gradually and in a way that ensures no district receives less funding than it receives today. Similar to the multiyear approach the state currently is using to phase in the LCFF, the state could phase out HTST allocations over several years by gradually counting those allocations toward each district’s LCFF funding allocation—that is, scoring the funds towards closing the “gap” to the district’s LCFF target funding level. (This gradual approach would differ from the method used with most other categorical programs, which immediately were subsumed into the LCFF beginning in 2013–14.) This approach would allow districts to continue to receive anticipated LCFF funding increases in the coming years, albeit at lower levels. By the time the LCFF is fully implemented (projected to be in 2020–21), the supplemental HTST funding would be eliminated.
Over Time, Approach Would Free Up Funding for Other Educational Purposes. Since the state currently budgets $491 million for HTST, phasing the program out would free up a like amount of funding by the end of the transition period. The Legislature then could use these funds for any educational purpose, such as increases in LCFF base rates or special education funding to benefit all districts.
Fund Only Extraordinary Costs. Under this option, the state would provide additional funding for districts facing disproportionate transportation costs, but not for districts spending average amounts to transport students. Specifically, the state would establish a threshold at which costs notably exceed what an ordinary district pays for pupil transportation, then fund a share of the costs in excess of that threshold. For example, suppose the state set the threshold at 8 percent of a district’s budget and agreed to fund 75 percent of extraordinary expenditures. (Setting a high state reimbursement rate above the threshold would recognize that many extraordinary costs likely are beyond a district’s direct control. Maintaining a small local share, however, would help encourage districts to run programs efficiently.) In this example, a district with a budget of $100 million spending more than $8 million (8 percent of the budget) on transportation would have extraordinary costs. If this district spent $12 million on transportation, $4 million would be considered extraordinary and the state would cover $3 million (75 percent of the extraordinary cost). For all districts with transportation expenditures below the state’s established threshold, transportation costs would be funded within the LCFF (similar to Option 1).
Define Allowable Costs and Require Reporting. Under this option, the state would need to define allowable transportation costs. The state could use a definition similar to approved expenditures under the existing HTST program. (Allowable expenditures also could include a factor annualizing transportation–related capital costs, in lieu of maintaining a separate bus replacement program.) Under this option, the state also would need districts to submit transportation–related information to enable tracking of service levels and verification of allowable cost claims.
Most Districts Do Not Face Extraordinary Transportation Costs. . . Most districts dedicate roughly the same share of their budgets to pupil transportation, suggesting most do not face special circumstances meriting special funding dispensations. Figure 8 shows transportation expenditures as a share of local budgets for nearly all of the state’s school districts. The figure shows that half of districts have transportation expenditures comprising 2 percent to 4 percent of their overall budgets. Moreover, the distribution in Figure 8 shows that more than 90 percent of districts spend 8 percent or less of their budget on transportation—a relatively small degree of variation across most districts in the state.
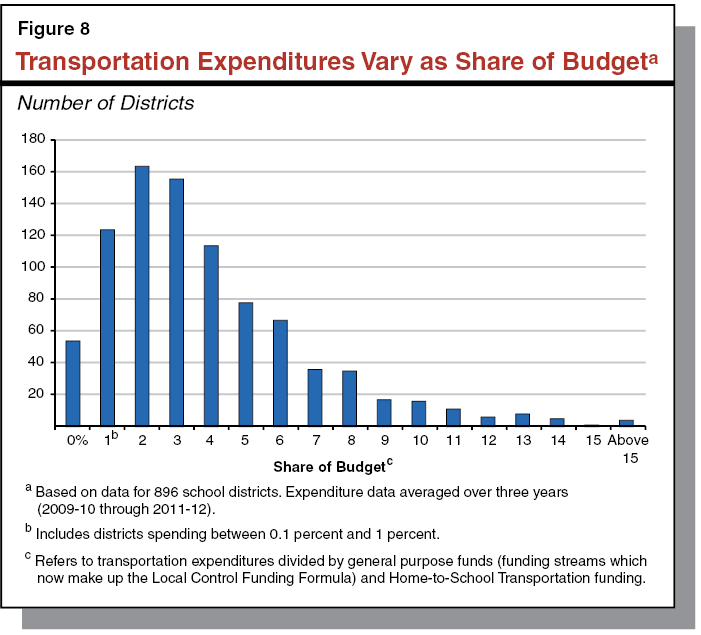
. . .But Providing Additional Funding to Those That Do Would Help Preserve Their Instructional Programs. A few districts do face special circumstances, however, such that special treatment may be merited. Providing additional funding to the few districts that face extraordinary transportation costs would help ensure that their unique conditions do not result in inferior instructional programs compared to districts with ordinary transportation needs. Figure 8 shows that a small number of school districts exhibit very high expenditures on transportation relative to their budgets. Specifically, about 70 districts, or about 8 percent of districts, spend more than 8 percent of their budget on transportation. All of these districts are located in rural areas and most are geographically isolated, generally requiring their school buses to cover more distance than is typical for other districts. The budgetary trade–offs resulting from these high expenditures likely lead to reduced spending in other areas, including instruction.
State Could Immediately Address Extraordinary Costs While Phasing Out Existing HTST Allocations. Under the extraordinary cost model, the state would phase out HTST allocations for the majority of districts—as described under Option 1—while maintaining a small amount of funding for districts with exceptionally high transportation costs. The ultimate costs of this scaled–down approach would be significantly less than the existing HTST program. For example, if the state paid 75 percent of transportation costs above an 8 percent spending threshold, we estimate it would cost roughly $10 million per year. This spending could be accommodated using a small portion of the savings that would result from phasing out the existing HTST allocations. (As under Option 1, the state could use the remaining savings at full implementation for any educational purpose.)
Reimburse Share of Approved Transportation Costs. This option would create a new formula that reimburses all districts for a portion of their transportation costs. Under this approach, the state would develop a set of allowable transportation expenditures and cover a set percentage of those expenditures in every district. (As with Option 2, allowable expenditures could include an amortized bus–replacement cost, and the state would collect information to verify expenditures.) Similar to the HTST program, this option would provide funding to most districts. Unlike the HTST program, the share of costs reimbursed would be uniform across all districts.
Significant Local Match Critical to New Approach. We believe this “share of cost” approach is most viable if the state’s share is set between 35 percent and 50 percent. A lower level would benefit too few districts to merit establishing such a formula, whereas a higher level would erode incentives to run efficient programs. As described earlier, current HTST allocations vary across districts but cover an average of 35 percent of transportation expenditures statewide. Setting the reimbursement rate at 35 percent of costs, therefore, would bring all districts up to the current statewide average. Covering this share of costs would provide additional funding to roughly one–third of districts, whereas covering 50 percent of costs would provide additional funding to more than half of all districts (but also would carry additional costs, as described later). That districts cover at least half of costs under the new formula, however, is critical to ensuring districts maintain incentives to run efficient programs. An overly high state reimbursement level could lead districts to expand service levels beyond what is needed or to run exceptionally costly programs, knowing the state will cover most of their costs. (Because of such concerns, the state rarely funds reimbursement–based categorical programs. Instead, for most programs the state sets clear service expectations and funds districts only for providing that level of service. Because pupil transportation service levels and spending vary due to such a wide variety of local factors, establishing a specific service requirement for this program is difficult. The best alternative, therefore, is to ensure a strong local incentive to contain costs.)
Addresses Main Flaws in Existing State Approach. Adopting a new transportation formula would rectify the two widely recognized problems with the state’s existing HTST program. Specifically, this approach would (1) allow funding allocations to be updated annually, and (2) provide a mechanism for previously excluded LEAs to receive funding.
State Could Transition Gradually, Protect Districts Against Funding Losses. Because the degree to which the existing state HTST allocation covers district transportation costs varies dramatically across the state, “equalizing” the state’s share of costs across all districts would require a shift in how funds are allocated. First, the state would need to increase funding for all districts currently receiving less than the state’s new reimbursement level. This could be done by increasing state funding for transportation, or by reallocating funding from districts currently receiving more from HTST than the state’s new reimbursement level. Historically, when the state has modified existing funding formulas, it has included “hold harmless” language to ensure every district receives at least as much funding as it received in the year the change is made. Should the state continue to adopt this practice, some districts would continue to receive historical funding advantages and implementing the new formula would require additional state investment. (Over time, these historical advantages would dissipate as expenditures rise and those districts do not receive additional funding increases from the state.)
Implementation Costs Depend on Transition Approach. The costs associated with adopting a share of cost formula would depend upon the level at which the state sets its reimbursement rate. Figure 9 displays estimates for state costs under various reimbursement rates. (These estimates are only rough approximations, based on district–level data from 2011–12.) At the low end, if the state were to fund 35 percent of expenditures and hold districts harmless from funding decreases, state costs would increase by roughly $120 million beyond the funding currently provided for HTST. At the high end, selecting a 50 percent share of expenditures would increase state costs by roughly $260 million. These costs could increase over time, both from inflationary pressures and potential service increases at the local level.
Figure 9
Cost of New Formula Depends on State Share
(In Millions)
|
State Share
|
Costs
|
Additional State Fundingb
|
|
New Formula
|
Hold Harmlessa
|
Total
|
|
35%
|
$490
|
$120
|
$610
|
$120
|
|
40
|
560
|
90
|
650
|
160
|
|
45
|
630
|
70
|
700
|
210
|
|
50
|
700
|
50
|
750
|
260
|
Treatment of HTST Program Glaring Exception to Reform Effort. When the Legislature adopted the LCFF, it addressed numerous historical anomalies and inequities in school funding. The maintenance of the HTST program is a glaring exception to this nearly comprehensive reform effort. With each passing year, existing HTST allocations become more disconnected from the factors that justified them in the early 1980s. Identifying a long–term solution to funding pupil transportation and addressing the problems inherent in the state’s existing approach are critical next steps in the Legislature’s goal of building a school funding system that is simple, transparent, and rational.
Several Options for Funding Pupil Transportation Exist, Any Would Represent an Improvement. This report lays out three options the Legislature could pursue in reforming its approach to funding pupil transportation. Each option varies in how many districts it would benefit, how much it would cost the state, and how many spending requirements would be associated. Which option the Legislature adopts ultimately will depend upon its policy goals for pupil transportation, how much state funding it wants to dedicate for this purpose, and which of the rationales we have laid out it finds most compelling. Despite the differences across the three options, all would represent a notable improvement over the state’s current approach.