School District Reserves Become Hot Topic. In June 2014, the state enacted a new law to cap school district reserves in years following a deposit in the state school reserve recently established by Proposition 2. This legislation also created a separate requirement for districts to disclose certain information about their reserves each year. Both provisions were introduced during negotiations with the administration shortly before the adoption of the state budget, allowing relatively little time for the Legislature to review the proposals. Since last June, members of the Legislature, school district officials, and members of the public have asked for more information about school district reserves. Why do districts have reserves? How have reserve levels changed over time? Why do reserve levels vary from district to district? Other questions have focused on how districts will respond to the cap and how the caps will affect district finances.
Report Provides Assessment of District Reserves and New Reserve Requirements. The report has five sections. First, we provide an overview of the key concepts needed to understand school district reserves. Next, we analyze trends in reserve levels over time and discuss some of the factors that cause reserve levels to vary among districts. Third, we describe the new caps and disclosure requirements in detail. Then, we describe how districts could respond to the caps. Finally, we provide our assessment of the caps and the disclosure provision and make recommendations regarding the future of these new requirements.
School District Budgets Have Multiple Accounts
School Districts Report Revenues and Expenditures for Each Account. The state requires all districts to maintain a record of their revenues and expenditures for each fiscal year. The state further requires districts to track these revenues and expenditures in different accounts. Using multiple accounts allows districts to demonstrate that public funds have been used in accordance with state and federal laws. At the end of each fiscal year, districts file a financial report with the California Department of Education (CDE) summarizing the transactions in each of their accounts. Districts also undergo annual financial audits to verify the accuracy of their financial records.
General Fund Is Main Operating Account. All districts maintain a General Fund account that receives most revenue for operating K–12 programs. Districts deposit revenue from the Local Control Funding Formula as well as most other state and federal grants into their General Fund accounts. Although some of the revenue deposited into the General Fund must be spent for specific activities, monies in the General Fund usually may be spent for any purpose. Districts pay most operating expenses, including teacher salaries, books, and utilities, from their General Fund accounts.
Other Accounts Associated With Specific Activities. In addition to the General Fund, a district can report transactions in as many as 29 special accounts. These accounts exist to segregate the transactions associated with specific activities. Districts generally engage in only a few of the possible activities requiring a special account and do not have transactions in all 29 accounts. For most districts, the largest and most commonly used special accounts are those related to capital projects. For example, districts that levy developer fees to pay for new facilities must record the associated revenues and expenditures in the Capital Facilities account. Given these types of accounts by definition serve limited purposes, the remainder of this report focuses specifically on the General Fund. (One exception involves an account known as the “Special Fund for Other Than Capital Outlay,” which functions like an extension of the General Fund in virtually all respects. Throughout this report, all references to the General Fund account are inclusive of this special account.)
Every Account Has a Reserve Balance
Reserves Change With Revenues and Expenditures Each Year. Districts rarely spend exactly what they receive in revenue each year. When revenues exceed expenditures in a particular year, the district has a surplus. When expenditures exceed revenues, the district has a deficit. Each year, districts with surpluses add to their reserves whereas districts with deficits draw down these reserves. Since districts have separate accounts, each account has its own level of reserves based on the revenues and expenditures within that account. (Accountants use the term “fund balance,” rather than “reserves,” to convey the idea that there is a residual amount, or balance, associated with each individual account, or fund.)
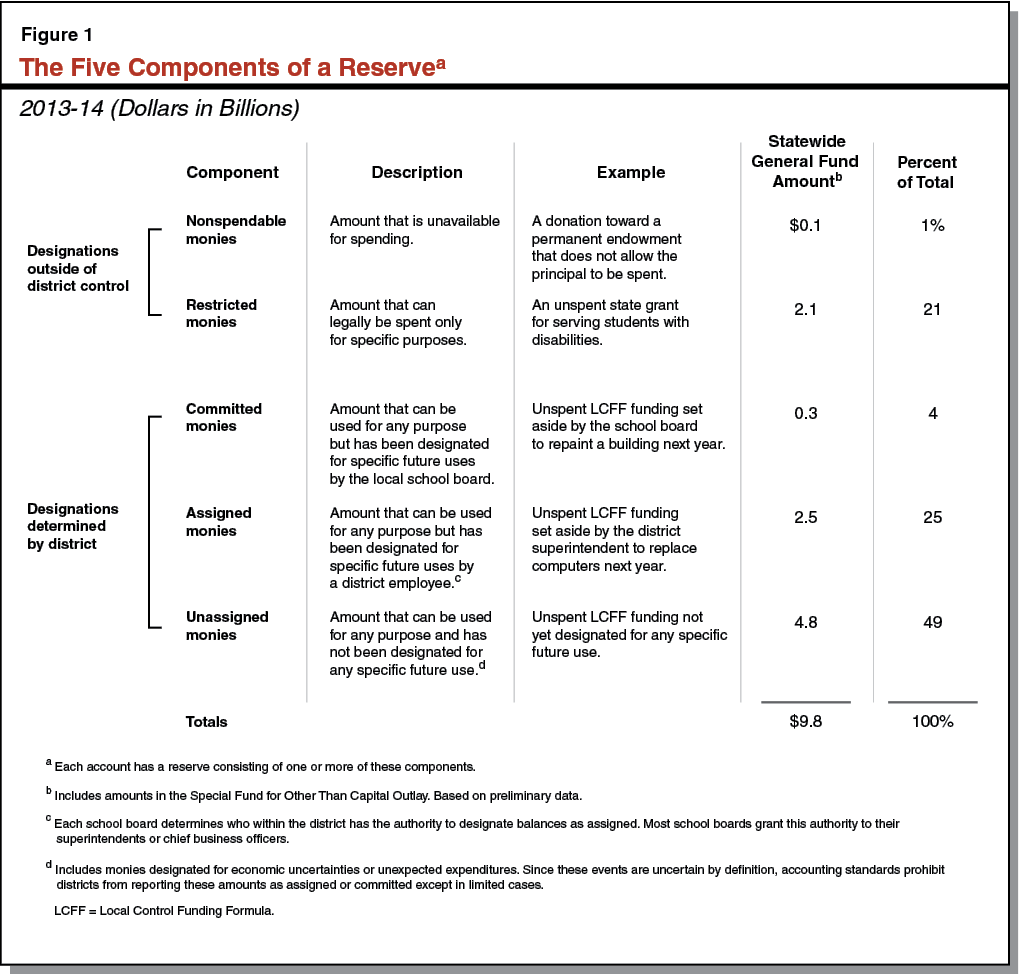
Districts Required To Categorize Monies in Their Reserves. Accounting standards and associated state regulations require districts to group the reserves within each account into five possible categories. Figure 1 describes these categories and shows the statewide totals for each category within districts’ General Fund accounts. The categories reflect varying levels of discretion that districts have in spending their reserves. Not every district will have monies to report in all five categories.
Districts Can Determine How Some Reserves Are Designated. The first two categories in Figure 1—nonspendable and restricted—show the portion of a reserve that is subject to some form of external constraint, usually a state or federal law. Two of the remaining three categories show constraints that districts can impose upon themselves. Districts use the committed and assigned categories to earmark reserves for specific future spending, such as the purchase of new textbooks. The practical difference between these two categories is whether the school board (for committed reserves) or a district official (for assigned reserves) has earmarked the monies. The unassigned category includes all amounts not designated for a specific purpose, including amounts set aside for addressing economic uncertainties. Districts that classify some part of their reserves as committed, assigned, or unassigned may later reclassify those amounts if desired. With a few exceptions, districts also can move these portions of their reserves between their General Fund accounts and their special accounts.
Reserves a Key Indicator of Fiscal Health
General Fund Reserves Are a Widely Used Measure of Fiscal Health. The General Fund reserve of a government or public agency provides a succinct summary of the financial resources available for future use. A reserve that is stable or growing slowly over time usually indicates financial viability, whereas a declining reserve can indicate difficulty aligning expenditures with revenues. Since governments follow standard conventions when reporting reserves, their reserve levels can be compared. For all these reasons, lenders, employees, and members of the public use General Fund reserve levels to assess an agency’s fiscal health and ability to address future priorities and uncertainties.
Reserves Are a Component of School District Fiscal Oversight Process. In California, General Fund reserves are a key component of the state’s system for overseeing school districts’ fiscal condition. The state requires county offices of education (COEs) to review the condition of districts within their counties at various points during the year. At each point, COEs evaluate their districts using ten criteria developed by the state, including measures of reserves, operating expenditures, and salary costs. The COEs also consider multi–year budget projections and assess any unique risks facing their districts. The COEs then make holistic judgments as to whether their districts will be able to meet their financial obligations for the current year and the upcoming two years. Under this system, no single factor is responsible for a COE’s determination. For districts that may not meet their obligations, COEs initiate additional oversight and may order districts to revise their budgets if their financial conditions do not improve. Figure 2 summarizes the minimum unassigned reserves the state expects districts to maintain under this system. As shown in the figure, the minimum reserves range from 1 to 5 percent of annual expenditures and vary based on district size.
Figure 2
State Guidelines for Minimum General Fund Reservesa
2013–14
|
District Enrollment b
|
Minimum Unassigned Reservesc
|
Applicable Districts
|
Percent of All Districts
|
Applicable Enrollmentb
|
Percent of All Enrollment
|
|
0–300
|
5%d
|
237
|
25%
|
29,758
|
<1%
|
|
301–1,000
|
4
|
164
|
17
|
93,390
|
2
|
|
1,001–30,000
|
3
|
516
|
55
|
3,693,734
|
67
|
|
30,001–400,000
|
2
|
26
|
3
|
1,157,838
|
21
|
|
400,001 or more
|
1
|
1
|
—
|
526,883
|
10
|
|
Totals
|
|
944
|
100%
|
5,501,603
|
100%
|
Fiscal Oversight Helps Districts Avoid Emergency State Loans. The purpose of the fiscal oversight process is to keep a district’s finances from deteriorating to the point that the district needs an emergency loan from the state. (In 1992, the California Supreme Court found that the state had a constitutional obligation to ensure that districts with financial problems continue to operate so that the education of students in those districts is not disrupted.) An emergency loan has serious consequences for the affected district, including the loss of all local authority to a state–appointed administrator and the obligation to repay the emergency loan with interest. The oversight system has been largely successful in avoiding these situations, with only nine districts requiring emergency loans since 1991.
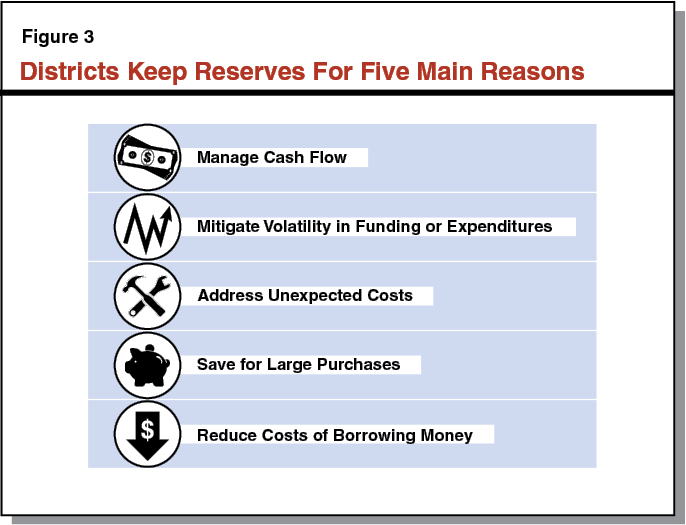
Reserves Help Districts in Five Major Ways
Apart from the desire to maintain solvency and avoid emergency loans, districts keep General Fund reserves for five major reasons. Figure 3 summarizes these reasons, which we describe below.
Manage Cash Flow. While reserves are not necessarily equivalent to cash on hand (see the nearby box), districts with higher reserves generally have more cash available than other districts. Districts use cash to meet payroll and pay bills as they arise. The largest recurring expenditure for any school district consists of salaries for employees, which districts pay throughout the year. Districts, however, do not receive all of their revenue on an even schedule. Property tax revenue, for example, arrives in two large installments (in December and April). State funding, while historically paid more evenly throughout the year, has been subject to large payment deferrals since 2008–09 (as described in the nearby box). Since districts vary widely in regards to how much revenue they receive from local and state sources, their cash flow situations vary. While districts can borrow money from investors to manage cash flow, many rely instead on their reserves.
Reserves Versus Cash
Reserves Not Always Equivalent to Cash on Hand. Although district reserves often are discussed as though they are equivalent to cash on hand, accounting conventions sometimes require districts to record revenue—and an increase in reserves—before districts actually receive the associated cash. For this reason, a portion of a reserve might not be available for immediate spending. As described below, the most significant example of the difference between reserves and cash on hand in recent years has revolved around state deferrals of school funding. (Though the reverse is possible—cash on hand in certain cases may be greater than reserves—this situation is rare, particularly during the last several years.)
State Payment Deferrals Created Large Gap Between Reserves and Cash. Since the onset of the last recession, the state has authorized some school funding in one fiscal year but not provided the associated cash until the following fiscal year. Districts record these payment deferrals as revenue in the year the payment would have been made absent the deferral. The result is that reserves in recent years have been much larger than cash on hand. State reliance on payment deferrals peaked in 2011–12, when the state deferred about $9.5 billion (20 percent) of all school funding. Largely for this reason, despite districts reporting General Fund reserves of $10.2 billion at the end of 2011–12, only about $4.3 billion of this amount equated to cash on hand. (Since other factors affect the gap between reserves and cash, this difference does not equate directly to the amount of funding deferred.) Districts eventually received the cash associated with these deferrals during the first few months of the following fiscal year.
Mitigate Volatility in Funding or Expenditures. California’s tax system relies heavily on income taxes paid by individuals and businesses, which are quite volatile revenue sources. Since more than 40 percent of the state’s General Fund expenditures relate to K–12 education, this volatility affects school funding. Districts can use reserves to even out fluctuations in state funding by increasing spending more slowly in strong economic times and reducing spending more slowly during downturns. In addition to revenue volatility, certain district expenditures (such as healthcare benefits or pension costs) can be difficult to predict precisely. Districts sometimes use reserves to address these cost increases rather than immediately reduce spending in other parts of their budgets.
Address Unexpected Costs. Whereas districts can anticipate some measure of volatility in their revenues and expenditures, other costs can arise unexpectedly. Examples include (1) special education costs for students with highly specialized needs; (2) an emergency facility repair related to a leaking roof, malfunctioning fire system, or gas leak; (3) a natural disaster, such as a drought or wildfire, that reduces student attendance and associated state funding; and (4) a lawsuit that results in a costly settlement or judgment against the district. Districts facing these unanticipated costs often draw down their reserves to address them. (This is, in part, because districts have few options for reducing expenditures during the course of the year. State law prohibits districts from laying off teachers and other certificated staff unless the district provided notice by March 15 of the prior fiscal year, and reductions in other staff take several months to implement. Midyear reductions also can be disruptive to student programs.)
Save for Large Purchases. Districts often build up reserves in order to make large one–time purchases. This approach avoids the need to borrow money. For example, districts commonly save for the upcoming replacement of (1) textbooks and related curricula; (2) computers; (3) school buses; and (4) equipment and facility components that have reached the end of their useful lives, such as worn out flooring or heating and cooling systems.
Reduce Costs of Borrowing Money. To finance the construction of school buildings and other capital projects, districts usually borrow money from investors. Before borrowing, most districts obtain a rating from one of three major credit rating agencies (Moody’s Investors Service, Standard & Poor’s Ratings Services, and Fitch Ratings). These ratings indicate the likelihood that districts will be able to repay their loans. Districts with the strongest ratings tend to pay the lowest interest rates because they represent a lower risk of defaulting on their loans. All three rating agencies consider reserves a significant factor in determining a district’s rating, noting that reserves provide additional flexibility in times of stress. Moody’s, for example, indicates that measures of General Fund reserves (in combination with cash on hand) are responsible for about 30 percent of its overall rating.
Many Districts Attempt To Keep Reserves Above State Minimums. Given the various reasons for districts to keep General Fund reserves, most districts attempt to maintain reserve levels that exceed the state minimums. A few of these districts have adopted explicit local policies defining the level of reserves they will attempt to maintain. While details vary, districts with such policies tend to seek unassigned reserves in the range of 5 to 17 percent of their expenditures. (A 17 percent reserve equals about 2 months of expenditures and is a common standard for local public agencies.)
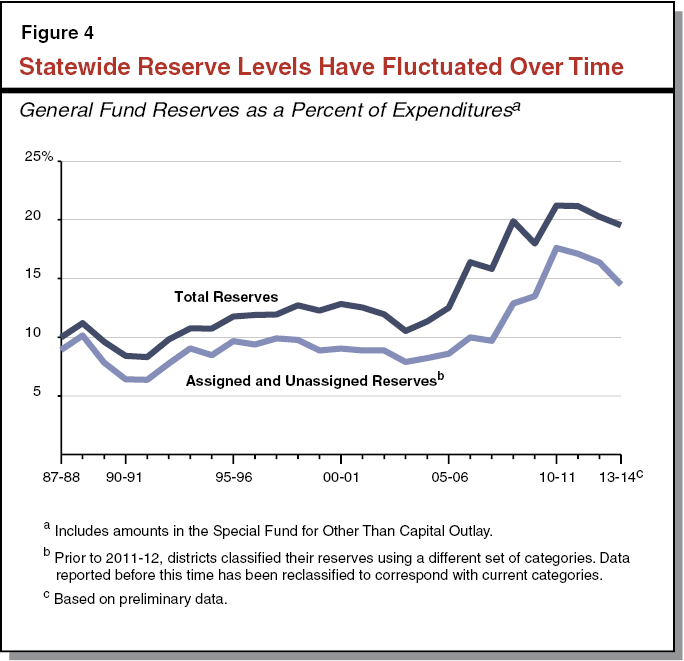
Statewide, School District General Fund Reserve Levels Have Fluctuated Over Time. Figure 4 shows how General Fund reserves (as a percent of General Fund expenditures) have changed since 1987–88. Reserves reached their lowest levels in 1991–92, when they were 8.3 percent of statewide expenditures. Reserves reached their highest levels in 2010–11, at 21.2 percent of expenditures. The two major declines in reserves (in the early 1990s and early 2000s) were both associated with economic recessions. Later in this report, we describe key factors leading to the sharp increase in reserves since 2006–07.
Reserves Vary With District Size
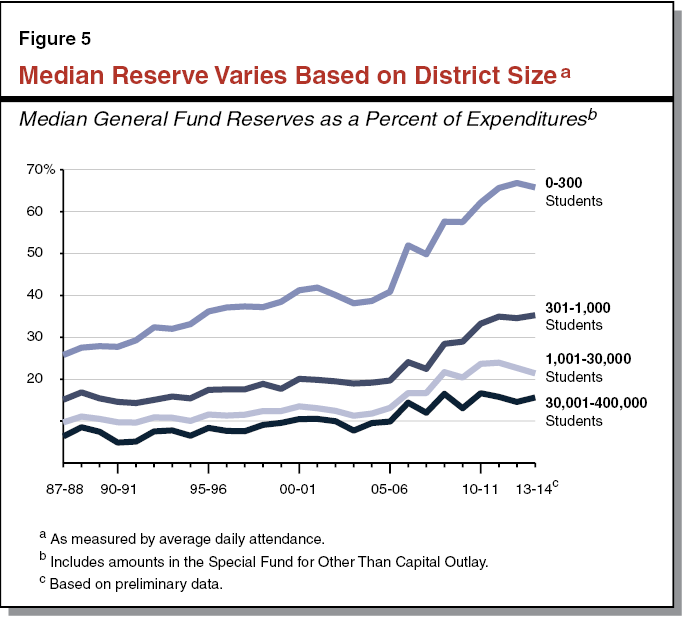
Aggregate Reserve Levels Mask Variation Based on District Size. As shown in Figure 5, a longstanding relationship exists between district size and General Fund reserves. Over the past 26 years, the state’s smallest districts have maintained reserves four–to–five times larger than the state’s largest districts. In 2013–14, for example, the state’s largest districts—those with more than 30,000 students—reported a median reserve of 15 percent of expenditures. The state’s smallest districts—those with fewer than 300 students—reported a median reserve of 66 percent.
Smaller School Districts More Easily Overwhelmed by Unexpected Costs. For smaller districts, reserves that are relatively high as a percentage of expenditures can be small in absolute terms. A single major facility repair or other large cost might require a small district to deplete most of its reserves in a single year. For districts with much larger budgets, reserves that are small as a percentage of their budgets would be large enough to cover a similar cost. Larger districts also have somewhat more flexibility to make reallocations within their budgets. A large district, for example, might respond to an unexpected facility problem at one school by delaying scheduled maintenance at another school until the following year.
Some Districts Have Relatively High Reserves for Their Size
Even Among Similarly Sized Districts, Some Districts Have Much Higher Reserves. Though district size explains much of the variation in reserve levels across districts, some districts have much higher reserves than their peers of a similar size. For example, among the state’s 516 mid–size districts (those with 1,001 to 30,000 students), the median reserve in 2013–14 was 21 percent. Forty–four of these districts, however, had reserves in excess of 42 percent. Among the state’s 237 smallest districts (those with fewer than 300 students), the median reserve was 66 percent, though 34 of these districts had reserves more than twice this level. In the remainder of this section, we describe some of the findings from our interviews and data analysis that help explain why some districts have higher reserves than their peers.
Districts With Higher Reserves Report Large Purchases and Unique Circumstances. We surveyed 28 districts with relatively large reserves for their size in 2012–13 (the most recent year for which final data were available) and asked them to describe the circumstances that explained these reserves. Most responses included at least one of the following circumstances: saving for large purchases and facing unusual circumstances. About half of respondents indicated they were saving for costs associated with opening a new school site or some other facility–related project. Other frequently mentioned purchases included major software or technology upgrades, new textbooks, and new school buses. (District reserve levels can be cyclical to some extent, in that reserve levels are relatively high in the year before a large purchase is made and relatively low the following year.) Districts also reported a variety of unique circumstances. For example, three districts indicated they had been the recipients of one–time funding associated with the dissolution of their local redevelopment agencies and had not yet been able to spend this extra funding. Two districts thought they might need to make a large payment related to a pending lawsuit or audit. Two districts reported that their budgets depended on a specific federal grant that has not been disbursed on a consistent schedule in recent years.
Interviews Indicate Importance of Local Preferences. While our survey focused on 2012–13 reserve levels, we also interviewed a range of county and district officials to determine why districts might carry higher–than–average reserves over a longer period. Interviewees indicated that some districts have strong local preferences for minimizing financial risk. In these cases, districts are concerned that their communities would view them as mismanaging resources if they borrowed to cover cash flow or were flagged to receive additional oversight from their COE. In these districts, maintaining high reserves is part of a broader strategy—often including cautious assumptions about future revenue and expenditures—to minimize financial risk. Other districts, by contrast, have stronger local preferences for spending to meet immediate priorities. In these districts, communities place greater emphasis on maintaining or expanding programs. In addition, access to local facility funding can affect reserve levels. While districts often pay for building renovations and other capital projects with local bonds, some districts indicated that building up General Fund reserves was the only way to pay for large capital projects because their communities would not support local bonds.
Districts With High Reserves More Likely To Have Very High or Very Low Property Tax Revenue. In addition to interviewing districts, we analyzed fiscal data for 60 districts that have reported much higher reserves than their peers of a similar size for six or more of the past ten years. The available data show that these districts are more likely to receive a relatively high or relatively low share of their funding from property taxes. Specifically, about 40 percent of these districts receive a small share (less than 15 percent) of their revenue from property taxes, compared with only 20 percent of districts statewide. Another 20 percent of these 60 districts receive all of their base per–pupil funding from property taxes, compared with 10 percent of districts statewide. This apparent paradox appears related to cash flow. Districts with very high property taxes receive almost no revenue except in December and April, and maintain higher reserves to cover expenditures in other months. Districts with very low property taxes, by contrast, have been most affected by state cash deferrals and have carried higher reserves to cover expenditures while awaiting state payments. Districts that rely more on a mixture of these revenue sources tend to have less difficulty managing cash flow.
Several Factors Contributed to Current Higher Reserve Levels
Recent Increases in Reserves a Notable Deviation From Past Trends. As shown earlier in Figure 4, General Fund reserves statewide rose sharply beginning in 2006–07 and have remained above historical levels through 2013–14. This trend differs from the experience in past recessions, when reserve levels declined. Our review finds that numerous state and federal actions contributed to the increase in reserves since 2006–07, and many of these actions had little precedent in prior recessions. In addition, many districts became more pessimistic and cautious in response to economic and budgetary uncertainties, preferring to build up reserves rather than undertake additional spending.
One–Time State and Federal Actions Contributed to Increases in Reserves. A number of state and federal actions had pronounced effects on reserves in specific years, including (1) one–time revenue, (2) proposed budget reductions that did not materialize, and (3) school finance reforms. Figure 6 lists these actions. Below, we describe how they contributed to higher reserves.
Figure 6
State and Federal Actions Contributed to Higher District Reserves
|
2006–07
|
|
State Block Grants. The 2006–07 budget allocated $2.5 billion in one–time block grants to districts and individual school sites. Of this amount, $1 billion was for any purpose and $1.5 billion was for specific activities (such as replacing instructional materials or purchasing physical education equipment). This funding remained mostly unspent at the end of 2006–07.
|
|
2008–09
|
|
Federal Stimulus Funding. In February 2009, the federal government passed the American Recovery and Reinvestment Act, which provided $6 billion in funding for California school districts to spend over a three–year period. Districts received $2.3 billion a few weeks before the end of 2008–09 and the remaining funds in 2009–10. Districts had about $2 billion of this funding remaining at the end of 2008–09 and $550 million remaining at the end of 2009–10.
|
|
2010–11
|
|
Proposed State Program Reductions Replaced With Deferral. The Governor’s May Revision proposed a reduction in general purpose school funding, but the final budget—signed in October—replaced this proposed cut with a $1.7 billion payment deferral.
|
|
Federal Education Jobs Funding. In August 2010, the federal government passed the Education Jobs and Medicaid Assistance Act, which included $1.2 billion for California school districts to spend over a two–year period. The funds were to help retain staff and avoid layoffs. About $750 million remained unspent at the end of 2010–11.
|
|
2011–12
|
|
Potential State Trigger Cuts. The 2011–12 budget package included automatic, midyear reductions to school funding of up to $1.8 billion ($300 per student) if state revenues fell below expectations. The actual midyear reduction was $300 million ($50 per student).
|
|
2012–13
|
|
Potential State Trigger Cuts. The 2012–13 budget package included automatic, midyear reductions to school funding in the event voters did not approve Proposition 30 in the November 2012 election. Specifically, the state was to reduce school funding by $2.7 billion ($450 per student) and defer payment of an additional $2.1 billion if the measure failed.
|
|
State Funding Reform. The Governor’s January and May budget proposals for 2012–13 included a new system for allocating school funding (known as the Weighted Student Formula). The June budget rejected this proposal and retained the existing school funding formulas.
|
|
2013–14
|
|
State Funding Reform. The Governor’s January and May budget proposals for 2013–14 included a new system for allocating school funding (known as the Local Control Funding Formula). The June budget included this proposal, with some modifications to the formula.
|
|
State Grant for Common Core Implementation. The 2013–14 budget package included $1.25 billion for the implementation of the Common Core State Standards over a two–year period. The funds were to support professional development, instructional materials, and technology. About $700 million remained unspent at the end of 2013–14.
|
|
Federal Sequestration. A federal law required a series of across–the–board reductions to most federal programs if Congress did not approve a comprehensive deficit reduction plan. These reductions, known as sequestration, were expected to reduce federal education funding by 5.9 percent in 2013–14 and by further amounts in subsequent years. Congress exempted most K–12 funding from sequestration in December 2013.
|
- One–Time Funding. The state and the federal government provided districts with several large infusions of one–time funding between 2006–07 and 2013–14. When districts receive one–time revenue, they generally save some funding for future use rather than spend it all in a single year. By saving some of this funding, districts increase their reserve levels temporarily until the funding is spent.
- Potential Budget Reductions That Did Not Materialize. State law requires districts to have adopted their budgets no later than July 1. On several occasions, the state or federal government was contemplating a budget reduction at this time but rescinded the reduction several months later. Many districts, however, had already adopted budgets that reduced spending to accommodate the anticipated budget reductions. When the budget reductions did not occur, districts received more revenue than they had anticipated. The additional revenue increased reserve levels.
- State Funding Reforms. During the 2012–13 and 2013–14 budget cycles, the Governor proposed to restructure the way the state allocated school funding. Districts finalizing their budgets in June did not know whether the state would adopt these proposals or how much associated funding they would receive. Many districts responded to this uncertainty by assuming their funding levels would remain flat or grow only by a cost–of–living adjustment (consistent with previous budgetary practice). Because funding in 2012–13 and 2013–14 ultimately increased substantially more than districts initially planned and the new funding formula adopted in 2013–14 was linked to certain student characteristics, some districts’ reserve levels increased considerably.
Local Pessimism and Caution Also Affected Reserve Levels. While specific state and federal actions affected reserve levels, growing pessimism and caution among districts also contributed to higher reserves. After the uncertainty over the fate of Proposition 30 was resolved (with its passage), most districts, for example, did not immediately begin spending down their reserves. Instead, many maintained their higher reserves in anticipation of future fiscal difficulties. Below, we describe two uncertainties that appear to have had the greatest effect on districts’ decision–making:
- Pessimism Regarding State Economy and State Budget. Several county business officials we interviewed commented that many of their districts became increasingly pessimistic about the prospects for a recovery as the state’s budget problems persisted. That is, the more that districts reduced their spending in response to flat or declining levels of state funding, the more concerned they became that additional reductions might be needed in the future. Many districts preferred to save their reserves for future contingencies rather than undertake additional spending while the economy remained sluggish.
- Concerns Regarding Cash and Payment Deferrals. Many district and county officials we interviewed indicated that districts were concerned about having cash on hand to cover immediate expenditures. Since the state payment deferrals resulted in a large gap between reserves and cash on hand, some districts ended the year with higher reserves as a result of trying to maintain cash at a level that enabled them to pay all bills even during their most cash–poor months. In addition, while the state made some efforts to provide advance notice of cash deferrals, many districts believed further deferrals might be forthcoming.
As Effects of One–Time State and Federal Actions Fade, Reserves Seem Likely To Decline. As a result of the one–time state and federal actions described earlier, as well as local pessimism and caution, many districts have built higher reserves than they have traditionally maintained. In a more stable budget environment, however, districts seem less likely to view reserves of this level as essential. Moreover, many districts delayed spending on critical activities during the last recession, including facility maintenance, textbook purchases, and professional development. Addressing these areas seems likely to place further downward pressure on reserves. As shown earlier in Figure 4, reserves already have decreased modestly from their peak, declining slightly in 2012–13 and 2013–14.
School District Reserves Not Especially High Compared With Other Entities
We compared school district reserves with three other entities: the California Community Colleges (CCC), California cities, and school districts in a few other large states. Overall, school district reserves do not appear especially high in any of these comparisons. Given the differences in structure, responsibilities, and funding across these entities, these comparisons are intended only for broad context—not to assess the appropriateness of any particular level of reserves.
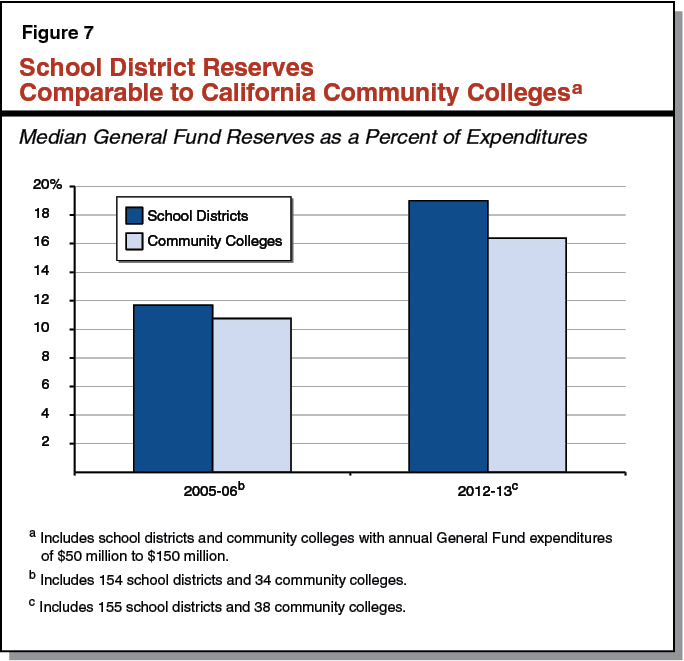
School District Reserves Similar to CCC. The CCC system consists of 72 community college districts that provide academic instruction and vocational training to adult learners across the state. Like school districts, community colleges receive funding from a combination of state General Fund revenue and local property tax revenue. (Community colleges also receive a small amount of funding from student fees.) Figure 7 compares the median reserve levels (as a percent of expenditures) for school districts and community colleges with annual budgets of $50 million to $150 million per year in 2005–06 and 2012–13. (This range includes about half of community college districts and about 150 school districts.) As Figure 7 shows, reserves for school districts were slightly higher than those of community colleges in both years.
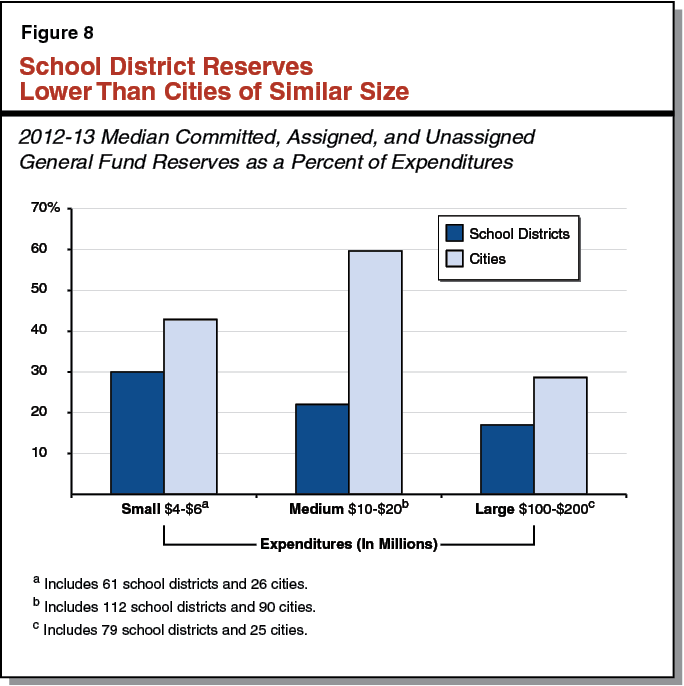
School District Reserves Lower Than California Cities. California has 482 cities that perform various activities such as providing police and fire services. Cities receive most of their funding from fees, sales taxes, and property taxes. Though cities differ from school districts in many respects, we include this comparison to illustrate how other local public agencies in California set their General Fund reserve levels. Figure 8 compares the median committed, assigned, and unassigned reserves for school districts and California cities in three size categories for 2012–13. (The nonspendable and restricted reserves are not directly comparable across these two entities.) As the figure shows, school district reserves are lower than city reserves in these comparisons, particularly for cities and school districts with annual General Fund expenditures between $10 million and $20 million. (Unlike school districts, city reserve levels have not changed significantly over the past several years.)
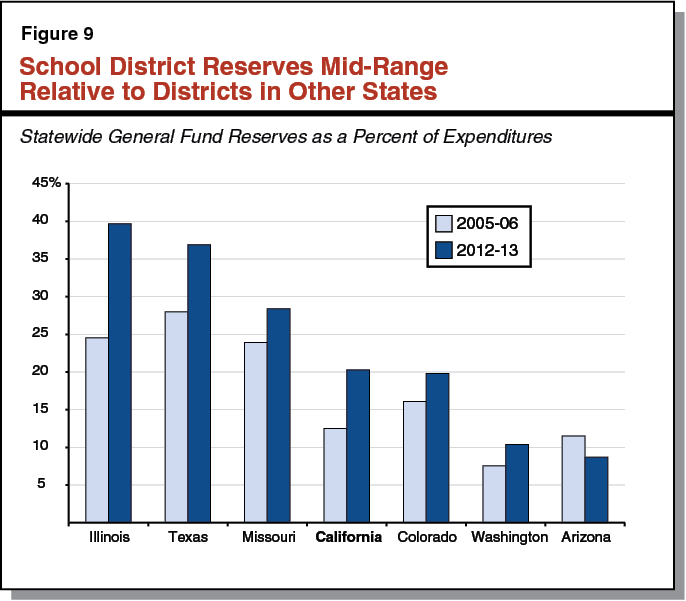
School District Reserves Mid–Range Relative to School Districts in Other States. Like California, other states fund their school districts with a combination of state aid and local property taxes. Figure 9 compares total school district reserves in California with six other large states. (We selected these states because they have large public school systems and educate students in a somewhat similar mix of small, medium, and large districts as California. Due to some differences in the way states report data, the comparisons are not exact.) As the figure shows, California school district reserves in 2012–13 were lower than three states, similar to one state, and higher than two states. The figure also shows that school districts in five of the other six states increased their reserves between 2005–06 and 2012–13.
School District Reserves Capped in Some Years
School District Reserves Capped in Years Following Deposits in New State School Reserve. Chapter 32, Statutes of 2014 (SB 858, Committee on Budget and Fiscal Review), included a provision capping district reserves in certain years. As Figure 10 shows, the caps prohibit districts from adopting a budget that contains total assigned and unassigned reserves of more than twice the applicable state minimums for unassigned reserves. (For Los Angeles Unified, which has a lower minimum than other districts, the cap is three times the minimum.) Other components of district reserves, including nonspendable, restricted, and committed reserves, do not count toward the caps. These caps are in effect only if, during the preceding fiscal year, the state made a deposit into the state school reserve recently established by Proposition 2. State deposits in this reserve are predicated on certain conditions, including strong growth in state revenue. The caps do not apply to COEs, charter schools, or community colleges. (Since the caps are linked to the minimum reserves for General Fund accounts, the caps likewise appear to apply only to reserves in that account. A recent report by the California School Boards Association, however, notes that the law does not explicitly limit the cap to the General Fund account. Under a possible alternative interpretation of the law suggested in that report, the caps could apply to total assigned and unassigned reserves in all accounts, not just the General Fund. In this report, we assume the caps are limited to the General Fund.)
Figure 10
Districts’ Reserves Capped Following Deposits in State School Reserve
|
District Enrollmenta
|
Minimum Reservesb
|
Reserve Capsc
|
|
0–300
|
5%d
|
10%e
|
|
301–1,000
|
4
|
8
|
|
1,001–30,000
|
3
|
6
|
|
30,001–400,000
|
2
|
4
|
|
400,001 or more
|
1
|
3
|
COEs May Issue Exemptions. Chapter 32 allows districts to apply to their COE for an exemption from the caps if they can document “extraordinary fiscal circumstances” that justify the exemption. The law cites multiyear infrastructure and technology projects as examples of such circumstances. COEs may grant this exemption to a district for up to two consecutive years within a three–year period. To receive an exemption, districts must (1) explain the need to exceed the caps, (2) identify the amount of reserves associated with the extraordinary fiscal circumstances, and (3) demonstrate that no other fiscal resources are available to address these circumstances.
New Reserve Disclosure Requirement
Districts Required To Justify Reserves Exceeding State Minimums. In addition to the new caps, Chapter 32 includes a new disclosure requirement for any district that adopts a budget with total assigned and unassigned reserves exceeding the applicable state minimum reserves. As part of each budget adoption or budget revision, a district must (1) indicate the state minimum reserve that applies to the district, (2) identify the amount of assigned and unassigned reserves that exceed the state minimum, and (3) substantiate the need to have reserves exceeding the state minimum. Unlike the caps, the disclosure requirements apply every year beginning in 2015–16. Given only 35 (of 944) districts had reserves that were below the state minimums in 2013–14, these annual disclosure requirements likely will apply to most districts moving forward.
Reserve Caps Are Relatively Low
Several Comparisons Indicate New Caps Are Low. We compared the reserve levels allowed by the caps to three benchmarks: (1) historical school district reserve levels, (2) reserve levels associated with strong credit ratings, and (3) recommendations issued by a national organization representing government finance officials. As we describe below, the new caps are low relative to all of these comparisons.
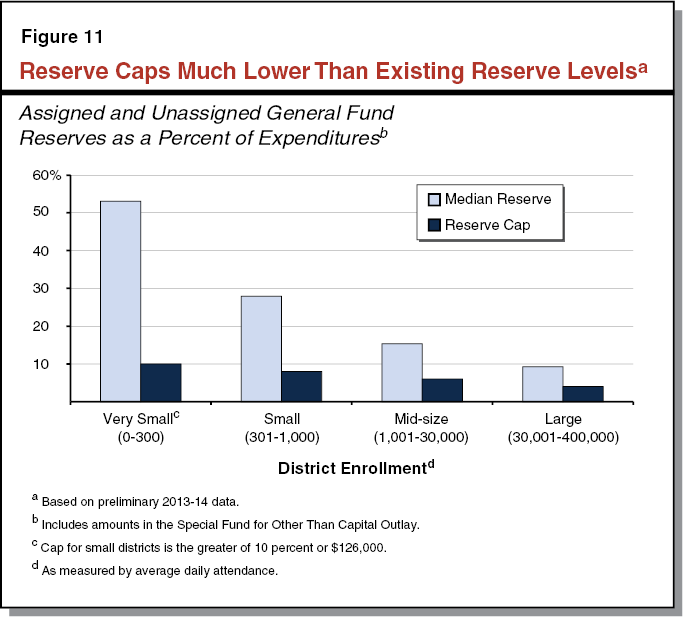
Caps Are Low Relative to Current and Historical Levels. The new caps would require districts to maintain notably lower reserves compared with current and historical school district practices. In 2013–14, districts had assigned and unassigned General Fund reserves totaling $7.3 billion. If all districts had instead maintained the maximum amount allowed by the caps, these reserves would have been limited to $2.8 billion, about one–third of the existing amount. Figure 11 compares the median assigned and unassigned reserves districts reported in 2013–14 with the amounts that would be allowed by the caps. For mid–size districts, the 6 percent cap is about one–third of the 15 percent reserve these districts currently maintain. For the state’s smallest districts, the 10 percent cap is about one–fifth of the 53 percent reserve these districts currently maintain. Overall, only 81 of the state’s 944 districts (about 1 in 10) had reserves at or below the capped levels in 2013–14. In addition, even before the increase in district reserves that began in 2006–07, only about one in five districts had reserves below the levels allowed by the caps.
Caps Are Low Relative to Amounts Associated With Strongest Credit Ratings. We reviewed rating information provided by the major credit rating agencies and found that the caps would limit reserves to levels well below the amounts associated with the strongest ratings. For the 109 mid–size districts that hold one of the strongest ratings from Moody’s Investors Service, for example, the median assigned and unassigned General Fund reserve is 17 percent. These reserve levels are nearly three times higher than the cap for mid–size districts.
Caps Are Low Relative to Government Finance Officers Association Recommendation. The Government Finance Officers Association is a national organization representing federal, state, and local budget officers and other finance officials. The association recommends school districts and other local governments maintain committed, assigned, and unassigned reserves of at least two months of operating expenditures (equating to a 17 percent reserve) to mitigate revenue shortfalls and unanticipated expenditures. The association further recommends all governments develop a formal policy regarding their minimum reserves and consider maintaining reserves larger than 17 percent if revenues or expenditures are especially volatile. A few districts have used this standard to develop their own local reserves policies. These reserve levels are nearly three times higher than the cap for mid–size districts.
Districts Could Respond to Caps in Several Ways
Our analysis finds that districts have three basic ways to respond to the caps: (1) ask their COE to provide an exemption, (2) shift monies to avoid the caps, or (3) spend down reserves. We describe these options below.
Districts Could Ask Their COE for an Exemption. Districts that want to maintain their existing reserves could ask their COE for an exemption when the caps take effect. Districts face some uncertainty, however, regarding the conditions under which a COE may grant exemptions. Most notably, the law requires a demonstration of extraordinary fiscal circumstances, even though many of the reasons districts maintain reserves exceeding the caps are relatively common. For example, districts that ask for exemptions because they are small and face declining enrollment could have their requests denied because many districts are similarly situated. The availability of the exemption would depend on the specific criteria developed by each COE. In addition, the exemption would be unavailable for a district that had received an exemption for the past two consecutive years.
Districts Could Shift Monies To Avoid the Caps. Districts that are unable to receive an exemption from their COE could shift monies to avoid the caps, as described below.
- Designate Reserves as Committed. Since the caps apply to the assigned and unassigned reserves, districts could avoid the caps by designating some of their reserves as committed. To make this designation, the local school board would need to identify a specific future project or use for the committed amounts. (As described earlier, the board could change this designation later.)
- Shift Reserves Into Special Accounts. Since the caps appear to apply only to the General Fund, districts could move monies into most of the 29 other accounts. In future years, districts could transfer these reserves back to their General Funds if needed to cover other expenditures.
Districts Could Spend Down Reserves. If a district neither received an exemption nor shifted monies, it would need to spend down its reserves to the levels allowed by the caps. The amount of additional spending needed to reach the cap would vary based on districts’ current reserve levels. A larger district with 20,000 students, a budget of $175 million, and assigned and unassigned reserves of $16.5 million (typical amounts for districts of this size) would need to reduce its reserves to $10.5 million, a reduction of 38 percent (about $300 per student). By comparison, a smaller district with 500 students, a budget of $4.6 million, and assigned and unassigned reserves of $1.2 million would need to reduce its reserves to $368,000, a reduction of 70 percent (about $1,700 per student). Based on our discussions with district and COE officials, districts would likely take different approaches to spending down reserves. Some districts would not reduce spending until the caps took effect, whereas others would begin spending earlier in anticipation of the caps applying in the future.
Concerns With Reserve Caps, Recommend Repeal
While districts could respond to the caps in several ways, we have a number of concerns about the consequences of districts either shifting monies to avoid the cap or spending down reserves. We describe these concerns below.
Shifting Monies Could Reduce Transparency. To the extent districts begin shifting monies, we are concerned that district finances would become more complex and difficult to understand. For example, someone outside of a district might not realize the district had shifted General Fund monies into another account and was in a stronger financial position than its General Fund reserves would imply. Our interviews with district business officials, employee groups, and parent organizations revealed a general consensus that one common factor in productive relationships between a district and its community is the district’s willingness to describe its financial position as completely and accurately as possible. Districts that appear to shift monies in response to the new law eventually could face a range of difficulties, such as more contentious labor negotiations and confusion among parents and other stakeholders.
Lower Reserve Levels Limit Ability To Maintain Programs in Tight Fiscal Times. For mid–size districts, the 6 percent reserve cap amounts to less than 3 weeks of payroll. Entering tight fiscal times, districts with reserves of this size would have little ability to soften a reduction in state funding. Instead, they would need to reduce spending to align with current revenues, likely by reducing staff or student services. Such districts could find maintaining academic programs especially difficult.
Lower Reserve Levels Make Unexpected Costs More Difficult To Address. Reserves that are below the capped amounts provide minimal protection against unexpected costs, particularly among smaller school districts. A district with 1,200 students, for example, typically has an annual budget of around $11 million, and therefore would have a reserve cap of $660,000 (6 percent). The district might need to draw down half or more of its reserves in a single year if its enrollment declined by 40 students, it needed to purchase two school buses, or it needed to replace a broken boiler. A more severe problem, such as a damaged roof, could require drawing down the entire reserve. A district with 150 students would be in an even more precarious position. Such a district typically has an annual budget of around $1.8 million, and therefore would have a reserve cap of $180,000. If this district were required to educate even one additional student with particularly severe disabilities—costs of which can exceed $75,000 per year—its reserves could be depleted very quickly. Districts confronting unexpected costs with low reserve levels face difficult choices, such as making sharp budget reductions or requesting emergency loans from the state.
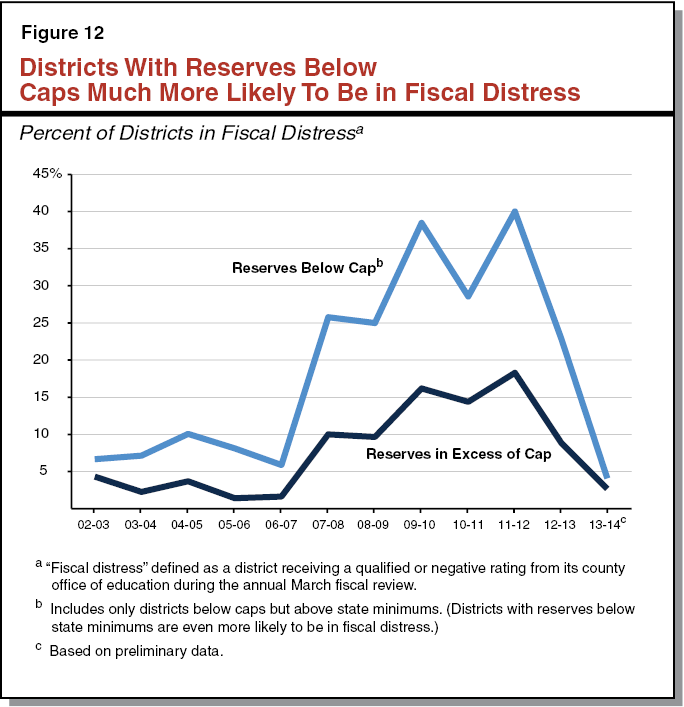
Lower Reserve Levels Historically Associated With Fiscal Distress. To investigate the viability of operating with reserves below the capped amounts, we compared two groups of districts over several years. The first group consisted of those districts with assigned and unassigned reserves exceeding the capped levels in each of the selected years. The second group consisted of those districts with assigned and unassigned reserves below the capped levels, but with unassigned reserves above the state minimums. This second group effectively contains districts with reserve levels in the range districts would maintain if the caps were to become operative. As shown in Figure 12, districts with these lower reserve levels historically have been about twice as likely to be flagged by their COEs for additional fiscal oversight compared with districts maintaining higher reserves. (While most districts flagged by their COEs do not ultimately require an emergency loan from the state, these districts usually need to make sharp budget reductions to restore their fiscal health.) Given the persistence of this relationship historically, we have concerns that the number of districts in fiscal distress would increase if the caps take effect.
Lower Reserve Levels Likely To Involve Additional Costs. To the extent districts begin operating with much lower reserves, we are concerned that districts could incur additional costs to borrow money:
- Higher Long–Term Borrowing Costs. Two of the three credit rating agencies already have issued warnings that the caps on district reserves could weaken credit quality and lead to lower ratings. While predicting how investors would respond to these downgrades is difficult, districts with lower ratings tend to have higher interest costs when issuing debt. Given districts reported more than $2 billion in new long–term borrowing in 2013–14, even a modest increase in interest rates would increase borrowing costs.
- More Reliance on Short–Term Borrowing. Districts with lower reserves have fewer options for managing cash flow and might need to engage in additional short–term borrowing to cover expenditures. Borrowing costs include up–front costs (such as preparing legal documents and paying outside advisors to arrange the financing) as well as interest costs. A district that borrows $10 million for cash flow purposes might expect to pay $40,000 or more in up–front costs plus interest. Districts that rely on reserves can avoid these costs.
Small Deposits in State School Reserve Could Have Large Effects on District Reserves. Chapter 32 requires districts to comply with the reserve caps following a deposit into the state school reserve. This deposit, however, could be small relative to the required reduction in local reserves. If the state were to deposit a few million dollars into the state school reserve, for example, the caps would become operative and would require reducing local reserves by several billion dollars statewide. Under such a scenario, districts would be in a worse financial position than they would be with no state deposit at all. Moreover, even if the amount in the state school reserve grew large enough to mitigate future funding reductions, school districts would not know how the state would allocate this funding when it was eventually withdrawn. This uncertainty creates difficulties for districts attempting to factor amounts in the state school reserve into their local budget planning.
Difficult To Set Statewide Caps Given Diverse District Circumstances. One question raised during our research was whether the state could refine the caps by increasing them or adjusting them for additional factors affecting reserve levels. We are concerned that districts are situated so differently that the state would not be able to develop caps that are reasonable in all cases. While districts can become overly cautious in developing their budgets, a simple percentage–based approach for setting new caps—even one that adjusts for differences in size—seems unlikely to account for legitimate differences in local circumstances and priorities. That the existing fiscal oversight process relies upon multiple indicators and holistic judgments by COEs is evidence that simple formulas are not well suited for assessing whether districts have adopted reasonable budgets. Recent state funding reforms designed to provide districts with more control over their spending also have recognized that districts often are better positioned that the state to align fiscal resources with local priorities.
Recommend Legislature Repeal Reserve Caps. Given our concerns, we recommend the Legislature repeal the reserve caps. While the state cannot be certain exactly how districts will respond to these caps, we are concerned that the caps are low and would involve many risks for districts attempting to comply with them. Less stability in academic programs, increased fiscal distress, and higher borrowing costs all are notable risks associated with lower levels of reserves. Districts that shift monies to avoid the caps would add unnecessary complexity and confusion to their local budgeting practices. Moreover, district reserves already are beginning to decline from current levels, which were driven in large part by a series of anomalous state and federal actions during the past recession.
Disclosure Requirement Could Improve Planning, But Recommend Refining
Encouraging Local Discussion Could Improve Planning . . . In contrast to our concerns with the caps, we believe the new annual disclosure requirements provide additional information that could help districts with fiscal planning. Given that reserves are an important part of districts’ overall fiscal health, requiring district officials to provide additional information about reserves could help school boards and communities better assess the trade–offs between additional spending and saving for future priorities. Requiring districts to articulate their reasons for maintaining reserves also might reduce some local concerns that districts have not been sufficiently transparent about their reserves and the reasons for maintaining those reserves.
. . . But Requirements Overemphasize State Minimums. We are concerned, however, that the annual disclosure requirements place great emphasis on the state minimums without considering a district’s individual circumstances. Given the state minimums by definition reflect floors, most districts have long maintained reserves above the minimums. In these districts, a regular statement disclosing the reasons for being above the state minimums may not be especially useful, since districts likely could identify many longstanding reasons for these higher levels of reserves. In addition, we are concerned that the disclosure requirements exempt districts with reserves below the state minimums. Such districts are especially vulnerable to revenue volatility or unexpected expenditures and might need to make large budget reductions if their finances deteriorate further. Disclosing information about reserves seems particularly important in these instances so that communities are aware of these risks. For these districts, disclosure could be a key step in building local support for actions to restore their fiscal health.
Recommend Legislature Modify Disclosure Requirements To Focus on Locally Adopted Policies. We recommend the Legislature retain the annual disclosure requirements but refocus them on locally adopted reserve policies. Specifically, we recommend the state require each district to publicly adopt a policy explaining the amount of unassigned reserves the district believes it needs to address economic uncertainties, funding volatility, and other contingencies. (As indicated earlier, some districts already have policies regarding reserve levels.) Each year, districts would be required to explain the differences between their reserve policies, the amount of reserves they have in the current year, and the reserves they project for the upcoming year. We believe modifying the disclosure requirements in this way could improve fiscal planning by encouraging districts to engage with their local communities, assess their existing risks, and develop plans to increase or decrease reserves to address their local needs. This approach also is consistent with recent state funding reforms designed to enhance local control and encourage decision–making that reflects local priorities.
Decisions about reserve levels are a key component of the annual choices school districts make about the allocation of their resources. That district reserves vary notably across the state reflects the wide variety of circumstances that weigh upon these local decisions. While decisions to maintain or increase reserves sometimes are seen as conflicting with efforts to expand district services, our report finds that healthy reserves in many cases can help districts avoid risks and costs that otherwise would hinder districts’ ability to deliver these services. Reserves allow districts to manage cash flow, mitigate funding volatility, address unexpected costs, save for large purchases, and reduce borrowing costs.
Regarding the recently adopted caps on reserves, our report finds that districts could take several actions in an effort avoid these caps, though at the cost of adding complexity and confusion to locally adopted budget practices. To the extent districts respond to the caps by spending down reserves, they likely would incur a number of additional risks and costs. Repealing the caps would allow the Legislature to avoid these risks. Furthermore, by focusing its attention on refining reserve–disclosure requirements, the Legislature could improve local planning and make district budgets more responsive to local needs.