Reports by Policy Area
How many juveniles are arrested each year?
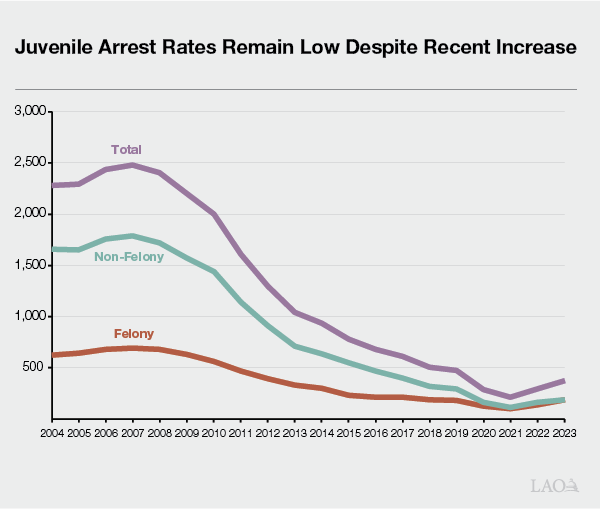
Juvenile Arrest Rates Rose After Lows Reached During Pandemic. After years of consistent declines between 2007 and 2021, the total juvenile arrest rate increased annually beginning in 2022 before declining somewhat in 2025. In 2025 there were 348.2 juveniles arrested for felonies per 100,000 youths age 10 to 17 in the state—60 percent higher than the 2021 rate. Similarly, the non-felony juvenile arrest rate in 2025 was 397—63 percent higher than the 2021 rate. Overall arrests declined notably during the COVID-19 pandemic. The precise reasons for this notable drop are not clear. According to a February 2023 report by the Public Policy Institute of California, the factors that appeared to drive the overall decrease in arrests include more people staying home and changes in police enforcement patterns. Such factors could have similarly reduced the juvenile arrest rate. Subsequently, as the pandemic began to subside, a change in mobility, police enforcement patterns, or other factors could have increased arrest rates.
Despite Recent Increases, Juvenile Arrest Rates Remain Relatively Low. Juvenile felony and non-felony arrest rates decreased by about 7 percent between 2024 and 2025. Additionally, juvenile arrest rates in 2025 were below pre-pandemic levels and substantially below the highs reached over the past two decades. For example, the 2025 juvenile felony arrest rate is 77 percent lower and the non-felony arrest rate is 90 percent lower than their 20-year peaks in 2007.
No Consensus on Why Arrest Rates Are So Low. There is no consensus among researchers as to why juvenile arrest rates consistently declined between 2007 and 2021. However, the decrease in juvenile crime overlaps with a longer-term national trend of decreases in other risky behavior among youths, such as alcohol and drug use.
Last Updated: July 2026