In This Report
LAO CONTACTS
SSI/SSP,
In-Home Supportive Services
Child Welfare Services,
Continuum of Care Reform
CalWORKs
Overall Health and Human Services

February 11, 2016
The 2016-17 Budget:
Analysis of the Human Services Budget
Executive Summary
Overview of the Human Services Budget. The Governor’s budget proposes $12.2 billion from the General Fund for human services programs—a 3.9 percent increase over 2015–16 estimated expenditures. The year–over–year changes mainly reflect the combination of (1) continued implementation of previously enacted policy changes; (2) changes in caseload, utilization of services, and cost per unit of service; and (3) new policy proposals in the Department of Developmental Services (DDS) and, to a lesser degree, the Supplemental Security Income/State Supplementary Payment (SSI/SSP) program. (We will be providing more information of the Governor’s major proposals in DDS in our upcoming publication, The 2016–17 Budget: Analysis of the Developmental Services Budget.)
Legislature Will Want to Evaluate Administration’s SSI/SSP Proposal in Light of Its Own Goals. The Governor’s 2016–17 budget proposal includes six months of funding to provide a one–time cost–of–living adjustment (COLA) to the state–funded SSP portion of the SSI/SSP grant. If the Legislature has an interest in increasing SSI/SSP grants, we find that the Governor’s proposal to provide a one–time COLA to be one way to do so. However, we think that the Legislature will first want to set its own goals for where it would like SSI/SSP grants to be, and over what time period it would expect to take to get there. Once these goals are established, the Legislature would be in a better position to consider the specific grant proposal made by the Governor. By establishing its goals for the program, the Legislature can ensure that any funding provided for SSI/SSP grant increases is used in a way that furthers those goals.
Governor’s Proposals for In–Home Supportive Services (IHSS) and California Work Opportunity and Responsibility to Kids (CalWORKs) Appear Reasonable. We have reviewed the administration’s 2016–17 budget proposals for IHSS and CalWORKs. While we raise some areas of uncertainty—mainly related to caseload estimates in CalWORKs and the recent implementation of federal labor regulations in IHSS—overall we find the administration’s proposals to be reasonable at this time. We will continue to monitor these areas of uncertainty and update the Legislature if we think any updates to the caseload and budgeted funding levels should be made.
Governor’s Continuum of Care Reform (CCR) Proposal Is Logical Next Step, but Some Uncertainty Remains. The Governor’s budget proposes funding in 2016–17 to continue to implement CCR in the state’s foster care system. At a high level, CCR aims to reduce reliance on long–term group home placements and increase the utilization and capacity of home–based family placements for children in the foster care system. We provide background on CCR, describe the Governor’s funding proposal, and highlight key areas of remaining uncertainty surrounding CCR implementation. While we think that the Governor’s budget is a logical next step in the implementation of CCR, we suggest some key issues and questions for legislative consideration with the goal of gaining some clarity around these remaining areas of uncertainty.
Overview
Background on Human Services
California’s major human services programs provide a variety of benefits to its citizens. These include income maintenance for the aged, blind, or disabled; cash assistance and employment services for low–income families with children; protecting children from abuse and neglect; providing home care workers who assist the aged and disabled in remaining in their own homes; collection of child support from noncustodial parents; and subsidized child care for low–income families.
Human services are administered at the state level by the Department of Social Services (DSS), Department of Developmental Services (DDS), Department of Child Support Services, and other California Health and Human Services Agency departments. The actual delivery of many services takes place at the local level and is typically carried out by 58 separate county welfare departments. A major exception is the Supplemental Security Income/State Supplemental Payment (SSI/SSP), which is administered mainly by the U.S. Social Security Administration. In the case of DDS, community–based services (the type of services received by the vast majority of DDS consumers) are coordinated through 21 nonprofit organizations known as regional centers.
Recent Major Changes in Funding for Human Services. As a result of realignment–related legislation in 2011 and 2013, the budget reflects shifts to counties of a significant amount of General Fund costs in human services programs. Specifically, as a result of 2011 legislation, the budget (beginning in 2011–12) reflects shifts to local realignment revenues of about $1.1 billion of General Fund costs in the California Work Opportunity and Responsibility to Kids (CalWORKs) program and about $1.6 billion in child welfare and adult protective services General Fund costs.
Legislation enacted in 2013 shifted additional General Fund costs in the CalWORKs program to local realignment revenues that previously have been used to provide health services to indigent individuals. These realignment revenues have been freed up given that many indigent individuals are newly eligible for coverage in the state–funded Medi–Cal program. The 2013 legislation additionally provided that the costs of specified ongoing increases to the CalWORKs assistance payments will be shifted to revenues from the growth of existing local realignment revenues that otherwise would have supported other human services programs. We discuss the statutorily driven CalWORKs grant increases in greater detail later in the “CalWORKs” section in this report.
Expenditure Proposal by Major Programs
Overview of the Human Services Budget Proposal. The Governor’s budget proposes expenditures of $12.2 billion from the General Fund for human services programs in 2016–17. As shown in Figure 1, this reflects a net increase of $453 million—or 3.9 percent—above estimated General Fund expenditures in 2015–16.
Figure 1
Major Human Services Programs and Departments—Budget Summary
General Fund (Dollars in Millions)
|
2015–16 |
2016–17 |
Change From |
||
|
Amount |
Percent |
|||
|
SSI/SSP |
$2,795.9 |
$2,872.8 |
$76.8 |
2.8% |
|
Department of Developmental Services |
3,508.8 |
3,773.5 |
264.8 |
7.5 |
|
CalWORKs |
697.7 |
740.5 |
42.8 |
6.1 |
|
In–Home Supportive Services |
2,934.4 |
2,966.0 |
31.6 |
1.1 |
|
County Administration and Automation |
824.3 |
855.1 |
30.8 |
3.7 |
|
Nonrealigned Children’s Programsa,b |
259.5 |
255.6 |
–3.9 |
–1.5 |
|
Department of Child Support Services |
314.3 |
314.2 |
–0.1 |
— |
|
Department of Rehabilitation |
59.8 |
59.9 |
0.1 |
0.2 |
|
Department of Aging |
33.4 |
33.8 |
0.3 |
1.0 |
|
All other human services (including state support) |
334.7 |
345.0 |
10.3 |
3.1 |
|
Totals |
$11,762.9 |
$12,216.3 |
$453.4 |
3.9% |
|
aThis includes, among other programs, the Kinship Guardianship Assistance Payment Program, Approved Relative Caregiver Program, and funding for the Continuum of Care Reform efforts. bThe 2015–16 General Fund includes a $50 million set–aside for a potential federal penalty. This penalty is currently being appealed. If the state does not ultimately have to pay the penalty, or pay a lesser amount, General Fund costs in this area would be less. |
||||
Summary of the Major Budget Proposals and Changes. As shown in Figure 1, the budget reflects generally stable General Fund expenditures across a majority of the human services programs, with relatively higher growth in DDS. Major new policy–driven spending proposals are concentrated in DDS and, to a lesser extent, SSI/SSP. While in some cases the year–over–year funding growth appears modest or flat, this is actually masking both cost increases and decreases within the program. We highlight the major budget changes below.
DDS. The 7.5 percent growth ($265 million) in DDS General Fund expenditures is driven in part by several new spending proposals primarily aimed at supporting community services as well as their development in preparation of the continued closure of developmental centers. (We will provide more information on the Governor’s major proposals in DDS in our upcoming DDS publication, The 2016–17 Budget: Analysis of the Developmental Services Budget.)
CalWORKs. The 6 percent growth ($43 million) in General Fund expenditures in CalWORKs largely reflects funding shifts and masks a decline (3 percent) in total funding for the program from all sources. The decline in total funding is primarily the result of lower estimated caseloads.
DSS Nonrealigned Children’s Programs. The slight decrease in General Fund support for the nonrealigned children’s programs under the DSS budget is primarily the result of the cost of a one–time set–aside to pay for a $50 million federal penalty in 2015–16. Although this $50 million is not included in 2016–17, the year–over–year savings is almost completely offset by proposed increased funding for the continuation of the implementation of the Continuum of Care Reform (CCR). At a high level, the funding provides for additional resources to improve the state’s child welfare system by performing comprehensive assessments of children to ensure that their initial placement is the most appropriate setting, increasing the use of home–based family care, and reducing the use of group homes. Some funding was provided for CCR in 2015–16, and the Governor’s budget continues this, and some additional funding, in support of this effort.
In–Home Supportive Services (IHSS). It is important to note that the modest (1.1 percent) year–over–year net growth in the IHSS General Fund expenditures masks a number of both cost increases and savings. On the cost front, the budget reflects increased costs for a full year of implementation of compliance with new federal labor regulations, caseload growth, and higher costs per service–hour as a result of wage increases. On the savings front, the Governor’s January budget proposes to continue to restore IHSS service hours that were eliminated as a result of a previously enacted 7 percent reduction in service hours, but do so through a restructured tax on managed care organizations (MCOs) rather than from the General Fund as was done in 2015–16. We note that on February 8, 2016, the administration released an updated MCO tax proposal. The administration has indicated that funding to continue the IHSS service–hour restoration could come from either MCO tax revenues or the General Fund.
SSI/SSP. Finally, although the year–over–year growth in SSI/SSP would not be considered significant (2.7 percent), we note that unlike in recent years, it includes funding increases for more than just growth in the caseload. The budget includes about $40 million to fund a one–time cost–of–living adjustment (COLA) (estimated to be 2.96 percent) to the state–funded, SSP portion of the grant.
Back to the TopSSI/SSP
The SSI/SSP program provides cash grants to low–income aged, blind, and disabled individuals. The state’s General Fund provides the SSP portion of the grant while federal funds pay for the SSI portion of the grant. For 2016–17, the budget proposes nearly $3 billion from the General Fund for the state’s share of SSI/SSP—an increase of $77 million (2.8 percent) over estimated 2015–16 expenditures. This increase would bring total program funding to $10.3 billion ($2.9 billion from the General Fund and $7.4 billion federal funds) in 2016–17. The primary drivers of this increase are modest caseload growth (less than 1 percent) and the Governor’s proposal to provide a one–time COLA to the SSP portion of the grant.
Caseload Growing Modestly. The SSI/SSP caseload has continued to grow at a rate of less than 1 percent each year since 2011–12. The budget estimates that about 1.3 million individuals and couples will receive SSI/SSP grants in 2016–17, an increase of 0.8 percent over 2015–16.
Background on SSI/SSP Grants
Both the State and Federal Government Contribute to SSI/SSP Grants. Grant levels for SSI/SSP are determined by both the federal government and the state. The federal government, which funds the SSI portion of the grant, is statutorily required to provide an annual COLA each January. This COLA increases the SSI portion of grant by the Consumer Price Index for Urban Wage Earners and Clerical Workers (CPI–W). In years that the CPI–W is zero or negative (as was the case in 2010, 2011, and 2016), the federal government does not increase SSI grants, but instead holds them flat. The federal government gives the state full discretion over whether and how to provide increases to the SSP portion of the grant. Until 2011, the state also had a statutory COLA. Although this statutory COLA existed, there were many years that, due to budget constraints, the COLA was not provided. The last state–funded COLA was provided in April 2005.
During Constrained Budget Environment, SSP Grants for Individuals and Couples Reduced to Federally Required Minimum. The state is required to maintain SSP grant levels at or above the levels in place in March 1983 in order to receive federal Medicaid funding. As a result of difficult budget times during the most recent recession, the state decreased SSP grants for individuals and couples to these minimum levels. As shown in Figure 2, for couples, the state reduced the SSP grant to the federally required minimum ($396 per month) in 2009–10. For individuals, SSP grants were first reduced by 2.9 percent to $171 per month in 2009–10, and then subsequently to the federally required minimum of $156 per month in 2011–12. Because no state COLA has been provided since these reductions, SSP grants for individuals and couples have remained at these minimum levels.
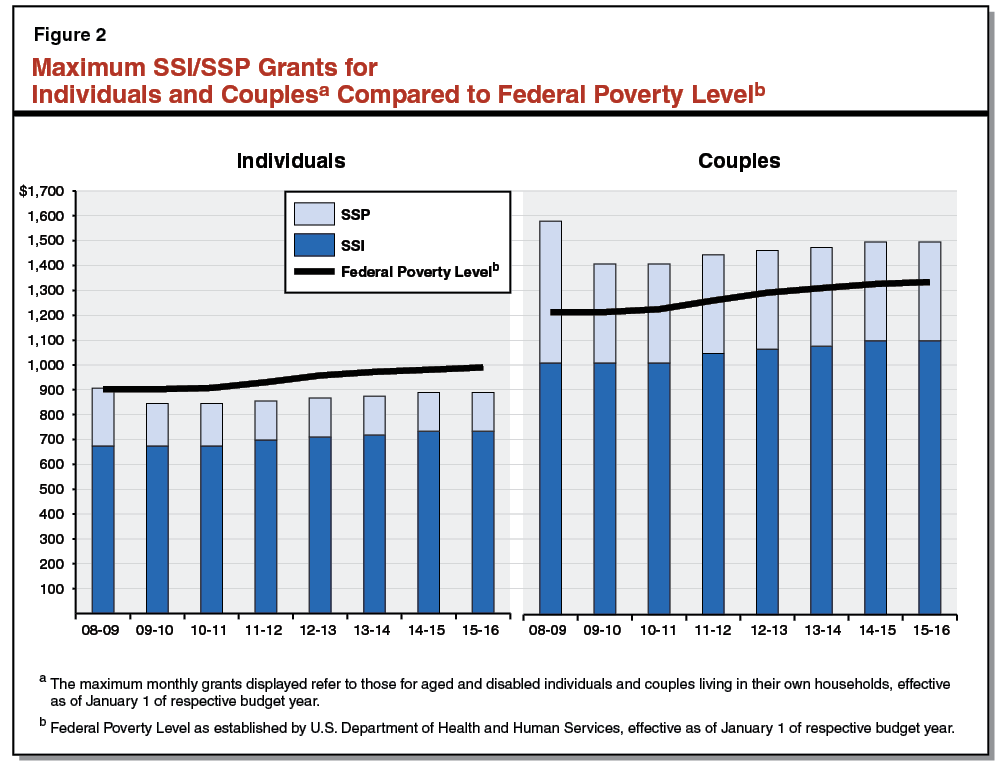
Grants Have Been Gradually Increasing Due to Federal COLAs, but Remain Below Pre–Recession Levels. As shown in Figure 2, the total SSI/SSP monthly grant amount for individuals and couples has been increasing since 2010–11—solely due to the provision and pass–through of federal COLAs. We note that during some difficult budget times prior to 2010–11, the state negated the impact of COLAs by reducing the SSP portion of the grant by the amount of the federal increase, thereby holding total SSI/SSP grant levels flat. After the state reduced SSP grants to the federally required minimum levels, the state could no longer do this. Despite the gradual increases in the grants shown in the figure, current maximum SSI/SSP grant levels remain below the 2008–09 levels.
Governor’s Proposed One–Time COLA
Budget Proposes One–Time COLA to SSP Portion of Grant. The budget includes six months of funding ($41 million) from the General Fund to increase SSP grants by the California Necessities Index (CNI) beginning January 1, 2017. The Governor’s budget estimates that the CNI will be 2.96 percent. The annualized cost of this COLA is estimated to be approximately $80 million to $90 million from the General Fund. In addition, the budget estimates that the federal government will provide a 1.7 percent COLA to the SSI portion of the grant, also beginning January 1, 2017. Based upon the Governor’s estimate of the CNI and CPI, the administration estimates that total monthly maximum grants for individuals will increase by $17.09 and grants for couples will increase by $30.43.
With Revised CNI and CPI, Grant Increases Less Than Estimated by Governor. The CNI is an estimate of how the cost of living in California has changed from year to year. The Governor’s budget estimates that the CNI will be 2.96 percent, using partial data. Our review of the actual data—published after the release of the Governor’s budget—indicates that the January 2017 CNI is 2.76 percent (we expect this to be the final CNI). Using the updated CNI, we estimate the proposed January 1, 2017 SSP COLA would cost the General Fund $38 million in 2016–17, a decrease of $3 million below the Governor’s January estimate. The Governor’s budget estimates that the CPI–W that the federal government will use to adjust the SSI portion of the grant will be 1.7 percent, but our estimate of the CPI–W is slightly lower, at 1.39 percent. (The actual CPI–W will not be known until the fall.) As a result of these downward estimates of the CNI and CPI–W, we estimate that monthly SSI/SSP grants would increase by $14.51 for individuals and $26.23 for couples under the Governor’s proposal. Figure 3 shows current maximum grant levels for individuals and couples compared to the Governor’s budget proposal (as estimated by both the administration and our office).
Figure 3
SSI/SSP Monthly Maximum Grant Levelsa Governor’s Proposal
|
2015–16 |
Governor’s 2016–17 Budget Proposal |
|||
|
Governor’s |
LAO Estimates |
|||
|
Amountc |
Change From |
|||
|
Maximum Grant—Individuals |
||||
|
SSI |
$733.00 |
$745.46 |
$743.19 |
$10.19 |
|
SSP |
156.40 |
161.03 |
160.72 |
4.32 |
|
Totals |
$889.40 |
$906.49 |
$903.91 |
$14.51 |
|
Percent of Federal Poverty Leveld |
90% |
92% |
91% |
|
|
Maximum Grant—Couples |
||||
|
SSI |
$1,100.00 |
$1,118.70 |
$1,115.29 |
$15.29 |
|
SSP |
396.20 |
407.93 |
407.14 |
10.94 |
|
Totals |
$1,496.20 |
$1,526.63 |
$1,522.43 |
$26.23 |
|
Percent of Federal Poverty Leveld |
112% |
114% |
114% |
|
|
aThe maximum monthly grants displayed refer to those for aged and disabled individuals and couples living in their own households, effective as of January 1 of the respective budget year. bReflects Governor’s budget estimate of the (1) January 2017 federal cost–of–living adjustment (COLA) for the SSI portion of the grant, and (2) the Governor’s one–time January 2017 state–funded COLA for the SSP portion of the grant. cReflects LAO estimate of the (1) January 2017 federal COLA for the SSI portion of the grant, and (2) the Governor’s one–time January 2017 state–funded COLA for the SSP portion of the grant. dCompares grant level to federal poverty guideline from the U.S. Department of Health and Human Services for 2016. |
||||
Grant Increases Should Reflect the Legislature’s Goals for SSI/SSP Grant Levels
Setting Goals for SSI/SSP Grant Levels. The Governor’s proposal is one way to increase the SSI/SSP grant. It raises grant levels to all recipients and would essentially maintain grants at roughly the same level relative to the federal poverty guideline as they are today. We think, however, that the Legislature will want to first set its own goals for where it would like SSI/SSP grant levels to be, and over what time period it would expect to take to get there. Once these goals were established, the Legislature would also be better positioned to consider the specific grant increase proposal made by the Governor. Below, we provide examples of ways the Legislature may approach increases to the SSP grant—depending on its specific goals.
Target Available Resources to Most Effectively Achieve Legislature’s Goals. As we described above, the Governor’s budget provides the same percentage grant increase for all recipients through a one–time COLA. However, the Legislature may have other goals for grant increases that could suggest targeting the increases among recipients. As an example, if the Legislature established a goal to ultimately bring the maximum SSI/SSP grant for all recipients to 100 percent of the federal poverty level, it may not make sense to provide the same grant increase to all SSI/SSP individuals and couples (as proposed by the Governor), but instead focus the available funding on individuals. This is because grants for individuals are currently at about 90 percent of the federal poverty guideline while grants for couples are at about 112 percent. Alternatively, the Legislature could set its goals relative to another measure of poverty (such as the Supplemental Poverty Measure, which accounts for cost–of–living differentials). The cost to the General Fund for these types of targeted grant increases would vary by the grant level chosen, the size of the population targeted, and the time period over which the grant increases would be provided.
Providing COLAs to Maintain Desired Grant Levels. Once SSI/SSP grants are at desired levels, the Legislature may also want to consider providing ongoing COLAs to maintain the purchasing power of those grants. The Governor’s proposed COLA to the SSP portion of the grant—if provided annually—would be one way to achieve this goal. This approach takes the view that it is the state–funded SSP portion of the grant that should be maintained, while federal COLAs would continue to adjust the SSI portion of the grant.
In past years when state COLAs were provided, the state used a different methodology—a statutory formula to adjust the total SSI/SSP grant by the CNI. It worked by applying the CNI to the combined SSI/SSP grant. First, the federal COLA was applied to the SSI portion of the grant, and then the cost to increase the total, combined grant by the CNI (after accounting for the federal COLA) was covered with state funding. This type of COLA effectively raises the total SSI/SSP grant by the CNI and may be referred to as a “whole–grant” COLA. This approach takes the view that the overall grant level is what should be maintained (rather than just the SSP portion directly controlled by the state). For this option, the state cost is determined, in part, by the difference between the CPI and CNI. The higher (lower) the CNI is relative to the CPI, the greater (less) the state cost in applying this COLA methodology. We estimate that the cost of providing this type of COLA in 2016–17 would be about $115 million for six months of an increase (approximately $230 million for a full year) and would result in the changes to the maximum grant reflected in Figure 4.
Figure 4
SSI/SSP Monthly Maximum Grant Levelsa If Whole–Grant COLA Provided
|
2015–16 |
2016–17 Estimated |
Change |
|
|
Maximum Grant—Individuals |
|||
|
SSI |
$733.00 |
$743.19 |
$10.19 |
|
SSP |
156.40 |
170.76 |
14.36 |
|
Totals |
$889.40 |
$913.95 |
$24.55 |
|
Percent of Federal Poverty Levelb |
90% |
92% |
|
|
Maximum Grant—Couples |
|||
|
SSI |
$1,100.00 |
$1,115.29 |
$15.29 |
|
SSP |
396.20 |
422.21 |
26.01 |
|
Totals |
$1,496.20 |
$1,537.50 |
$41.30 |
|
Percent of Federal Poverty Levelb |
112% |
115% |
|
|
aThe maximum monthly grants displayed refer to those for aged and disabled individuals and couples living in their own households, effective as of January 1 of respective budget year. bCompares grant level to federal poverty guideline from the U.S. Department of Health and Human Services for 2016. |
|||
Whatever the Funding Level, SSI/SSP Grant Increases Could Be Structured to Further Legislature’s Goals. As we have discussed above, there are various goals the Legislature may wish to establish when considering SSI/SSP grant increases, all at various costs. Once the Legislature sets its goals for the program, it can ensure that whatever the funding level provided for SSI/SSP grant increases—be it the $41 million proposed by the Governor or some other amount—the funding would be used in a way that furthers those goals.
Back to the TopIn–Home Supportive Services
Background
Overview of IHSS. The IHSS program provides personal care and domestic services to low–income individuals to help them remain safely in their own homes and communities. In order to qualify for IHSS, a recipient must be aged, blind, or disabled and in most cases have income below the level necessary to qualify for SSI/SSP cash assistance. The recipients are eligible to receive up to 283 hours per month of assistance with tasks such as bathing, dressing, housework, and meal preparation. Social workers employed by county welfare departments conduct an in–home IHSS assessment of an individual’s needs in order to determine the amount and type of service hours to be provided. The average number of service hours that will be provided to IHSS recipients is projected to be approximately 102 hours per month in 2016–17. In most cases, the recipient is responsible for hiring and supervising a paid IHSS provider—oftentimes a family member or relative.
The IHSS Program Receives Federal Funds as a Medi–Cal Benefit. For nearly all IHSS recipients, the IHSS program is delivered as a benefit of the state–federal Medicaid health services program (known as Medi–Cal in California) for low–income populations. The IHSS program is subject to federal Medicaid rules, including the federal medical assistance percentage reimbursement rate for California of 50 percent of costs for most Medi–Cal recipients. For IHSS recipients who generally meet the state’s nursing facility clinical eligibility standards, the federal government provides an enhanced reimbursement rate of 56 percent referred to as Community First Choice Option. The nonfederal costs of the IHSS program are paid for by the state and counties, with the state assuming the majority of the nonfederal costs.
Counties’ Share of IHSS Costs Is Set in Statute. Budget–related legislation adopted in 2012–13 created a county maintenance–of–effort (MOE) for IHSS. The county MOE generally sets counties’ contributions to IHSS at their 2011–12 levels, and increases the contributions annually by 3.5 percent (for inflation) plus a share of any wages and benefits subsequently negotiated at the county level. Under the county MOE financing structure, the state General Fund assumes all nonfederal IHSS costs above counties’ MOE expenditure levels. In 2016–17, the Governor’s budget estimates the total county MOE to be about $1.1 billion, an increase of $37 million above the estimated county MOE for 2015–16.
The Governor’s Budget Proposal and LAO Assessment
The budget proposes $9.2 billion (all funds) for IHSS expenditures in 2016–17, which is an approximately $700 million (8.3 percent) net increase over estimated expenditures in 2015–16. General Fund expenditures for 2016–17 are proposed at nearly $3 billion, a net increase of $32 million, or 1.1 percent, above the estimated expenditures in 2015–16. It is important to note that the modest year–over–year net growth in IHSS General Fund expenditures masks a number of both cost increases and savings. On the cost front, the budget reflects caseload growth, higher costs per service–hour as a result of wage increases, and increased costs for a full year of compliance with new federal labor regulations. On the savings front, the Governor’s January budget proposes to continue to restore IHSS service hours that were eliminated as a result of a previously enacted 7 percent reduction in service hours, but to do so through a restructured tax on MCOs rather than through the General Fund, as was done in 2015–16 (at a General Fund cost of $233 million). We note that on February 8, 2016, the administration released an updated MCO tax proposal. The administration has indicated that funding to continue the IHSS service–hour restoration could come from either MCO tax revenues or the General Fund. While we generally do not take issue with the Governor’s budget proposal, overall, we note that the budget includes several areas of fiscal uncertainty. Below, we describe some of the main components of the Governor’s IHSS proposal and note any issues with them.
Increases in IHSS Basic Services Costs. Caseload growth and wage increases for IHSS providers continue to be two primary drivers of increasing IHSS service costs. The Governor’s budget assumes the average monthly caseload for IHSS in 2016–17 will be about 490,000, an increase of 5.7 percent compared to the estimated 2015–16 average monthly caseload. We have reviewed the caseload projections in light of actual caseload data available to date and do not recommend any adjustments at this time. Provider wage increases also contribute to increasing IHSS service costs. The Governor’s budget includes $70 million General Fund ($150 million total funds) for a full–year impact of the state’s minimum wage increase from $9 to $10 per hour that began on January 1, 2016. In addition, the budget reflects wage increases negotiated at the county level for IHSS providers. We note, however, that the Governor’s budget does not take into account wages negotiated after September 2015, including a county–negotiated wage increase from $10 to $11 for Los Angeles County IHSS providers effective February 1, 2016. We estimate the Los Angeles County wage increase will cost the General Fund approximately $70 million in 2016–17. We expect that the Governor’s revised estimates released in May will account for this and other negotiated wage increases that occurred after the development of the Governor’s budget, but are set to take effect in 2016–17.
Implementation of Federal Labor Regulations Affecting Home Care Workers. As shown in Figure 5, the 2016–17 budget includes full–year funding ($850 million total funds, $395 million General Fund) to comply with federal labor regulations that became effective in 2015–16. The new regulations require states to (1) pay overtime compensation—at one–and–a–half times the regular rate of pay—to IHSS providers for all hours worked that exceed 40 in a week, and (2) compensate IHSS providers for time spent waiting during medical appointments and traveling between the homes of IHSS recipients. We note that 2014 budget–related legislation generally restricts IHSS providers to work no more than 66 hours per week. Although these federal regulations were issued in 2013, legal challenges in the federal courts halted implementation. In anticipation of a federal court decision requiring implementation sometime in 2015, the 2015–16 budget included partial–year funding to implement the regulations (contingent on the courts’ validation), but did not specify an implementation date. Following a federal court decision in August 2015 that affirmed the validity of the rules, the state set an implementation date of February 1, 2016 for the new regulations to take effect in IHSS. Below, we discuss several elements of the state’s implementation plan and highlight any issues with them:
- Current Year May Be Overbudgeted Due to Delayed Implementation. The 2015–16 budget assumed that the new federal labor regulations would be implemented on October 1, 2015. Since then, the administration has established an implementation date of February 1, 2016. Rather than reduce the 2015–16 IHSS budget by an estimated $120 million General Fund to account for the implementation delay, the administration has indicated that it made the decision to keep this funding in the budget to provide for any unforeseen costs associated with the new regulations. We note that the methodology it used to estimate 2015–16 expenditures related to implementation of the new rules already provides contingency funding to account for some level of uncertainty. As a result, IHSS may be overbudgeted by around $120 million General Fund in 2015–16.
- Limitations Placed on Overtime and Newly Compensable Work Activities. The 2016–17 budget includes a full year of funding for IHSS provider overtime and newly compensable work activities. This estimate reflects the statutory caps adopted in 2014—before federal courts placed a temporary hold on implementation—generally limiting the number of hours an IHSS provider can work to 66 hours per week. When multiplied by roughly four weeks per month, this weekly limit is about equal to the maximum number of service hours that may be allotted to IHSS recipients per month. The Governor’s budget estimates that 28 percent of providers typically work more than 40 hours per week, and that most of these providers generally work less than the new 66 hour per week cap. The legislation establishing the caps also limits the amount of time an IHSS provider who works for multiple recipients can spend traveling between the homes of recipients to seven hours per week. We note that DSS estimates that of the approximately 18 percent of IHSS providers who serve more than one recipient, most spend under seven hours per week traveling between recipients. These limitations will be enforced by a tiered penalty system developed by DSS. Providers can be terminated if they violate these limitations on multiple occasions.
- Exceptions to Overtime Limit for Certain Providers. After the 2016–17 Governor’s budget was released, DSS issued guidance to counties establishing two exemptions to the overtime cap: (1) an exemption for live–in family care providers, and (2) a temporary exemption for extraordinary circumstances. We note that current law does not provide specific authority for these exemptions. It is our understanding that the administration will be seeking statutory authority for these exemptions through the budget process. The first exemption is for IHSS providers who are related to, live with, and work for two or more IHSS recipients. For these providers, the overtime cap is extended to 90 hours per workweek (not to exceed 360 hours per month). In 2015–16, it is estimated that approximately 760 IHSS providers met this criteria. For the second exemption related to extraordinary circumstances, DSS (in consultation with the Department of Health Care Services), is in the process of establishing criteria for temporarily exempting IHSS providers from the 66–hour workweek limit in situations where the limit would place IHSS recipients at risk of out–of–home institutionalized care. At this time, the Governor’s budget does not include funding to account for either of the two exemptions. Based on the number of providers estimated to meet the live–in family care provider exemption in 2015–16, we estimate that this exemption could result in General Fund costs in the low millions of dollars annually. Until more guidance is issued about how the extraordinary circumstances exemption may be applied, it is difficult to estimate its potential costs.
- Three–Month Grace Period for All Providers. The legislation that enacted the overtime and travel time limits for IHSS providers also established a grace period for the first three months of implementation (now spanning February 1 through May 1, 2016). During this grace period, providers will not accrue penalties if they violate the overtime and travel time limits. County social workers, however, may work with IHSS providers found violating the limits and inform them of the violation without penalty during this time.
Figure 5
In–Home Supportive Services: Costs to Comply With New Federal Labor Regulations
(In Millions)
|
2015–16 Estimates |
2016–17 Governor’s |
||||
|
General Fund |
Total Funds |
General Fund |
Total Funds |
||
|
Overtime premium pay |
$164 |
$356 |
$218 |
$475 |
|
|
Newly compensable work activities |
117 |
247 |
172 |
366 |
|
|
Administration |
25 |
50 |
2 |
5 |
|
|
Changes to time sheet and payrolling system (CMIPS II) |
6 |
11 |
2 |
4 |
|
|
Totals |
$312 |
$664 |
$395 |
$850 |
|
|
CMIPS II = Case Management, Information and Payrolling System. |
|||||
Proposed Continued Restoration of Service Hours From 7 Percent Reduction. Offsetting the above increases in IHSS General Fund costs, the Governor’s January budget proposes to use revenue from a restructured MCO tax, rather than General Fund, in the amount of $236 million to provide the nonfederal share of funding needed to continue to restore service hours from the 7 percent reduction enacted in 2013–14. In 2015–16, the service hours were restored through the use of the General Fund on a one–time basis, with the intent that an alternative funding source would be used in future years. The 7 percent restoration relates to terms of an IHSS settlement agreement—adopted by the Legislature—that resolves two class–action lawsuits stemming from previously enacted budget reductions. The terms of the settlement agreement require the state to pursue a revenue source other than the General Fund for the purpose of restoring service hours from the 7 percent reduction. On February 8, 2016, the administration released an updated MCO tax proposal. As noted earlier, the funding source for the service–hour restoration could be either MCO tax revenues or the General Fund.
Back to the TopCalWORKs
Background
The CalWORKs program was created in 1997 in response to 1996 federal welfare reform legislation that created the federal Temporary Assistance for Needy Families (TANF) program. CalWORKs provides cash grants and employment services to families whose income is inadequate to meet their basic needs.
Cash Assistance. Grant amounts vary across the state and are adjusted for family size, income, and other factors. For example, a family of three that has no other income and lives in a high–cost county currently receives a cash grant of $704 per month (equivalent to 42 percent of the federal poverty level). A family in these circumstances would generally also be eligible for food assistance through the CalFresh program in the amount of $497 per month and health coverage through Medi–Cal.
Work Requirement and Employment Services. As a condition of receiving aid, able–bodied adults are generally subject to a work requirement, meaning that they must be employed or participate in specified activities—known as “welfare–to–work (WTW) activities”—intended to lead to employment. CalWORKs cases that include an adult who is subject to the work requirement are entitled to receive subsidized child care and other employment services to help meet the requirement. Individuals who fail to meet the work requirement without good cause are subject to a sanction by being removed from the calculation of their family’s monthly grant, resulting in reduction in cash assistance (of roughly $140 dollars).
WTW 24–Month Time Clock Determines Allowable Activities. As of 2013, state law defines two sets of rules for which allowable WTW activities may be used to meet the work requirement. The first set of rules, referred to as “federal” rules because they closely mirror federal TANF law, place greater emphasis on employment over some other activities including education, training, and mental health and/or substance abuse treatment. The second set of rules, referred to as “CalWORKs” rules, allow relatively greater flexibility to choose activities that may help adult recipients address barriers to employment. Adult recipients may meet the work requirement under federal rules at any time, but may meet the work requirement under CalWORKs rules only for up to a cumulative, but not necessarily consecutive, 24 months. Once 24 months of participation under CalWORKs rules have been exhausted, recipients must participate under federal rules. This policy is referred to as the “WTW 24–month time clock.”
Federal Work Participation Rate (WPR) Requirement. As noted above, federal law lays out rules governing how recipients may meet the work requirement. Federal law requires the state to track the percentage of assisted families that meet the work requirement under federal rules, also known as the WPR. Federal law further requires the state to maintain a WPR of at least 50 percent or face financial penalties.
Adult Time Limit on Aid. In California, adult recipients are also generally limited to a cumulative lifetime maximum of 48 months of assistance in CalWORKs. Adults who exhaust 48 months of cash assistance are removed from the calculation of their family’s monthly grant, resulting in decreased cash assistance. (The family would continue to receive a reduced grant for children who remain eligible.)
Funding. CalWORKs is funded through a combination of California’s federal TANF block grant allocation, the state General Fund, and county funds, including significant amounts spent by counties as a result of state–local realignment. In order to receive its annual TANF allocation, the state is required to spend an MOE amount from state and local funds to provide services to families eligible for CalWORKs. In recent years, this MOE amount has been $2.9 billion. While the CalWORKs program makes up the majority of TANF and MOE spending, it is important to note that the TANF block grant is used to fund a variety of programs in addition to CalWORKs, and some state and local expenditures outside CalWORKs are counted toward the MOE requirement.
Budget Overview
As shown in Figure 6, the Governor’s budget proposes $5.3 billion in total funding for the CalWORKs program in 2016–17, a net decrease of $187 million (3 percent) relative to estimated current–year funding. This decrease primarily reflects savings from a declining caseload, slightly offset by a small increase in other spending (specifically, an increase in state support for Tribal TANF programs). Within the total funding amount, the budget proposes $741 million in General Fund support for CalWORKs, an increase of $43 million (6 percent) over estimated current–year levels. This increase in General Fund support primarily reflects a net decrease in the amount of funding budgeted from non–General Fund sources, thereby increasing the requirement for General Fund. The following sections highlight some major features of the 2016–17 CalWORKs budget.
Figure 6
CalWORKs Budget Summary
All Funds (Dollars in Millions)
|
2015–16 |
2016–17 |
Change From 2015–16 |
||
|
Amount |
Percent |
|||
|
Cash grants |
$3,051 |
$2,963 |
–$88 |
–3% |
|
Employment services |
1,468 |
1,390 |
–78 |
–5 |
|
Stage 1 child care |
410 |
394 |
–16 |
–4 |
|
Administration |
494 |
482 |
–12 |
–2 |
|
Othera |
95 |
102 |
7 |
7 |
|
Totals |
$5,518 |
$5,331 |
–$187 |
–3% |
|
aExcludes transfer of federal Temporary Assistance for Needy Families block grant funds to the Cal Grant program and funding for the Kinship Guardianship Assistance Payment Program. |
||||
Budget Estimates Reduction in Current–Law Funding Requirement
The budget estimates that the total funding required to operate CalWORKs consistent with current law and policy will decrease in 2016–17 relative to the prior year. Below, we describe two factors that contribute to the decreased funding requirement.
Savings From Declining Caseload. The number of families receiving CalWORKs assistance each month has generally declined since 2011–12, primarily due to an improving labor market. The budget estimates that the average monthly number of CalWORKs cases in 2015–16 will be 507,615—a 5 percent decrease from the prior year. The average monthly number of cases is projected to further decline by 2 percent in 2016–17 to 496,558. Consistent with these caseload declines, the budget reflects savings from a declining caseload of about $165 million (all funds) in 2016–17 relative to the prior year.
Savings From Ongoing Implementation of the WTW 24–Month Time Clock. Adult recipients who exhaust 24 months of participation under CalWORKs rules may continue to receive assistance by meeting the work requirement under federal rules. However, some recipients who exhaust the 24 months are anticipated to fail (for a variety of reasons) to meet the work requirement under federal rules, resulting in reduced cash assistance. The first individuals to exhaust the 24 months, fail to meet the work requirement under federal rules, and have their assistance reduced, are beginning to do so during 2015–16, with the number expected to grow over the next several years before leveling off. Specifically, the administration estimates that 1,790 cases (0.4 percent of the total caseload) will have reduced cash assistance by the end of 2015–16 with an estimated savings of $1 million (all funds), growing to 11,650 cases (2.4 percent of the total caseload) and savings of roughly $11 million (all funds) by the end of 2016–17.
Shifts in Program Funding Sources
Within the estimated total funding requirement of the program in 2016–17, the Governor’s budget reflects some shifting of total CalWORKs costs among the program’s major funding sources, displayed in Figure 7. Below, we describe some of the factors that contribute to these shifts.
Figure 7
CalWORKs Funding Sources
(Dollars in Millions)
|
2015–16 |
2016–17 |
Change From 2015–16 |
||
|
Amount |
Percent |
|||
|
Federal TANF block grant fundsa |
$2,574 |
$2,684 |
$110 |
4% |
|
General Fundb |
698 |
741 |
43 |
6 |
|
Realignment funds from local indigent health savings |
742 |
413 |
–329 |
–44 |
|
Realignment funds dedicated to grant increases |
311 |
302 |
–9 |
–3 |
|
Other county/realignment funds |
1,193 |
1,191 |
–2 |
—c |
|
Totals |
$5,518 |
$5,331 |
–$187 |
–3% |
|
aExcludes transfer of federal Temporary Assistance for Needy Families (TANF) block grant funds to the Cal Grant program. bExcludes funding for the Kindship Guardianship Assistance Payment Program. cRounds to zero. |
||||
Reduced Realignment Funding From Local Indigent Health Savings. Current law directs certain realignment funds previously dedicated to local indigent health programs to instead be used each year to pay for an increased county share of CalWORKs grant costs, in an amount equal to the estimated savings that counties will realize in their indigent health programs due to the expansion of Medi–Cal. This redirection of funds reduces the amount of state and federal funds needed to support the CalWORKs program. (For more information on this redirection, see the “CalWORKs” write–up in our previous report, The 2014–15 Budget: Analysis of the Human Services Budget.) Current law also provides that the state “true up” the amount of redirected savings three years after the fact to reflect actual county savings amounts. For 2016–17, the budget estimates that the amount of CalWORKs grant costs paid with realignment funds from local health savings will be $413 million, which is $329 million (44 percent) less than estimated for 2015–16. The main reasons for the significant reduction in estimated savings are (1) data from counties show that the state’s estimated savings in 2013–14 were likely overstated, requiring the state to return an estimated $151 million to counties through the true–up process during 2016–17, and (2) the administration now has lower expectations for the amount of annual ongoing savings. Decreased realignment funding from local health savings increases the need for funding from other sources. We note that estimated local indigent health savings for 2016–17 are uncertain and may be updated at the May Revision.
Realignment Funds Dedicated to Grant Increases Insufficient for New Increase. Current law dedicates certain other realignment funds to pay the costs of new CalWORKs grant increases and outlines an annual process through which these grant increases are provided. Unlike realignment funds from local health savings, discussed above, these dedicated funds are not intended to offset the funding needed from other sources. Rather, dedicated funds are intended to cover increases to total program costs resulting from new grant increases. Specifically, each year the Department of Finance (DOF)estimates the combined cost of all past increases provided from the dedicated funds (two separate 5 percent increases have been provided to date, in March 2014 and April 2015, at a total annual cost of $319 million during 2016–17) and the total amount of available dedicated funds ($302 million in 2016–17). When the estimated amount of dedicated funds exceeds the estimated cost of previously provided increases, DOF further determines the percentage increase in CalWORKs grants that could be sustained by the excess dedicated funds. A grant increase of this amount would then be provided during the budget year. When the estimated cost of previous grant increases exceeds the estimated amount of dedicated funds, as is the case for 2016–17, the General Fund covers the difference and no additional grant increase is provided. The amount of General Fund support needed to make up for insufficient dedicated funds in 2016–17 is $17 million.
Increased General Fund Needed to Backfill Reduced Realignment Funding and Meet MOE Requirement. As noted above, the state must pay a minimum MOE amount from state and local funds (including realignment) to receive the annual TANF block grant. The reduction in the estimated current–law funding requirement and the estimated decrease in available realignment funds from local health savings mean that General Fund spending in CalWORKs must increase for the state to meet the required MOE in 2016–17. Specifically, General Fund support for CalWORKs increases by $43 million (6 percent) in 2016–17 over the prior year.
Increased Federal TANF Support From Carry–In. The budget estimates that the amount of unused TANF funding available for use in 2016–17 increased by roughly $400 million over the prior year, largely from funds allocated to counties in prior years that were not spent. After accounting for the increased General Fund support needed to meet the state’s MOE requirement, only $110 million of these additional TANF funds are needed to meet the estimated current–law funding requirement of the program. The budget increases TANF support for CalWORKs by this amount and increases the amount of TANF funds used to support financial aid for low–income college students through the Cal Grant program by $304 million, directly offsetting what otherwise would be General Fund Cal Grant costs of the same amount.
State Has Likely Reached WPR Compliance
California Has Failed to Meet WPR Requirement Since 2007. California has failed to meet the WPR requirement every year since federal fiscal year (FFY) 2006–07 and has been assessed cumulative penalties of about $1.3 billion, as shown in Figure 8, that would ultimately take the form of a one–time reduction to the state’s TANF block grant allocation. To date, the state has not faced any reductions to the TANF block grant as the state pursues various administrative avenues to reduce or eliminate the penalties.
Figure 8
Work Participation Rate Penalties
(In Millions)
|
FFY |
Penalty |
|
2007–08 |
$48 |
|
2008–09 |
113 |
|
2009–10 |
180 |
|
2010–11 |
246 |
|
2011–12 |
312 |
|
2012–13 |
378 |
|
Total |
$1,277 |
|
Note: The state failed to meet the work participation rate requirement in federal fiscal year (FFY) 2013–14 but has not yet been assessed any additional penalties. |
|
Federal Law Allows WPR Penalties to Be Reduced or Eliminated Through Corrective Compliance Plans. Federal law provides that penalties may be eliminated if a state enters into a “corrective compliance plan” that results in the state meeting the WPR requirement in a later year. To date, the state has submitted two corrective compliance plans. Under the first, $342 million in penalties for 2007–08, 2008–09, and 2009–10, would be eliminated if the state meets the WPR requirement during FFY 2014–15 (which ended in October 2015). Under the second, $558 million in penalties for 2010–11 and 2011–12 may be eliminated if the state meets the WPR requirement during FFY 2015–16. The state has not yet submitted a corrective compliance plan for the 2012–13 penalties.
California Likely Reached Compliance in FFY 2014–15. With the release of the Governor’s budget, the administration announced that it appears to have achieved a WPR of 55 percent—sufficient for compliance—during FFY 2014–15. If compliance is verified by the federal government, $342 million of the state’s penalties will be eliminated. If compliance is maintained in 2015–16, most of the penalties assessed for 2010–11 and 2011–12 will be eliminated. (A small portion of 2011–12 penalties relate to an additional WPR requirement for cases with two parents that the state continues not to meet. These penalties will need to be addressed through other means.) We note that the state failed to meet the WPR requirement in 2013–14, but penalties for that year have not yet been assessed.
Analyst’s Budget Assessment
Governor’s Proposal Consistent With Current Law and Policy. In our view, the Governor’s 2016–17 CalWORKs budget proposal is consistent with current law and policy and makes adjustments to total funding only to reflect costs and savings associated with changes in caseload and ongoing implementation of previously enacted policy changes.
Caseload Estimates Generally Appear Reasonable, but Should Be Revisited at May Revision. The CalWORKs budget is largely driven by assumptions made by the administration about the number of families that will receive assistance and what services they will need. In examining the Governor’s proposal, we reviewed the administration’s caseload estimates against the most recent actuals available and our expectations for how caseloads may change in the future. In our view, the administration’s estimate of the number of families that will receive cash assistance and the families that will utilize child care subsidies appear reasonable. We note that the estimated need for other employment services may be overstated (implying that savings on services may be greater than assumed in the Governor’s budget). However, we recommend leaving caseload–related funding decisions until after the May Revision. Our office will follow actual caseload levels between now and May to assess whether any updates to the caseload estimates and associated budgeted funding levels should be made.
Back to the TopContinuum of Care Reform
California’s child welfare system serves to protect the state’s children from abuse and neglect, often by providing temporary out–of–home placements for children who cannot safely remain in their home and services to safely reunify children with their families. As part of a years–long effort to identify and effect improvements to the state’s child welfare system, the Legislature passed legislation in 2015 implementing the Continuum of Care Reform, or CCR. The law, Chapter 773 of 2015 (AB 403, Stone), makes fundamental changes to the way the state cares for children who have been removed from their home. Predicated on widespread concern surrounding poor outcomes for children placed in non–family–like settings, CCR aims to increase the foster care system’s reliance on more family–like settings rather than institutional settings like group homes. Additionally, CCR makes changes to ensure that the state’s foster children receive needed mental health treatment and supportive services regardless of their placement setting.
To accomplish these goals, the Governor’s budget proposes about $60 million in General Fund for support of CCR implementation efforts. While the long–term fiscal implications of CCR are unknown, the Governor’s 2016–17 budget recognizes that CCR implementation requires up–front funding from the state. This analysis begins by providing an overview of the existing foster care system; highlights the major policy changes included in AB 403; and evaluates the Governor’s proposed CCR implementation spending in light of continued uncertainties around the ultimate costs, savings, and programmatic impacts of the reform package.
Overview of the Child Welfare System
California’s child welfare system provides a continuum of services for children who have experienced or are at risk of experiencing abuse or neglect. These child welfare services (CWS) include responding to and investigating allegations of abuse and neglect, providing family preservation services to help families remain intact, removing children who cannot safely remain in their home, and providing temporary out–of–home placements until (1) the family can be successfully reunified or (2) an alternative permanent placement can be found. Adoption and guardianship are the two most common permanent placement options after family reunification.
Child Welfare Programs Are State Supervised, County–Administered. The DSS oversees CWS, while county welfare departments carry out day–to–day operations and services. DSS is responsible for statewide policy development, enforcing state and federal regulations, and ensuring that the state achieves the federal performance standards tied to federal funding. Counties have some flexibility around the design of their operations and the range of services they provide. All counties investigate allegations of abuse, engage with families to help them remain intact, and provide maintenance payments to foster caregivers and providers. Other services vary county by county, with some counties, for example, offering supplemental payments for children with high needs and others offering child care for a subset of children in care. Assisting the counties are several hundred private Foster Family Agencies (FFAs) and group home operators who themselves provide a continuum of services ranging from foster parent recruitment and certification to mental and behavioral health counseling.
The Role of County Probation Departments in the Child Welfare System. County probation departments carry out many of the same services provided by county welfare departments in the case of children who have been declared wards of the court through a delinquency hearing. After obtaining jurisdiction over a child, county probation departments will assess the parents’ ability to adequately supervise the child, provide family preservations services if there is a risk of removal, and secure a foster care placement—typically in a group home—if removal is deemed necessary. Unlike the majority of children who enter the child welfare system, children in out–of–home care due to a probation decision have not necessarily been subject to abuse or neglect. Instead, probation departments typically utilize foster care placements with the aim of rehabilitating the child. Commonly considered a less restrictive setting for a population that might otherwise be placed in a locked facility, group homes are the most utilized foster care placement setting for county probation departments. In contrast, child welfare departments utilize group home placement relatively infrequently. Relative to children overseen by the child welfare system, probation youth tend to be older and require heightened supervision.
CWS Funding
Total funding for CWS is estimated to be roughly $5 billion for 2016–17. Below we describe the major sources of this funding.
2011 Realignment Revenues Are a Major Source of CWS Funding in the State. Until 2011–12 the state General Fund and counties shared the nonfederal costs of administering CWS. In 2011, the state enacted legislation known as 2011 realignment, which dedicated a portion of the state’s sales tax to counties to administer CWS. The 2016–17 budget assumes that over $2 billion will be available from realignment revenues for the support of CWS programs. The 2011 realignment transferred fiscal risk to counties at the same time as it gave them a guaranteed source of revenues. Prospectively, counties are not responsible for future cost increases resulting from state, federal, and judicial policy changes, but are responsible for all other increases—for example, those associated with rising caseloads. Conversely, if overall child welfare costs fall, counties get to retain those savings. Proposition 30, approved by voters in 2012, protects the state from having to reimburse counties for child welfare policies that were in place prior to 2011 realignment. Proposition 30 also protects counties by establishing that counties only need to implement new state policies that increase overall program costs to the extent that the state provides funding.
Federal Funding for CWS. Federal funding for CWS stems from several sources and is estimated to be over $2.5 billion in 2016–17.
State General Fund Supports Nonrealigned Components of Child Welfare and State Oversight Functions. The 2016–17 budget proposes over $250 million General Fund to county welfare and probation departments to implement components of the child welfare program that were not part of 2011 realignment. This includes funding for such things as a program to combat the commercial sexual exploitation of children and foster care payments for certain relative caregivers. Additionally, the General Fund continues to support the state’s CWS oversight function at DSS.
Child Welfare Workers Rely on an Array of Out–of–Home Placement Options
When finding a placement for foster children, counties rely on four primary placement options—kinship care, foster family homes (FFHs), FFAs, and group homes. As of October 2015, there were over 65,000 children in foster care in California. For this report we refer to kinship care, FFHs, and FFAs as home–based family care. Federal and state law mandate that children be placed in the least restrictive placement setting, which state law describes as that which promotes normal childhood experiences and the day–to–day needs of the child. Figure 9 shows the proportions of foster children in each of these placement settings. The four selected placement types vary in their level of restrictiveness, serve children with different though overlapping needs, provide distinct sets of specialized services, and receive varying care and supervision payment rates from the state—which we refer to as foster care payment rates.
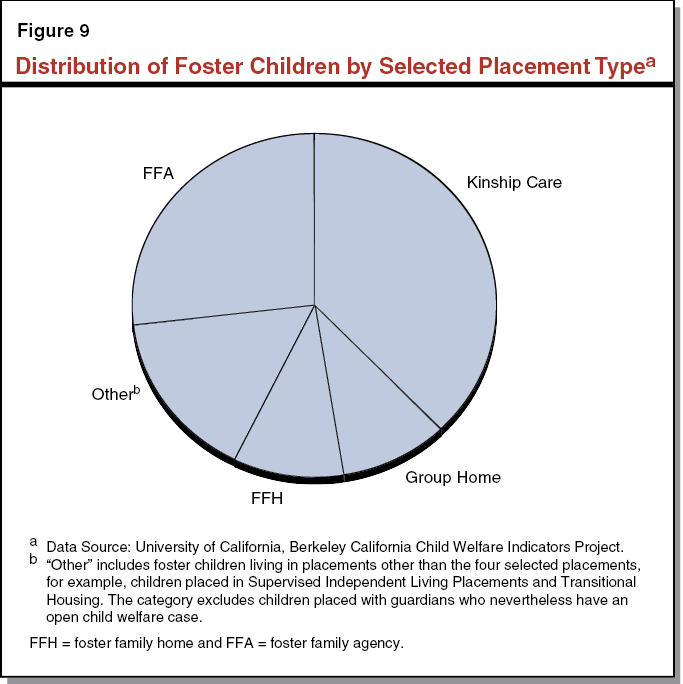
Kinship Care. Established child welfare policy and practice in the state prioritizes placement with a noncustodial parent or relative. Among child welfare workers’ first responsibilities following a child’s removal is locating a potential relative caregiver. Kinship care comprises care from relatives and nonrelative extended family members and is the state’s most utilized placement option at 38 percent of foster placements as of October 2015. Unlike other placement types, kin–caregivers are not necessarily eligible for foster care payments at the same level as other foster caregivers. Specifically, relatives caring for children who are ineligible for federal financial participation (primarily due to income eligibility rules) have historically received a lower foster care payment rate—the CalWORKs child–only payment of $369 per child per month in 2015–16. However, with the passage of the state–funded Approved Relative Caregiver (ARC) funding option program in 2014, relative caregivers of federally ineligible children can potentially receive the foster care payment rate (referred to as the basic rate), which varies in 2015–16 from $688 to $859 per month based on the age of the child. The ARC program is optional at the county level and several counties have chosen not to participate; as a result, some relative caregivers continue to receive the lower CalWORKs rate. Currently 47 counties have opted to participate in the ARC program.
FFHs. County–licensed foster homes, known as FFHs, are often the preferred placement option when a suitable relative caregiver cannot be found and the child does not have needs requiring a higher level of services. Counties recruit FFH caregivers and provide basic social work services to the approximately 10 percent of foster children statewide who resided in an FFH as of October 2015. In 2015–16, FFH caregivers receive the foster care payment basic rate of $688 to $859 per month (varying by the child’s age) for the care and supervision of each foster child in their home.
FFAs. The FFAs are the only primary placement type that does not directly house the children under their care. Instead, FFAs are private nonprofit agencies that recruit and certify foster caregivers, place children into FFA–certified homes, and provide supportive services to the children in their care, typically children with elevated needs compared to those placed in FFHs. Considered a less restrictive alternative to group home care, placement in an FFA is often the preferred option for children whose placement stability depends on greater social worker involvement and direct access to supportive services. Because they offer a wider array of services and typically serve children with higher needs, counties reimburse FFAs at a higher rate than either relative caregivers or FFHs. The FFA–certified caregivers receive the basic rate plus a $189 monthly supplemental payment known as the Child Increment. On top of this, FFAs are paid a monthly rate between $912 and $1,012 per child for the social work and administrative services they provide. Adding together the direct caregiver and FFA portions, the payment per child placed at an FFA in 2015–16 ranges from $1,789 to $2,060 per month (referred to as the FFA rate). As of October 2015, 27 percent of the state’s foster children were placed through an FFA.
Group Homes. Group homes—operated as private, nonprofit agencies—provide 24–hour care, supervision, and services to foster children with the highest levels of need, often children with significant emotional or behavioral challenges who have difficulty achieving stability in a home–based family setting. Professional staff provide the care and supervision as well as therapeutic and supportive services to children in group homes. Due in part to the absence of a parental caregiver, group homes are considered the most restrictive (except in the case of foster children supervised by probation agencies), least family–like foster care setting, and are generally the least preferred placement option. Because of their reliance on professional staff and provision of often intensive supportive services, group homes are compensated at higher rates than the other placement types. The Rate Classification Level System (RCL), which features 14 rate levels, determines group home provider payments. For 2015–16, providers receive between $2,391 (RCL 1) to $10,130 (RCL 14) per month per child, depending primarily on the qualifications of their staff and the number of staff hours they provide to children in their care. Services and treatments vary across group homes, but often include, particularly among higher level group homes, counseling and mental health treatment services. As of October 2015, approximately 10 percent of California’s foster children were living in group homes.
Other Placement Types. In addition to the four primary placement types described above, a suite of alternative options exist to serve children with distinct needs and circumstances. For example, these include supervised independent living arrangements for older, relatively more self–sufficient youth.
Summary of Monthly Foster Care Provider Rates. Figure 10 summarizes the foster care payment rate structure for the four primary placements types. Each carries different costs for the state and its federal and county funding partners.
Figure 10
Selected Monthly Foster Care Payment Rates by Placement Type
2015–16
|
Kin Caregivers |
Foster Family Homes |
Foster Family Agencies |
Group Homes |
|||
|
Relative Caregivers |
Non–Relative Caregivers |
|||||
|
Foster care payment rate |
$369 or $688–$859a |
$688 – $859 |
$688 – $859 |
$688 – $859 |
$2,391 – $10,130b |
|
|
Supplemental caregiver payments |
Specialized Care Incrementc |
Specialized Care Incrementc |
Specialized Care Incrementc |
$189 |
— |
|
|
Supplemental provider payments |
— |
— |
— |
$912 – $1,012 |
— |
|
|
aRelative caregivers caring for a child who is ineligible for federal financial participation and who live in a county that has chosen not to participate in the Approved Relative Caregiver Program receive the $369, CalWORKs child–only rate. All other relative caregivers receive the basic rate. bUnlike home–based care providers who primarily receive a rate based on the age of the child, group home rates are determined by the level of services they provide. Rate Classification Level (RCL) 14 is the highest level and most costly group home; RCL 1 is the least costly. Children are assigned to group homes based on the level of their service needs. cThe specialized care increment is a monthly supplemental payment available to kin and foster family homes caregivers at the county option for the care of children with elevated needs. |
||||||
Impetus for CCR
Longstanding concerns about the outcomes and costs of group home care led the Legislature to enact CCR legislation to reform the foster care system. CCR aims to reduce reliance on group homes and increase the capacity of home–based family placements.
Children in Group Homes Experience Poor Outcomes. The foster care system provides services for children from a variety of circumstances, each with varied strengths and needs. Those placed in group homes tend to be children with higher needs than the foster care population as a whole. Research suggests that group home placements are occasionally warranted, but long–term group home stays are associated with elevated rates of reentry into foster care, lower educational achievement, and higher rates of involvement in the juvenile justice system. Children placed in group homes remain in foster care longer and often have a more limited array of permanency options than their home–based family placed peers. Those who do not reunify with their families typically emancipate by aging out of foster care. Although a portion of children who age out of group homes may reconnect with their parents and extended family, others leave the foster care system with no life–long family relationships. We note that given the potentially higher needs of children placed in group homes, it is difficult to determine whether group home placements themselves directly lead to these poor outcomes.
Group Homes Are More Costly Than Home–Based Family Placements. As previously noted, group home placements can cost up to $10,130 per child per month depending on the level of care provided. In contrast, foster care payments for home–based family settings generally range from $688 per child per month for relative and FFH placements to $2,060 for FFA placements. We note, however, that there are certain home–based family placements, such as Intensive Treatment Foster Care (ITFC), that have significantly higher payment rates due to the level of services they provide. Placing children in group homes when they could be successfully served in home–based family settings may not only be less effective, but also a less efficient use of child welfare resources.
Concerns About the Adequacy of Home–Based Family Placements. Reducing reliance on group home placements has been a priority for the state for some time. One major challenge to reducing reliance on group home placements is having an adequate supply of home–based family placements, particularly those capable of caring for children whose elevated needs make them at risk for group home placement. Additionally, services and supports to enable home–based family caregivers to care for children at risk of group home placement are not available to all home–based family placement types, in some cases requiring children to move to more restrictive settings in order to receive necessary mental health and other supportive services. Ensuring the adequacy and availability of home–based family placements is a key consideration if reliance on group home placements is to be further reduced.
Years of Legislative Interest Leads to Reforming the State’s Foster Care System. Longstanding concerns surrounding poor outcomes for children growing up in group homes led the Legislature in 2012–13 to call for the creation of a stakeholder workgroup to recommend changes to the foster care system—known as CCR. Chapter 35 of 2012 (SB 1013, Committee on Budget and Fiscal Review) instructed the workgroup to develop revisions to the services available to children in out–of–home care as well as the rate systems that govern foster care payments. In 2015, DSS published its legislative report with 19 recommendations based on the workgroup’s findings. The 19 recommendations aim to improve the experience and outcomes of children in foster care and have largely been incorporated into AB 403. The CCR centers around several complementary goals—(1) ending long–term group home placements, (2) increasing access to supportive services regardless of whether a child is in a group home or home–based family setting, (3) utilizing universal child and family assessments to improve placement and service decisions, and (4) increasing transparency and accountability for child outcomes.
Major Changes Resulting From CCR
CCR Creates a New Placement Type
Short–Term Residential Treatment Centers (STRTCs) Replace Group Homes. Assembly Bill 403 seeks to end group homes generally as a placement option beginning January 1, 2017. (With certain exceptions on a case–by–case basis, some group homes may be allowed to continue to operate as group homes past January 2017.) STRTCs will replace group homes as the placement setting for children who cannot safely be placed in home–based family settings, providing a similar level of supervision as group homes, but with expanded services and supports. In contrast to group homes serving as long–term placements for children for whom home–based family placements cannot be found, STRTCs are intended to provide short–term, intensive treatment to allow children to successfully transition to a family setting as quickly and successfully as possible. Assembly Bill 403 restricts STRTC placements to children who have been assessed as requiring the level of behavioral and therapeutic services that STRTCs will be required to provide. Children whose level of need qualifies them for STRTC placement include, among others, those assessed as seriously emotionally disturbed and victims of commercial sexual exploitation. To ensure the ongoing appropriateness of all STRTC placements, resident children’s case plans will be subject to review every six months by the director or deputy director of the supervising county child welfare or probation department. The case plans will specify the reasons for the child’s placement, the expected duration of stay, and the transition plan for moving the child to a less restrictive environment.
CCR Efforts to Increase Access to Necessary Services and Supports
CCR Expands the Set of Core Services FFAs and STRTCs Are Required to Provide. Among other activities, FFAs currently engage in foster parent recruitment, retention, and certification, and employ social workers to support the children in their care through more frequent interactions than county social workers have historically been funded to provide. (We note AB 403 also authorizes counties to operate their own FFA.) Group homes, particularly high–level ones, administer a range of therapeutic and supportive services in addition to providing direct care and supervision. Under CCR, STRTCs and FFAs will be required to ensure access to specialty mental health services and strengthen their permanency placement services by approving families for adoption, providing services to help families reunify, and giving follow–up support to families after a child has transitioned to a less restrictive placement. Assembly Bill 403 requires several other core services to be made available, including, but not limited to, educational, health, and social supports. The specifics around the new core services that FFAs and STRTCs will have to directly or indirectly provide is currently under development.
CCR Calls for Additional Integration Between Child Welfare and Mental Health Services. Prior to CCR, the state was working to ensure that CWS–involved children obtain medically necessary mental health services. CCR builds on these efforts by requiring all FFAs and STRTCs to either (1) maintain certification from the Department of Health Care Services (DHCS) or county Mental Health Plans (MHPs) to provide mental health services directly or (2) contract with mental health providers to serve children in their care.
Quality Improvement and Oversight Under CCR
STRTCs and FFAs Required to Obtain National Accreditation. CCR seeks to improve the quality of residential services by requiring all STRTCs and FFAs to maintain accreditation from a nationally recognized accreditation body. Accreditation typically involves an in–depth review of an organization in order to confirm it meets recognized service standards. Reaccreditation will reoccur every three years as a means of ensuring continuous quality improvement and maintenance of high operating standards into the future.
FFA and STRTC Performance Measure Dashboard for County Placement Agencies and the Public. CCR calls for the development and promulgation of publicly available FFA and STRTC performance measures. DSS intends for these indicators—for example, on rates of successful family reunifications, placement stability, client satisfaction, educational achievement, and health and safety standards—to inform placement decisions. Assembly Bill 403 specifies January 2017 as the launch date for the public dashboard. Initially, the indicator dashboard will likely feature only a subset of the measures that will ultimately be included, and then be gradually expanded as the system undergoes continued development and additional FFA and STRTC performance data become available.
CCR Changes to the Caregiver Approval and Placement Processes
Resource Family Approval (RFA) Replaces the Existing Multiple Approval, Licensing, and Certification Processes for Home–Based Family Caregivers. Before foster caregivers may receive foster care payments, they must be approved, certified, or licensed to provide care. Currently, the approval process differs by placement type—for example, FFHs are licensed according to one set of criteria while relative caregivers are approved under a different set. The CCR replaces the multiple approval standards currently in place with a unified assessment that incorporates a psychosocial evaluation, risk assessment, and permanency assessment for all prospective home–based family caregivers. Unlike the previous multiple, overlapping approval processes, the RFA process will automatically qualify a foster family for guardianship and adoption. Once the transition to RFA is complete, all home–based family placements will be approved as “resource families.” Currently underway in five early–implementer counties, the rest of the state will convert to the resource family approval process for all new home–based family caregivers on or before January 1, 2017.
More Collaborative, Child–Centered Decisions Through the Use of Child and Family Teaming. To increase child and family involvement in decisions relating to foster children’s care, CCR mandates the use of child and family “teaming” through every stage of the case planning and service delivery process. The child and family team may include, as deemed appropriate, the affected child, her or his custodial and noncustodial parents, extended family members, the county caseworker, representatives from the child’s out–of–home placement, the child’s mental health clinician, and other persons with a connection to the child. Members of the team will meet as needed to discuss and agree on the child’s service plan whenever an important foster care decision is being made.
Needs Assessment to Inform Placement and Services Decisions. CCR calls for children to receive a comprehensive strengths and needs assessment upon entering the child welfare system to improve placement decisions and ensure prompt access to supportive services when they are determined to be necessary. The assessment is expected to utilize a structured assessment tool that will be administered by a child welfare worker, the results of which will inform decisions made by the child and family team.
CCR’s New Requirements Lead to the Development of New Rate Structures
New STRTC and FFA Payments Rates Are Currently Under Development. Generally, pursuant to AB 403, the RCL system featuring 14 separate group home reimbursement rates and the current FFA rate structure will sunset and be replaced by a new set of rates that will take effect beginning January 2017. These new rates are expected to reflect the expanded set of responsibilities CCR places on STRTCs and FFAs. Under consideration by DSS and a stakeholder workgroup is a system whereby a child’s needs assessment determines, at least in part, the rate that the child’s caregiver and supportive service provider(s) are entitled to. This could potentially allow, for example, a county to contract or provide supportive services for children in home–based family placements other than FFA–certified homes. This would be in contrast to the current foster care payment rate system whereby a child’s placement generally determines the foster care payment rate and services that the child receives. Rate development remains a fluid process, however, and it is unknown at this time how rates will be structured in a way that increases access to services for all children in home–based family settings. Stakeholder workgroups focused on rate development are currently meeting, and it is our understanding that a new rate system will be ready in March 2016.
Overview of the Governor’s Budget for CCR
The Governor proposes $61 million from the General Fund ($95 million total funds) to continue to implement CCR in 2016–17. The proposed General Fund spending represents an increase of $39 million over the $22 million General Fund ($34 million total funds) provided for CCR in 2015–16. We note that the 2015–16 funding for CCR is allocated primarily toward foster parent recruitment and retention and a rate increase for FFAs. As with 2015–16, most of the Governor’s proposed spending for 2016–17 is dedicated to the county child welfare and probation departments that directly administer CWS, with a small portion of the proposed funding for additional positions at DSS and DHCS to provide regulatory, implementation, and administrative support to their county partners. Figure 11 summarizes how the proposed state CCR implementation spending is allocated among the various state and local entities.
Figure 11
2016–17 Proposed Continuum of Care Reform State Spending
(In Millions)
|
General Fund |
2015–16 Estimated |
2016–17 Proposed |
Change |
|
Local assistance to county welfare and probation departments |
$21.5 |
$57.5 |
$36.0 |
|
Department of Social Services—state support |
0.5 |
3.0 |
2.5 |
|
Department of Health Care Services and local assistance to county mental health plans |
— |
0.4 |
0.4 |
|
Totals |
$22.0 |
$60.8 |
$38.8 |
Proposed CCR Spending Includes New Assumed Costs and Savings for County Implementation
The Governor’s proposed budget provides funding for the next round of CCR implementation. Most major components of AB 403 become effective on January 1, 2017, requiring significant implementation efforts by the state, counties, and foster care providers in advance of that date. The Governor’s 2016–17 proposed budget recognizes new state General Fund costs associated with CCR implementation and accounts for offsetting county savings from the elimination of duplicative foster caregiver approval processes and the transition of children out of group homes into home–based family placements. The total funding proposed from the General Fund for CCR implementation for counties in 2016–17 is less than it would be if these county savings were not assumed by the budget. It is important to note that the offsetting county savings associated with CCR are accounted for in this way due to 2011 realignment, which, as we previously discussed, established that the state must provide funding to counties equivalent to the net cost of new state policy requirements. We describe the Governor’s estimated CCR costs and savings in more detail below.
Over Half of the Governor’s Proposed Spending Is for Foster Parent Recruitment and Support. Reducing the state’s reliance on group home and STRTC placements depends on FFA and child welfare and probation departments’ ability to recruit and retain home–based family caregivers for the children expected to leave group homes over the next several years. The 2015–16 budget provided $17.2 million General Fund ($25.8 million total funds) to support county efforts to increase the supply of home–based family caregivers. To receive recruitment and retention funds, county child welfare and probation departments had to submit county plans to DSS identifying how they would use the funds to train, recruit, retain, and support home–based family caregivers. In 2015–16 allowable uses of the funding provided to these county departments included: (1) staffing to provide direct services and supports to foster caregivers, (2) foster care payment supplements to support caregivers of children with exceptional needs, and (3) intensive relative finding and engagement. Budget–related legislation in 2015–16 requires DSS to report to the Legislature during 2016–17 budget hearings on counties’ uses of these funds as well as the outcomes achieved. For 2016–17, the Governor builds on the 2015–16 appropriation, proposing a total of $32 million General Fund ($47 million total funds) to help counties increase the supply of high–quality, home–based family placements. About half of 2016–17’s proposed spending is intended for county probation departments, which in 2015–16 received a small fraction of the recruitment and retention funding. At this time it is unclear whether the proposed 2016–17 funds will be allocated to counties using the same methodology used in 2015–16.
RFA Implementation Results in Net Costs. The Governor proposes $11 million General Fund ($16 million total funds) to assist counties as they transition to the unified RFA process. This funding represents the estimated net cost to counties of implementing RFA after accounting for assumed total county savings of roughly $19 million in 2016–17. On the cost side, RFA imposes additional training requirements on home–based family caregivers and expands the set of assessment criteria that child welfare workers have to apply before approving a caregiver as a qualified placement. On the savings side—and among other expected efficiencies—the switch to RFA eliminates the need to carry out adoption assessments for caregivers already approved as resource families and is expected to encourage placement stability, thereby reducing the total number of caregiver approvals by incorporating permanency considerations into the initial placement decision. The transition to RFA will be a multiyear effort as counties initially need only apply RFA to new home–based family placements. By 2019, however, all home–based family placements will have to convert to RFA, which will require the reassessment of existing foster and kin caregivers.
Funding for Proposed Child and Family Teaming (CFT) Activities. The CCR requires the use of a multidisciplinary, team–based approach to placement and other decisions that affect a child receiving CWS. The Governor’s budget recognizes that this new approach increases workload at the county level since it requires the coordination of team–based decision–making among multiple parties. After accounting for the components of CFT that were in place before 2011 realignment and therefore already incorporated into county funding, the Governor’s budget includes $10 million General Fund ($14.4 million total funds) for a half year of implementation for this component of CCR.
Remaining Proposed Funding for a Variety of CCR–Related Activities. The remaining $11 million General Fund ($18 million total funds) proposed for CCR implementation at the county level in 2016–17 is intended to (1) maintain the FFA rate increase enacted in 2015–16 given caseload growth, (2) implement needs assessments and STRTC case reviews, (3) help cover a portion of initial FFA and STRTC accreditation costs, (4) update child welfare workers’ case management system, and (5) develop the provider performance indicator dashboard. Also included in the Governor’s proposal is approximately $200,000 General Fund ($400,000 total funds) for county MHPs to ensure children in STRTCs are appropriately placed.
Savings Due to Lower Foster Care Payments Expected to Materialize in 2016–17. While the Governor’s proposal does not provide a long–term outlook for CCR–related General Fund costs, the 2016–17 CCR proposal assumes that county savings related to lower foster care payments, which offset the above estimated costs, begin to accrue in 2016–17. These savings are due to an assumed steady transition of about 2,500 children out of group homes into less costly home–based family placements over the first three years after CCR becomes effective. For 2016–17, the Governor projects $6.4 million in county savings as a result of shifting children to less costly placements, which offset the General Fund contribution that would otherwise be necessary to implement CCR’s other mandated activities. We note that although CCR requires a new rate structure for STRTCs and FFAs, these new rates were still under development at the time of the Governor’s budget. In the absence of new rates for STRTCs and FFAs, the Governor’s budget uses the rates currently paid to RCL 14 group homes and ITFC providers as placeholder figures for the new provider rates under CCR.
Summary of Governor’s Estimated Costs and Savings for 2016–17 CCR County Implementation. Figure 12 shows the Governor’s estimated costs and assumed county foster care payment savings for the major components of the 2016–17 CCR budget proposal that will be implemented by counties (that is, apart from state operations expenditures).
Figure 12
Proposed CCR State Spending for County Child Welfare and Probation Department Implementation
(In Millions)
|
Activity |
2015–16 |
2016–17 |
Change From 2015–16 |
|||||
|
General Fund |
Total Funds |
General Fund |
Total Funds |
General Fund |
Total Funds |
|||
|
Foster parent training, recruitment, retention, and support |
$17.2 |
$25.8 |
$32.2 |
$47.4 |
$15.0 |
$21.6 |
||
|
Resource Family Approvala |
— |
— |
11.2 |
16.2 |
11.2 |
16.2 |
||
|
Child and family teaming |
— |
— |
9.7 |
14.4 |
9.7 |
14.4 |
||
|
2015–16 FFA rate increase |
4.3 |
7.3 |
4.5 |
7.6 |
0.2 |
0.3 |
||
|
Case planning assessment, reviews, and training |
— |
— |
4.4 |
6.6 |
4.4 |
6.6 |
||
|
Accreditation |
— |
— |
1.4 |
2.8 |
1.4 |
2.8 |
||
|
Automation and performance measure development |
— |
— |
0.5 |
0.8 |
0.5 |
0.8 |
||
|
Assumed foster care payment savings at the county levelb |
— |
— |
–6.4 |
–7.3 |
–6.4 |
–7.3 |
||
|
Totalsc |
$21.5 |
$33.1 |
$57.5 |
$88.6 |
$36.0 |
$55.5 |
||
|
aEstimated total spending for Resource Family Approval is net of estimated county savings, which are estimated at approximately $19 million in total funds. bAssumed foster care payment savings offset the costs of the other proposed CCR activities, reducing the total estimated state funding for CCR implementation. cThis figure does not include the approximately $3.4 million General Fund ($6.4 million total funds) in the Governor’s proposed budget to support DSS state operations, DHCS state operations, and county Mental Health Plans’ CCR implementation efforts. CCR = Continuum of Care Reform; FFA = Foster Family Agency; DSS = Department of Social Services; and DHCS = Department of Health Care Services. |
||||||||
State Operations Spending
The Governor Proposes New Positions at DSS and DHCS for CCR Implementation. In 2015–16, DSS received $500,000 for two new positions to administer the foster parent recruitment, retention, and support funding. The 2016–17 proposed budget requests temporary funding (three years) of $2.5 million in General Fund ($5 million total funds) to add 34.5 new positions at DSS to form a CCR implementation team to, among other responsibilities, oversee policy development as well as a robust stakeholder workgroup process.
For 2016–17, DHCS requests $175,000 General Fund ($350,000 total funds) to help STRTCs obtain mental health certification. Across the state there are over 700 group homes, a subset of which will likely seek mental health certification as they convert to STRTCs. If an STRTC chooses to provide the services directly, CCR requires that it obtain certification from DHCS or a county MHP. DHCS requests additional resources to support one permanent position and temporary funding for two positions to directly certify the new STRTCs and assist county MHPs that choose to carry out STRTC certification themselves.
LAO Assessment
Governor’s Proposal Is a Logical Next Step for CCR Implementation
Full implementation of AB 403 is expected to be a multiyear effort. Funding for CCR implementation began in 2015–16 with an augmentation for counties to increase outreach, recruitment, and support for foster parents and to provide an increase to the FFA rate. The Governor’s 2016–17 proposal builds upon the 2015–16 efforts, and continues to primarily focus early implementation efforts on building capacity in home–based family settings while beginning to phase in other components of CCR implementation. We have reviewed the Governor’s proposal for new positions at DSS and DHCS. Given the magnitude of the CCR implementation efforts, we find them to be reasonable. We note that the request for DSS positions includes limited term funding, which will allow the Legislature to reevaluate the ongoing CCR workload when implementation is further along. Overall, we find that the Governor’s proposal is a logical next step in the implementation of CCR, but recognize that many uncertainties continue to surround CCR implementation. We highlight several of these key uncertainties in this section.
Considerable Fiscal and Programmatic Uncertainties Surround CCR Implementation
Because CCR results in a fundamental shift in the way CWS are delivered in California, large uncertainties surrounding the total fiscal impact and programmatic challenges of the reform package remain. The Governor’s budget recognizes that implementation will result in up–front costs for the counties. Offsetting those costs are assumed county savings that are projected to materialize beginning in 2016–17. These offsetting savings are uncertain because they are based upon particular assumptions about rates (which have not been finalized) and other assumptions about the number and speed at which children will exit group homes (which will depend upon the availability of home–based family caregivers). Ultimately, the future costs or savings from CCR are contingent on a host of interconnected factors, including the new STRTC and FFA foster care payment rates that DSS develops, the rate at which children exit group homes to home–based family care, and which home–based family settings are most heavily utilized following the closure of group homes. Programmatically, the ability of counties to recruit and support additional home–based family caregivers will be critical to CCR’s success.
Availability of New Home–Based Family Placements Key to CCR’s Success. Currently, over 5,500 children reside in group homes. DSS projects that around 2,500 of these children will gradually transition to home–based family placements over the three years following implementation. Child welfare and probation departments are developing strategies to better identify and support home–based family settings for children transitioning from group homes.
Recognizing the necessity of finding new home–based family caregivers under AB 403, the Governor dedicates nearly half of new CCR spending to counties for foster parent recruitment and retention. County welfare and probation departments’ ability to translate these funds into additional home–based family caregivers is unknown at this time. As we have noted, AB 403 requires DSS to report at upcoming legislative hearings on the recruitment and retention efforts currently underway. Without a considerable increase in the number of home–based family placements, CCR’s goal of reducing the state’s reliance on long–term group home placements cannot be met.
The Speed at Which Children Will Leave Group Homes Is Unknown. In estimating 2016–17 savings for counties, DSS assumes a steady transition of children out of group homes and into STRTCs or home–based family placements. What the exit rate will ultimately be is subject to significant uncertainty, such as the extent to which group homes successfully petition for license extensions past CCR’s January 1, 2017 implementation date. By January 2019, all child welfare group home placements must cease, but probation group home placements may potentially continue indefinitely. In both the short and long run, children remaining in group homes will add cost pressures to CCR that may affect its net fiscal impact.
New Rate Structures for FFAs and STRTCs Are Still Under Development. The new rate structures currently under development will take into account the new requirements of CCR—accreditation, mental health certification, CFT, and the augmented slate of core services that FFAs and STRTCs must provide. The near finalization of regulations surrounding new core service requirements is a precondition to the final adoption of a rate system since the payments providers receive must take into account the services they will be required to provide. Moreover, as previously noted, alternative rate models may be considered that would tie, at least in part, the rate a child’s caregiver and service provider receive to the child’s needs assessment rather than the child’s placement type. Which model is ultimately adopted will likely have important programmatic and fiscal effects, which are unknown at this time.
CCR’s Net Costs Will Ultimately Depend on Speed of Transition and Finalization of Rates. The level at which the state sets rates will help determine CCR’s fiscal impact. Higher rates for children in STRTCs and FFAs than what the Governor’s budget assumes will erode potential savings accruing from transitioning children out of group homes, even more so if that transition is slower or less complete than anticipated.
As we have noted, the administration’s estimates of foster care payment savings assumes that the rates paid to FFAs and STRTCs will be roughly similar to those in place today. While we recognize that this approach is prudent in the absence of new, finalized rates, using current rates could underestimate the future costs of STRTC and FFA provider payments, potentially underestimating total General Fund costs for CCR implementation. The administration will be releasing the rate structure in March, at which time it should have a better estimate of potential costs and savings.
Realignment May Complicate Budgeting for CCR Implementation. As we have noted, under 2011 realignment, if the state places new requirements on counties, it must provide state resources to reimburse counties for the new costs. Counties are not required to implement any changes in state policy that increase overall program costs unless the state provides funding to cover those increased costs. The Governor’s budget attempts to compensate counties for the increased net costs associated with CCR, but as we have noted, current estimates are based on a number of assumptions. We think it is reasonable to assume counties could realize some level of savings as children transition out of group homes and that these savings could be used to offset the state’s cost for CCR. However, the net impact on counties will ultimately depend upon the finalization of rates and the speed at which children transition from more costly care. Adding to the uncertainties, there may be wide variation in the speed and level of savings achieved across the various counties.
Uncertainties Surrounding Mental Health Services and Certification. Assembly Bill 403 requires that all STRTCs and FFAs either obtain mental health certification from DHCS or county MHPs or contract with a certified mental health provider. For FFAs and STRTCs, there is some uncertainty around what certification will require and who will be the certifying entity or entities. It is our understanding that counties have concerns that insufficient resources are being provided for MHPs to prepare for the influx of new applicants and potential service recipients should the plans have a direct role in certifying providers and administering services to these additional children. The Governor proposes funding for DHCS and MHPs to carry out CCR–related workload, but the augmentation is limited to what is needed to serve STRTCs. FFAs facing the same rules as STRTCs do not appear to be accounted for in the Governor’s mental health–related budget augmentations. It is unclear whether there may be additional General Fund cost pressures associated with the mental health certification of FFAs. DSS is convening a workgroup with DHCS and representatives from the county MHPs to focus on the role of mental health in CCR. Additionally, the administration is considering legislation that will provide more clarity on the mental health component of CCR.
Key Issues for Legislative Consideration
Overall, we find the Governor’s proposal to continue the implementation of CCR to be a reasonable next step. We also find the Governor’s request for additional positions at DSS and DHCS to oversee and implement CCR to be reasonable and raise no concerns at this time. We do, however, make some suggestions for the Legislature to consider as it evaluates the proposal. These suggestions are primarily focused on gaining additional clarity around the key issues of uncertainty we raise in this analysis.
CCR Implementation Costs and Savings Subject to Change Once New Rates Are Finalized. The long–term cost of CCR largely depends on the savings achieved from children exiting group home care. Due to the absence of finalized rates in the Governor’s January budget, the likelihood and extent of county savings from lower foster care payments is uncertain. The Legislature will want to revisit the proposed CCR implementation funding once new provider rates are developed in March, at which time more accurate savings and costs can be estimated.
Use Budget Deliberations to Gain Clarity on Key Aspects of the Proposal. As we have noted, there are several other components of CCR that create some uncertainty. The Legislature may wish to use the upcoming budget process to ask the administration some clarifying questions around these areas of uncertainty. The following are some key issues for the Legislature’s consideration:
- Addressing Realignment Challenges. Given the uncertainty surrounding CCR’s net costs or savings, how will the administration ensure that it is accurately funding counties for the newly required activities under CCR? How will the administration track county savings attributable to CCR on an ongoing basis?
- How Core Services Will Be Made Available to All Children. Once the rates are developed, the Legislature may want to ask the administration to provide greater detail to demonstrate if and how the new rate structure increases access to core services for all children regardless of placement setting.
- Recruitment and Retention Funding. The ability to recruit and retain home–based family placements is important to the success of CCR. Under current law, the administration is required to report in budget hearings on counties’ uses of these funds, providing an opportunity for the Legislature to oversee the strategies, allocation amounts, and progress of the funding. Given the increased funding for this effort, the Legislature may consider requiring the department to include other oversight measures in this report in the upcoming budget process, such as the number of home–based families recruited and key recruitment and retention challenges counties are experiencing.
- Role of Mental Health. Based on progress from the mental health workgroup process, and deliberations on potential legislation to clarify the role of mental health in CCR, what is the most up–to–date vision of how mental health will be further integrated with CWS under CCR?