LAO Contacts

February 8, 2017
Volatility of the Personal Income Tax Base
- Introduction
- The BEA Personal Income Measure
- California’s PIT Tax Base
- Measuring Volatility
- AD of Personal Income and PIT Tax Base
- LAO Comments
Summary
This brief provides some perspectives on the volatility of California’s personal income tax (PIT) base.
California’s Income Tax Base Much More Volatile Than Statewide “Personal Income.” Personal income is a widely used measure of the size of California’s economy, as reported quarterly by the U.S. Bureau of Economic Analysis (BEA). From 1990 to 2014, California personal income grew fairly consistently, with only a limited degree of volatility. On the other hand, the state’s PIT tax base was much more volatile than personal income. This is because (1) some of the more stable pieces of personal income are not taxed under California’s PIT and (2) the PIT tax base includes capital gains (gains on sales of stock, bonds, certain homes, and other assets), which are extremely volatile from year to year and are not counted by BEA in personal income. In an effort to protect the state budget from some of the volatility of capital gains, California has adopted a constitutional provision requiring PIT deposits into a state rainy‑day fund in years when capital gains are plentiful.
This Brief Discusses Part of the Picture . . . Not the Whole Picture. This brief examines the volatility of the PIT tax base—one important element of the PIT’s overall volatility—but this does not provide the whole picture. Specifically, this brief does not consider how the state’s progressive PIT rate structure (in which high‑income Californians pay a bigger fraction of their income than lower‑ and middle‑income Californians), deductions, exemptions, and credits affect the volatility of PIT revenues paid to the state. We anticipate discussing the volatility resulting from some of these other choices—choices the state has made about how to tax its PIT tax base—in future analyses.
Introduction
In this brief, we provide perspectives on the volatility of California’s personal income tax (PIT) base. The PIT is state government’s most important revenue source, making up about two thirds of the state General Fund. This fund supports schools, universities, major health and social services programs, prisons, and other state‑funded programs. In this brief, we compare the PIT tax base to personal income, a broad measure of the state’s economy produced by the U.S. Bureau of Economic Analysis (BEA), and examine how these two factors change from year to year (that is, the volatility of both PIT and BEA’s personal income measure). Specifically, this brief discusses:
- BEA’s personal income measure.
- How BEA’s personal income measure compares to the tax base of California’s PIT.
- A measure of the year‑to‑year volatility of income and taxes: “average deviation” (AD).
- The AD of major elements of California’s PIT base, such as wages and capital gains. This will help illustrate what drives the volatility of the tax base.
- Some brief perspectives on the implications of PIT tax base volatility.
Part of the Picture . . . Not the Whole Picture. This brief examines the volatility of the PIT tax base. This is one important element of the PIT’s overall volatility, but does not provide the whole picture. In particular, since the state’s PIT structure is progressive (meaning that higher‑income people pay a bigger fraction of their income in income taxes than lower‑income people do), some elements of this PIT base are effectively taxed at higher rates than other elements. This brief does not consider directly how tax rate progressivity, deductions, exemptions, or credits affect volatility of PIT revenues paid to the state. We anticipate discussing the volatility resulting from some of these other choices—choices the state has made about how to tax its PIT tax base—in future analyses.
Back to the TopThe BEA Personal Income Measure
Personal income is measured quarterly by BEA, and it is a key economic statistic that we track to measure the rate of growth of the state and national economies. As shown in Figure 1, wages and salaries make up nearly half of BEA personal income for California. Below, we describe what is included in this personal income measure, starting with the biggest component of personal income: wages and salaries.
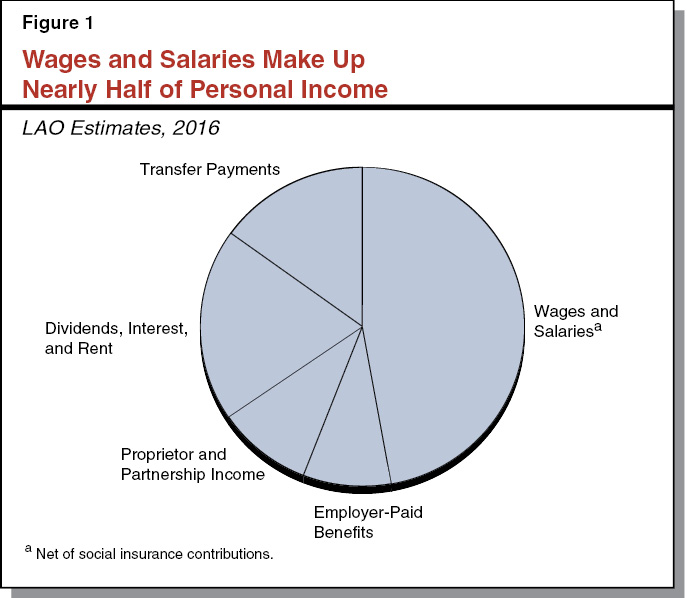
Wages and Salaries. BEA measures wages and salaries before deductions (such as payroll taxes and employees’ 401[k] contributions). Wages and salaries include commissions, tips, bonuses, and gains from exercising stock options.
Dividends, Interest, and Rent. BEA’s personal income measure includes cash payments of dividends, interest, and rent. It also includes two categories of income—called imputed rent and imputed interest—that do not directly give people more cash to spend. Imputed rent is the estimated amount that homeowners would have to spend if, instead of owning, they rented their own homes. The idea of imputed rent is that not having to pay rent effectively gives homeowners more income. Imputed interest includes investment income earned on insurance policies, the value of implicit services provided by banks and other lenders, and interest earned on employee pension plans.
Transfer Payments. Transfer payments consist mainly of government payments to and for the benefit of individuals, such as Social Security, disability payments, Medicare and Medicaid payments, unemployment insurance benefits, and veterans’ benefits. The only private transfer payments are personal injury liability payments and corporate gifts to nonprofits.
Proprietors’ and Partnership Income. This category in the BEA personal income measure refers to the net business income from proprietorships (typically small businesses with a single owner) and partnerships (a form of small business organization with multiple owners). Farm income typically accounts for about 5 percent of this category’s total in California.
Employer‑Paid Benefits. This includes the value of employer contributions to employee pension and insurance plans including health, life, workers’ compensation, and unemployment. (The employer portion of the payroll taxes for Social Security and Medicare is listed under “benefits” in BEA’s data tables but is omitted from tables in this brief because it has no net effect on personal income.)
Back to the TopCalifornia’s PIT Tax Base
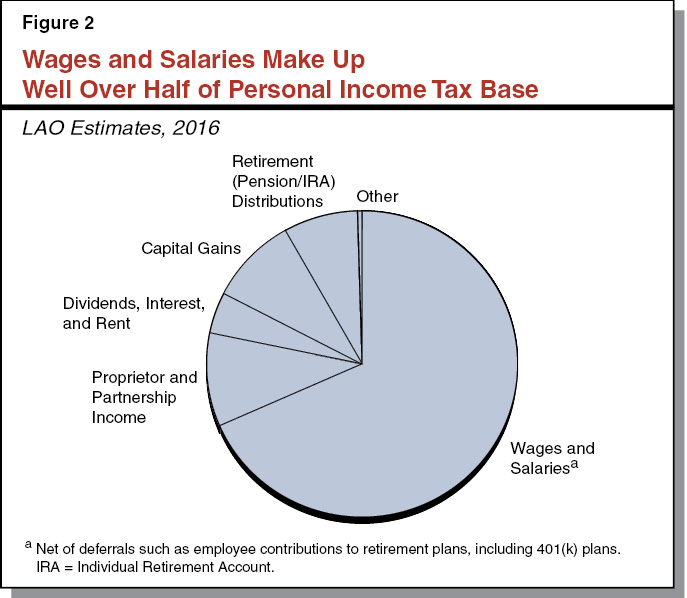
The tax base used by California for its personal income tax is similar to the federal government’s, but is set in state law. Figure 2 summarizes the major components of the state’s PIT tax base as reported on federal and state tax forms. It shows that well over half of the base consists of wages and salaries. A comparison of Figure 1 and Figure 2 reveals some of the differences between BEA personal income and the state’s PIT tax base. In this section, we will describe some of these differences. In general, California chooses to tax most, but not all, elements of BEA personal income, and it also chooses to tax some types of income not included in the BEA personal income measure.
PIT Does Not Tax Some Elements of Personal Income. For each piece of personal income measured by BEA, the taxable component (that is, the part of personal income taxed by California’s PIT) is smaller than the total income in that category. There are various reasons for these differences:
- Non‑Reporting or No Requirement to Report Certain Income on Tax Returns. In the cases of wage and salary income and business income from proprietorships and partnerships, the discrepancies likely stem from taxpayers not reporting (or not being required to report) all of their income on PIT tax returns. This occurs for various reasons. For example, residents with total income low enough to have a state tax liability of zero are not required to file, although many indeed file state returns. For purposes of this brief, we exclude the non‑filers’ income from the PIT tax base as we have no data on their income and would not be able to estimate it with any precision. In addition, underreporting of business income on tax returns is a longstanding issue at both the federal and state levels.
- Some Elements Generally Excluded From PIT Base. PIT wages and salaries deduct employee retirement contributions (such as those to 401[k] plans) and other elective deferrals. In addition, under federal and state tax laws, essentially none of the items classified as employer‑paid benefits are taxable at the time the contribution is made. For example, California does not tax pension contributions when they are made but rather taxes pension income employees receive in retirement. Similarly, essentially none of the items classified as transfer payments are taxable under the state PIT. Some Social Security payments, however, are taxable at the federal level.
- Most Dividends, Interest, and Rent in BEA Measure Not Taxed. Only a small fraction of income from dividends, interest, and rent is taxable at the state level. The state does not tax imputed rent. Dividends and interest received by pension and life insurance plans are not counted as income for tax purposes in the year the plans’ investments generate that income.
PIT Taxes Some Dollars Not Included in BEA Personal Income. Two significant pieces of the PIT base—capital gains and retirement distributions—are not defined as being part of personal income. A capital gain is the difference between the selling price of an asset (stock, bond, building, etc.) and the asset’s original purchase price. Asset sales are not included in BEA’s estimates of personal income or output. Distributions from pensions and individual retirement accounts often are taxable in the year that they are withdrawn, but BEA has already counted them as personal income once when the initial contributions were made. In other words, in the year the withdrawals happen, this income is counted in the PIT base, but not in BEA personal income.
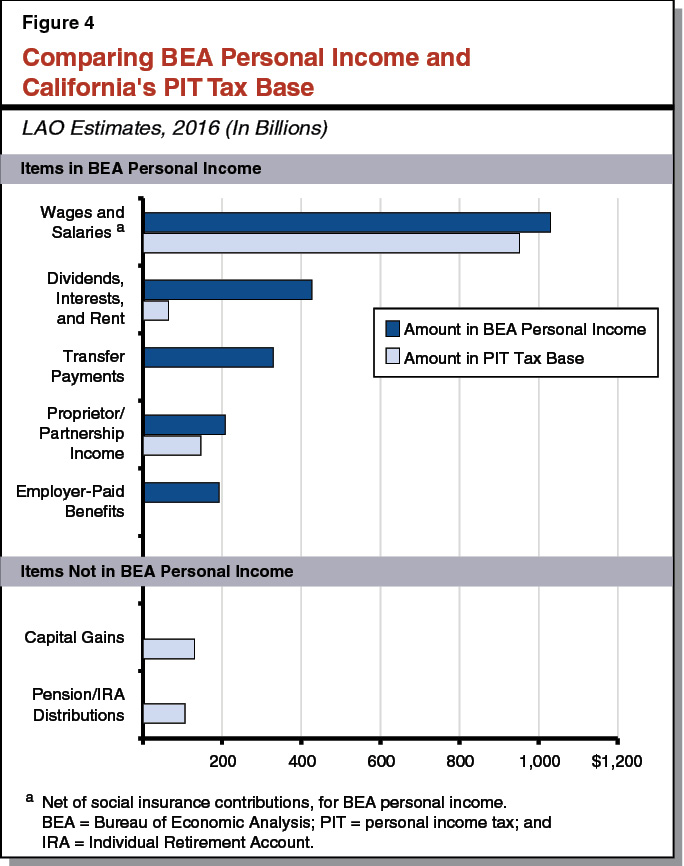
Summary. Figure 3 summarizes what is counted in BEA personal income versus the categories of income in California’s PIT base, using our office’s most recent estimates for 2016. (Figure 4 displays the same data graphically.) As shown, $1.15 billion of the state’s $2.2 billion in BEA personal income is included in the PIT tax base. In addition, around $240 billion of additional income—from capital gains, as well as distributions from pensions and other retirement accounts—is taxed by California, but not counted in the BEA personal income measure for 2016. Wages and salaries make up the largest portion—by far—of both California’s BEA personal income tax base and its PIT tax base. Capital gains and retirement distributions are a small part of the PIT tax base and are not a part of BEA’s annual personal income calculation at all.
Figure 3
Comparing BEA Personal Income and California’s PIT Tax Base
LAO Estimates, 2016 (In Billions)
|
Type of Income |
Amount in BEA Personal Income |
Amount in PIT Tax Base |
|
Wages and salaries |
$1,030a |
$955 |
|
Employer‑paid benefits |
192 |
— |
|
Proprietor and partnership income |
208 |
138 |
|
Dividends, interest, and rent |
426 |
61 |
|
Transfer payments |
329 |
— |
|
Items in BEA Personal Income |
$2,185 |
$1,153 |
|
Capital gains |
— |
$128 |
|
Retirement (pension/IRA) distributions |
— |
108 |
|
Other |
— |
7 |
|
Items Not in BEA Personal Income |
— |
$243 |
|
Totals |
$2,185 |
$1,396 |
|
aNet of social insurance contributions. BEA = U.S. Bureau of Economic Analysis; PIT = personal income tax; and IRA = Individual Retirement Account. |
||
Measuring Volatility
In assessing the state’s revenue situation, it is important to look at the year‑to‑year changes in various data series, such as personal income and the PIT base. When data show more variability in annual changes, they are said to be more volatile.
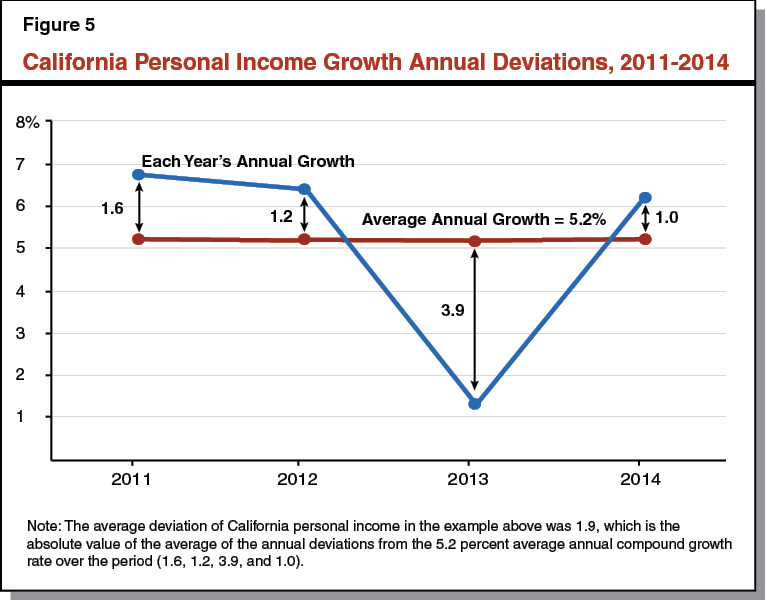
There are many ways to measure volatility. One such measure is AD. AD summarizes—for a given time period—how many percentage points the data deviate from the average annual compounded growth rate.
Figure 5 illustrates AD for California’s BEA personal income growth between 2010 and 2014. Personal income’s compound annual growth rate over this specific four‑year period was 5.2 percent, as shown on the red line. The growth rate in 2011 was 6.8 percent, which is 1.6 percentage points above the compound annual growth rate, so the annual deviation for 2011 is 1.6. (Because the sum of positive and negative deviations is approximately zero, the AD calculation has to use the absolute value [always a positive number] of each annual deviation.) In 2013 the growth rate was 1.3 percent, or about 3.9 points below the 5.2 percent average annual growth rate, so the annual deviation is positive 3.9. The average of all four annual deviations in Figure 2 (1.6, 1.2, 3.9, and 1.0) is 1.9 percentage points, which produces an AD of 1.9. This means that if the pattern that held from 2010 to 2014 continues into the future, personal income growth would, on average, deviate from its average growth rate by plus or minus 1.9 percentage points each year. The higher the AD of an income or tax, the more volatile it is—tending to move more up or down each year, compared to the average annual growth rate over time.
AD of Personal Income and PIT Tax Base
Figure 6 summarizes the AD of each major element of California’s personal income and PIT tax base over the period from 1990 to 2014. In this section, we discuss these measures of volatility.
Figure 6
Volatility of California Personal Income Tax and the Personal Income Tax Base
Average Deviation in Percentage Points, 1990‑2014
|
Type of Income |
Average Deviation of Amounts: |
|
|
In BEA Personal Income |
In PIT Tax Base |
|
|
Wages and salaries |
2.8 |
3.4 |
|
Employer‑paid benefits |
3.4 |
— |
|
Proprietor and partnership income |
4.7 |
6.4 |
|
Dividends, interest, and rent |
4.6 |
12.5 |
|
Transfer payments |
3.0 |
— |
|
Items in BEA Personal Income |
2.3 |
4.0 |
|
Capital gains |
— |
35.3 |
|
Retirement (pension/IRA) distributions |
— |
3.7 |
|
Items Not in BEA Personal Income |
— |
18.5 |
|
Overall |
2.3 |
6.3 |
|
BEA = Bureau of Economic Analysis; PIT = personal income tax; and IRA = Individual Retirement Account. |
||
BEA Personal Income Not Very Volatile. As shown in Figure 6, the AD of California’s BEA personal income was 2.3 over the 1990 to 2014 period. For that 24‑year period, the average annual growth rate of personal income was 4.8 percent. Therefore, the AD of personal income was less than half of the average annual growth rate. To put it another way, personal income in California grew by somewhere between 2.5 percent and 7.1 percent (that is, 4.8 percent plus‑or‑minus the AD of 2.3 percentage points) in 15 of those 24 years. This represents a fairly reliable—not terribly volatile—level of personal income growth from year to year. Personal income consists largely of wages and salaries, as discussed earlier, and the AD of wages and salaries included in BEA personal income was 2.8 over the period. Other components of BEA personal income are somewhat more volatile, with both the dividends, interest, and rent category and the proprietor and partnership income category having ADs of over 4.0 during this period.
BEA Personal Income Elements Not in PIT Tax Base. Figure 6 also shows that the AD for elements of the PIT base counted in BEA personal income is 4.0—almost twice the 2.3 AD of BEA personal income. There are two main reasons for the difference:
- Not Taxing Some Stable Categories of Personal Income. California’s PIT generally does not tax two fairly stable parts of BEA personal income: transfer payments and employer‑paid benefits.
- Not Taxing Relatively Stable Subcategories of Personal Income. In addition, California’s PIT does not tax certain parts of three other categories of BEA personal income: wages and salaries; proprietor and partnership income; and dividends, interest, and rent. In each case, the volatility of the overall category of BEA personal income is less than the volatility of the part of that category taxed by California. In other words, California does not tax some relatively stable subcategories in these three major buckets of BEA personal income.
PIT Tax Base Elements Not in Personal Income. Figure 3 also shows two income categories taxed by California but excluded from BEA’s personal income measure: capital gains and distributions from pension and individual retirement accounts. While these income categories are relatively small compared to wages and salaries, capital gains are by far the most volatile part of the California PIT tax base. Over the 1990 to 2014 period, capital gains’ AD was 35.3. This makes capital gains over ten times as volatile as the part of salaries and wages in the PIT tax base. Distributions from retirement accounts were much less volatile, with an AD of 3.7. Combined, capital gains and these retirement distributions had an AD of 18.5 over the 1990 to 2014 period.
PIT Tax Base Almost Three Times More Volatile Than Personal Income. As noted above, the parts of the California PIT tax base that are in BEA’s personal income measure had a collective AD of 4.0 over the 1990 to 2014 period. The two components of the PIT tax base excluded from each year’s BEA personal income measure—capital gains and certain retirement distributions—have a combined AD of 18.5, but these two elements are relatively small parts of the PIT tax base. Overall, the entire California PIT tax base—the income taxed each year by the state from 1990 to 2014—had an AD of 6.3, or almost three times as volatile as BEA’s measure of personal income. This is a relatively volatile tax base, with both fairly stable elements (wages and salaries, with an AD of 3.4) and smaller, but very volatile, elements (capital gains, with an AD of 35.3).
Changing AD Over Time. The personal income of Californians, as measured by BEA, has become slightly more volatile over time, as shown by comparing the AD during the 1990‑2002 period with that from the 2002‑2014 period. Overall BEA personal income for California had an AD of 2.0 from 1990 to 2002, which increased somewhat to 2.5 over the 2002 to 2014 period. Among those PIT tax base items outside of BEA personal income, capital gains became more volatile over the period, with its AD of 29.0 over the 1990‑2002 time frame jumping to 41.6 in the 2002‑2014 period. In contrast, taxable retirement income became less volatile over time.
Taking all PIT tax base elements together, the AD of the California PIT tax base fell somewhat from 6.5 during the 1990‑2002 period to 5.9 during the 2002‑2014 period. While capital gains became much more volatile, other elements—especially wages and salaries—became less volatile, more than making up for the increased volatility of stock and other asset gains. (As noted earlier, however, this is not the whole story about the volatility of California’s PIT, as these changes in the AD of the tax base over time do not account for changes in PIT policy, such as the approval of higher tax rates on the highest‑income earners under Proposition 30 [2012] and Proposition 55 [2016].)
Back to the TopLAO Comments
Tax Choices Contribute to Volatility. California’s progressive tax rate structure and other tax policy choices contribute to the volatility of its PIT revenues, but a significant element of this tax’s volatility results from the volatility of the PIT tax base itself. This brief has focused on that tax base volatility. While state personal income, as measured by BEA, is not very volatile, California has made choices about what to include in its tax base and what to exclude. These choices make the PIT tax base more volatile than state personal income. In particular, including capital gains in the taxable PIT base adds significantly to the PIT base’s volatility.
State’s Management of Volatility. Over much of the last two decades, the state has debated how to manage its budgetary volatility. In 2014, the Legislature proposed and voters passed Proposition 2, a measure that sets aside revenues during good budget years in order to help stabilize the budget during bad budget years. Specifically, Proposition 2 captures a base amount of state revenues plus a portion of capital gains‑related PIT revenues during good budget years. Proposition 2 requires these revenues to be used to build budget reserves and make one‑time debt payments. This helps keep spending at more sustainable levels, as well as building reserves that can be used during bad budget times. While Proposition 2 did not change the state’s PIT tax base (or the volatility figures cited in this brief), this constitutional provision aims to reduce the volatility of state revenues available for spending by “taking money off the table” in good budget years when capital gains typically are elevated and by “putting more money on the table” in bad budget years by allowing for use of accumulated reserves in periods when capital gains often are depressed.
There’s More to the Volatility Story. The state’s chosen PIT tax base is relatively volatile. But this is not the whole story. The decisions the state makes about how to tax that base also affect tax revenue volatility. For example, the decision to tax high‑income Californians—who receive a disproportionate share of total capital gains and proprietor and partnership income—at higher marginal tax rates also affects the volatility of the state’s revenues. We anticipate discussing the volatility resulting from some of these other choices—choices the state has made about how to tax its PIT tax base—in future analyses.