In early March of 2017, the California Department of Education certified initial average daily attendance data for 2016-17. In this post, we describe how the state tracks attendance and discuss the implications for Proposition 98 and school funding.
LAO Contact

March 30, 2017
The 2017-18 Budget
Update on K-12 Student Attendance
In early March, we received the first report of 2016-17 attendance data from the California Department of Education (CDE). The data show that statewide attendance is closely tracking the latest estimates from the administration and our office. Below, we provide background on the calculation of school attendance, describe the recent update, and discuss implications for the Proposition 98 minimum guarantee and school funding.
Background
School Districts Report Attendance Data Three Times Per Year. California requires school districts to track the average daily attendance (ADA) of their students. If a district’s school year is 180 days, and an average of 1,000 students attend each day, its ADA is 1,000. School districts report their ADA to the state three times per year. The first time (known as “P-1”) covers attendance data from the beginning of the school year through December. The department certifies this data in February. The second time (known as “P-2”) runs from the beginning of the school year through April 15 and is certified in June. The third time (known as “Annual”) covers the entire school year and is certified in February of the following school year.
Attendance Affects Funding for Certain Programs. The department uses attendance data to allocate state funding for various programs, including the Local Control Funding Formula (LCFF) and state special education categorical program. For most programs, the state finalizes funding based on the P-2 attendance data. For a few programs—generally those operated by county offices of education—the state waits to finalize funding until it receives Annual data. The role of the P-1 report is to provide an interim estimate of attendance until better data become available.
Attendance Also Affects Proposition 98 Minimum Guarantee. The state also uses attendance data in the calculation of the Proposition 98 minimum guarantee. In most years (22 of the past 28), the minimum guarantee equals the amount of state and local funding schools received the previous year, adjusted for changes in statewide ADA and growth in state revenue (Test 3) or the state economy (Test 2). In Test 3 years, changes in ADA also affect the size of the supplemental appropriation the state is required to make to ensure school funding grows in tandem with the rest of the budget. In the other six years, Test 1 was operative or the minimum guarantee was suspended. In these cases, attendance does not affect school funding. Proposition 98 specifies that the minimum guarantee is not adjusted downward for declines in ADA unless attendance declined the two previous years. This “hold harmless” provision insulates school funding from short-term declines in attendance.
Recent Data
Attendance Is Closely Tracking Estimates. The department recently certified P-1 attendance data for 2016-17. Based on this data, we now estimate statewide attendance in 2016-17 at 5,961,453. Previous estimates of K-12 attendance by the administration and our office were very close to this new estimate. Specifically, the administration in January had estimated attendance at 5,958,933, and our office in November had estimated attendance at 5,956,814. Though the new data still reflect a 0.17 percent decline over the 2015-16 attendance level (5,971,789), the decline appears slightly less steep than previously estimated.
Updated Attendance Data Leads to Small Increases in Estimated Program Costs and Proposition 98 Minimum Guarantee. Compared with the Governor’s January estimate, the updated attendance data results in 2016-17 LCFF costs increasing by about $20 million and the minimum guarantee increasing by about $13 million, all else constant. Though one would expect the guarantee to grow by a larger dollar amount than LCFF costs (which account for about 80 percent of spending inside the guarantee), changes in the Test 3 supplemental appropriation dampen some growth in the guarantee (to ensure school funding does not grow more quickly than the rest of the budget). The state typically addresses any changes in LCFF costs and the minimum guarantee as part of the May Revision or budget closeout, as which times the Legislature revisits various other Proposition 98 inputs and proposals.
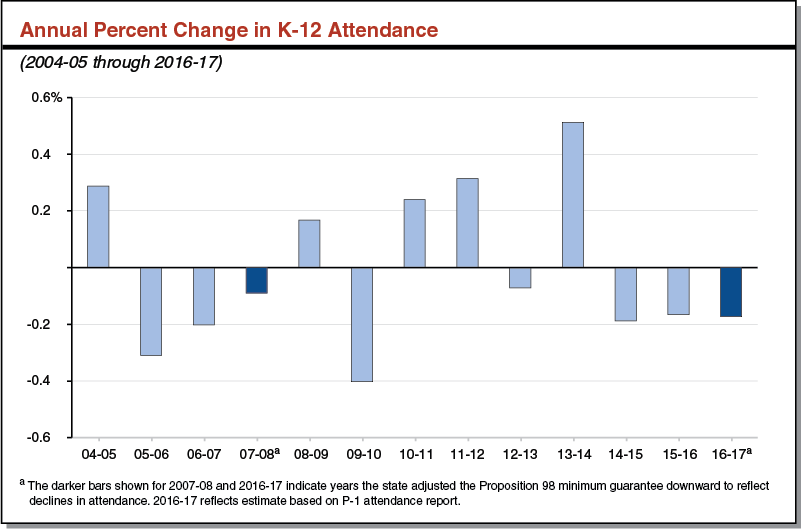
2016-17 Marks Third Consecutive Year of Attendance Decline. The figure below shows the annual percent change in statewide attendance since 2004-05. Over the period, statewide attendance has hovered around zero, with increases in five of the years shown and declines in the other eight years. Due to the two-year hold-harmless provision for the minimum guarantee, the state has not adjusted the guarantee downward for most of these declines. For example, although attendance declined over a three-year period from 2005-06 through 2007-08, the state adjusted the guarantee downward only for the decline in the final year of the period. Similarly, although attendance declined in 2014-15 and 2015-16, the state made no downward adjustments in those years, but it is adjusting the guarantee downward in 2016-17, as this marks the third consecutive year of declines. Both the administration and our office believe attendance is likely to continue declining for several more years. Such declines would lower the minimum guarantee as well as program costs, all else constant.