LAO Contact

May 7, 2018
The 2018-19 Budget
A Guide to Understanding Potential Changes in the Proposition 98 Guarantee
State budget deliberations about school and community college funding tend to revolve around estimates of the Proposition 98 minimum guarantee. In this post, we provide an update on the key factors affecting estimates of the guarantee for 2017‑18 and 2018‑19. Based upon this latest information, we then describe how the guarantee could change relative to estimates in the Governor’s January budget. The post is intended as a planning guide to help the Legislature understand the relationship between changing inputs and the minimum guarantee over the coming year. It does not attempt to predict the specific estimates of the minimum guarantee the Governor will include in the May Revision (due by May 14) or that our office will publish next week.
Background
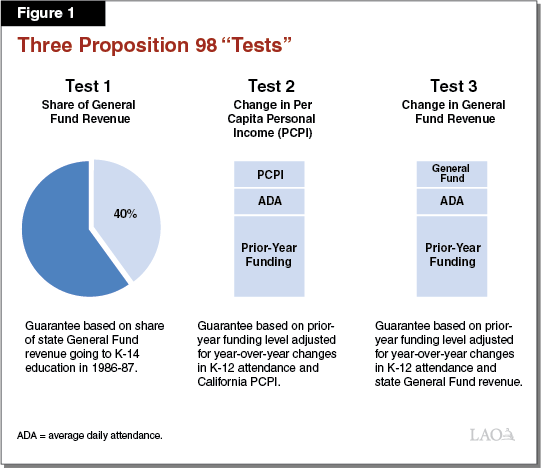
Minimum Guarantee Determined by Key Inputs. To determine the minimum guarantee, the State Constitution requires the state to run three formula-driven “tests” (see Figure 1). Test 1 equals a fixed percentage of state General Fund revenue. Test 2 and Test 3 equal the amount of funding provided for K-14 education in the previous year, adjusted for changes in per capita personal income (Test 2) or per capita General Fund revenue (Test 3). Both Test 2 and Test 3 also are adjusted for changes in student attendance. The Constitution contains various rules for determining which test sets the minimum guarantee each year. Test 1 sets the guarantee only in the relatively rare cases where the other two tests would provide K-14 education with less than about 40 percent of General Fund revenue. Otherwise, the state compares Test 2 and Test 3 and sets the guarantee at the lower of the two amounts. The state funds the minimum guarantee through a combination of General Fund and local property tax revenue. Though the state can provide more funding than required, in practice it usually funds at the guarantee. With a two-thirds vote of each house of the Legislature, the state can suspend the guarantee and provide less funding than otherwise required for that year.
“Maintenance Factor” Payments Required in Certain Years. In addition to the three main tests, the Constitution requires the state to track a requirement known as maintenance factor. The state creates maintenance factor when Test 3 is operative or when it suspends the guarantee. The amount created equals the difference between the actual level of funding provided and the Test 1 or Test 2 level (whichever is higher). Moving forward, the state tracks and adjusts maintenance factor each year for changes in student attendance and per capita personal income. In subsequent years, when General Fund revenue is growing relatively quickly, the Constitution requires the state to make maintenance factor payments. The exact amount the state provides is determined by formula, with stronger revenue growth generally resulting in greater maintenance factor payments.
State Updates Its Estimates of the Guarantee When Inputs Change. State budget deliberations around K-14 funding begin in January when the Governor’s budget makes an initial estimate of the minimum guarantee for the upcoming fiscal year. By May 14, the administration releases new estimates of the minimum guarantee as part of the May Revision. Changes to the minimum guarantee also can occur after the state adopts the budget. With the exception of per capita personal income (which the state finalizes in May), the key inputs are not finalized until the fiscal year is over.
Guarantee Can Move in Unexpected Ways. Midyear and postyear revisions sometimes result in a different test becoming operative and the minimum guarantee changing significantly. In some cases, these revisions have counterintuitive effects on the guarantee. For example, when General Fund revenue increases and per capita personal income decreases, the minimum guarantee tends to drop because the guarantee is determined by the lower of these two growth factors. Another common counterintuitive effect occurs when the state increases its revenue estimate for the current year more than for the budget year. Though overall state revenue is higher in this situation, year-to-year growth in General Fund revenue is revised downward, with the guarantee sometimes dropping as a result.
Recap of Governor’s Budget Assumptions
Governor’s Budget Funded at the Minimum Guarantee in 2017‑18 and 2018‑19. Figure 2 shows the factors underlying the administration’s January estimates of the minimum guarantee each year of the budget period. The administration projected that Test 2 would apply in 2017‑18, with the guarantee adjusted for a 3.69 percent increase in per capita personal income and a 0.02 percent increase in student attendance. The administration also projected that revenue growth would be sufficiently strong to require a $1.2 billion maintenance factor payment. After making this payment, the maintenance factor remaining at the end of 2017‑18 would be $228 million. For 2018‑19, the administration projected that Test 3 would apply, with the guarantee adjusted for a 4.14 percent increase in per capita General Fund revenue. Although the administration projected that student attendance would decline in 2018‑19, the Constitution contains a two-year “hold harmless” provision specifying that the guarantee is not adjusted downward for declines in attendance unless attendance also declined during the two previous years. Given the administration assumed attendance growth in 2017‑18, it applied the hold harmless provision in 2018‑19.
Figure 2
Proposition 98 Key Inputs and Outcomes Under Governor’s Budget
(Dollars in Millions)
|
2016‑17 |
2017‑18 |
2018‑19 |
|
|
Inputs |
|||
|
General Fund tax revenuea |
$121,047 |
$128,769 |
$134,605 |
|
Change in K‑12 attendance |
‑0.20% |
0.02% |
‑0.29%b |
|
Change in per capita personal income (Test 2) |
5.37 |
3.69 |
4.25 |
|
Change in per capita General Fund (Test 3)c |
2.73 |
6.01 |
4.14 |
|
Operative Test |
3 |
2 |
3 |
|
Outcomes |
|||
|
Minimum guarantee |
|||
|
General Fund |
$49,993 |
$52,741 |
$54,564 |
|
Local property tax |
21,397 |
22,470 |
23,761 |
|
Totals |
$71,390 |
$75,211 |
$78,324 |
|
Maintenance factor |
|||
|
Amount created (+) or paid (‑) |
$1,279 |
‑$1,172 |
$83 |
|
Total outstandingd |
1,350 |
228 |
320 |
|
aReflects General Fund revenue counting toward the calculation of the minimum guarantee. bDue to the two‑year hold harmless provision in the State Constitution, the administration calculated the 2018‑19 guarantee as though attendance would remain flat in 2018‑19. cAs set forth in the State Constitution, reflects change in per capita General Fund plus 0.5 percent. dOutstanding maintenance factor is adjusted annually for changes in K‑12 attendance and per capita personal income. |
|||
Update on Key Factors
General Fund Revenue in 2017‑18 Exceeding Governor’s Estimates, Likely Higher in 2018‑19 Too. For fiscal year 2017‑18 through April 2018, personal income and corporation tax revenue is running almost $3.6 billion above the Governor’s January budget assumptions. This increase in part is due to higher revenue from capital gains. Additionally, personal income tax payments indicate that wage and/or job growth has been strong through the first part of 2018. In a few days, we will have additional tax data to help discern what share of higher revenue growth in 2017‑18 is likely to be ongoing versus one time.
Per Capita Personal Income Rate for 2018‑19 Down From January Estimate. State law bases the calculation of per capita personal income on economic data provided by the federal government. The personal income data used to calculate the minimum guarantee is lagged one year. (For various reasons, the personal income growth rate often does not move in tandem with the state revenue growth rate, which is not lagged for purposes of calculating the guarantee.) Whereas the administration had estimated the per capita personal income growth rate used to calculate the minimum guarantee in 2018‑19 would be 4.25 percent, updated data from the federal government show that it will be about 3.7 percent.
Attendance Likely to Decline in 2017‑18 and 2018‑19. In March 2018, the California Department of Education released preliminary data on student attendance for 2017‑18. The data suggest attendance is likely to decline by 0.03 percent, compared with the 0.02 percent increase projected in the Governor’s January budget. Since this change equates to only a few thousand students, the effect on the 2017‑18 guarantee would be minor. The effect on the 2018‑19 guarantee, however, would be more significant (a several hundred million dollar drop)—both because attendance is projected to decline more that year (0.29 percent) and the hold harmless provision would no longer insulate the guarantee from that decline.
Cost-of-Living Adjustment (COLA) for 2018‑19 Up Slightly From January Estimate. The state budget typically provides an annual COLA for certain school and community college programs. State law links this COLA to a national price index developed by the Bureau of Economic Analysis (a division of the U.S. Department of Commerce). Though the COLA is not one of the inputs in the calculation of the minimum guarantee, it does affect the amount of funding available for the state’s Proposition 98 priorities. On April 27, the state received updated data showing that the COLA will be 2.71 percent in 2018‑19. This compares with the 2.51 percent COLA assumed in the January budget. We estimate that the slightly higher COLA increases the cost of Proposition 98 programs by $122 million.
Assessing Effects on the Minimum Guarantee
All Else Constant, Changes in Attendance and Per Capita Personal Income Likely to Reduce 2017‑18 and 2018‑19 Guarantees. Setting aside the effect of any change in state revenue, the slight reduction in student attendance we anticipate in 2017‑18 would reduce the 2017‑18 minimum guarantee by $22 million. For 2018‑19, the guarantee also would be affected by the lower student attendance estimates and the loss of the attendance hold harmless provision. Additionally, the 2018‑19 guarantee would be affected by the downward revision in the per capita personal income growth rate (from 4.25 percent to about 3.7 percent). If the state were to update the 2018‑19 guarantee just for these changes (without changing its revenue assumptions), the 2018‑19 guarantee would decrease by a total of $603 million. Though the 2018‑19 guarantee drops due to updating these inputs, covering the updated COLA raises Proposition 98 costs by $122 million, necessitating further spending adjustments inside the guarantee, all else constant.
All Else Constant, Growth in General Fund Revenue Likely to Increase 2017‑18 Guarantee but Could Reduce 2018‑19 Guarantee. Assuming state revenue increases by at least $400 million in 2017‑18, the state would be required to pay off all remaining maintenance factor ($228 million). Given the positive revenue results for 2017‑18 through April, a revenue increase of at least this magnitude seems very likely. The resulting higher Proposition 98 base would carry forward almost dollar for dollar. The 2018‑19 guarantee, however, still could drop relative to January estimates, as discussed below.
Bottom Line: Under Most Conceivable Revenue Scenarios, Minimum Guarantee Declines Across the Period. Figure 3 shows how the minimum guarantee would change relative to the Governor’s budget under three potential revenue scenarios. The estimates in the figure incorporate the final estimate of per capita personal income and the latest estimates of student attendance. Scenario 1 assumes revenue grows more quickly in 2017‑18 than 2018‑19. Under this scenario, year-over-year growth in per capita General Fund is 2.57 percent—somewhat lower than the 4.14 percent estimate in the in the Governor’s budget. The guarantee under this scenario declines nearly $1 billion across the two years compared with January estimates. Scenario 2 assumes revenue increases by similar amounts in 2017‑18 and 2018‑19. Under this scenario, the year-to-year growth rate does not change from the January estimates, with the effect that the guarantee drops less than $200 million across the two-year period (due to changes in attendance and per capita personal income). Even were revenue to grow much faster in 2018‑19 than 2017‑18 (Scenario 3), the guarantee still would drop the same amount as under Scenario 2. This is because Test 2 (driven by per capita personal income) is operative under both scenarios. The only revision that could produce a less negative overall change than Scenario 3 likely would be an unexpected increase in final student attendance for 2017‑18 or 2018‑19.
Figure 3
A Planning Tool: How Changes in State Revenue Would Affect Minimum Guaranteea
(In Millions)
|
Scenario |
Change in General Fund Revenue |
Change in Guaranteeb |
|||||
|
2017‑18 |
2018‑19 |
Total |
2017‑18 |
2018‑19 |
Total |
||
|
1 |
$4,000 |
$2,000 |
$6,000 |
$205 |
‑$1,195 |
‑$989 |
|
|
2 |
4,000 |
4,000 |
8,000 |
205 |
‑367 |
‑162 |
|
|
3 |
4,000 |
6,000 |
10,000 |
205 |
‑367 |
‑162 |
|
|
aAll changes are relative to the Governor’s January budget. bIncorporates the effects of updated estimates of per capita personal income and student attendance. |
|||||||
Planning for May and Budget Closeout
New Estimates of the Guarantee Will Be Released as Part of Governor’s May Revision. The Governor’s May Revision—due to the Legislature by May 14—will contain an updated estimate of each input affecting the minimum guarantee, including General Fund revenue, per capita personal income, and student attendance. In addition, we will publish our independent estimates of the minimum guarantee sometime next week. Though the per capita personal income growth rate is final at this point, the state will not finalize 2017‑18 revenue estimates until June 2019 and will not finalize 2018‑19 revenue estimates until June 2020. Student attendance estimates for 2017‑18 also will not be finalized until March 2019, with 2018‑19 attendance not finalized until March 2020. As the state continues to update these revenue and attendance estimates, the minimum guarantee in 2017‑18 and 2018‑19 will continue to change according to the dynamics described in this post.
Legislature Sets Final Proposition 98 Level. We do not intend in this post to predict how much funding schools and community colleges ultimately will receive in 2017‑18 and 2018‑19, as the Legislature has yet to make its final decisions for those years. Last year, the Governor proposed and the Legislature approved funding several hundred million dollars above revised estimates of the guarantee for 2015‑16 and 2016‑17. As in any year, the Legislature could decide in 2017‑18 and 2018‑19 to fund at the minimum guarantee or at some other level.
Higher State Revenue Gives Legislature Opportunity to Revisit Spending Priorities. In January, the Governor’s budget focused on building state reserves and increasing funding for schools and community colleges. As the Legislature enters its final budget deliberations, it will have more discretion in setting its spending priorities. That is, in contrast to previous years, the Legislature’s key budget closeout decisions are unlikely to be driven by constitutional requirements. Instead, the likely state budget picture is one in which the Legislature has significant new revenue available to allocate for any of its priorities.