LAO Contacts

May 17, 2018
The 2018-19 May Revision
LAO Multiyear State Budget Outlook
This post presents our office’s independent assessment of the condition of the state General Fund budget through 2021‑22 under the Governor’s May Revision proposals. As is our practice at the May Revision, our assessment is based on: (1) one economic scenario, a continued growth scenario (rather than other possible ones); (2) implementation of the Governor’s policy proposals; and (3) our estimates of the future costs of state programs.
Near-Term Budget Outlook
Under Our Estimates, 2018‑19 Ends With $3.5 Billion More in Discretionary Reserves. Figure 1 compares our office’s bottom line estimates of the budget’s condition to the administration’s estimates. Relative to the administration, we estimate 2018‑19 would end with $3.5 billion more in the Special Fund for Economic Uncertainties (SFEU). Simply put, the SFEU is the difference between state spending and state revenues for a given fiscal year. (Unlike the rainy day fund, which can only be used in a budget emergency, the SFEU is available at any time for any public purpose.) Three key factors explain the $3.5 billion difference:
- Revenues Higher by $2.6 Billion. In total, our General Fund revenue and transfer estimates are higher than the administration’s by $2.6 billion over the three-year period. Largely, this stems from our office’s higher estimates of personal income tax (PIT) revenue in 2017‑18 and 2018‑19. This primarily reflects our office’s higher projections of capital gains in 2017 and 2018 and higher wages and salaries in 2019.
- Proposition 98 Requirements Lower by $1.4 Billion. Proposition 98 establishes an annual funding requirement for schools and community colleges known as the minimum guarantee. Across the three fiscal years, our estimates of General Fund spending required to meet the minimum guarantee are lower by $1.4 billion. There are two key reasons for this difference. First, our outlook incorporates preliminary data suggesting student attendance likely will decline in 2017‑18 and 2018‑19, whereas the administration assumes attendance remains relatively flat. Second, our office’s estimates of local property tax revenues are higher than the administration’s estimates, which reduce required General Fund spending.
- Proposition 2 Spending Requirements Higher by Nearly $400 Million. Proposition 2 (2014) requires the state to spend minimum amounts to pay down certain eligible debts. These requirements largely are based on revenues, particularly those from capital gains. As a result of our office’s higher capital gains estimates, we also estimate that Proposition 2 debt payment requirements are higher by $390 million in 2018‑19. This reduces the amount of funding available for other purposes in the SFEU.
Figure 1
LAO and Administration Near‑Term
General Fund Budget Outlooks
(In Millions)
|
LAO |
DOF |
||||
|
2017‑18 |
2018‑19 |
2017‑18 |
2018‑19 |
||
|
Prior‑year balance |
$5,400 |
$8,365 |
$5,672 |
$8,451 |
|
|
Revenues and transfers |
129,816 |
136,603 |
129,825 |
133,513 |
|
|
Expenditures |
126,851 |
137,064 |
127,046 |
137,562 |
|
|
Ending Fund Balance |
$8,365 |
$ 7,905 |
$ 8,451 |
$ 4,402 |
|
|
Encumbrances |
$1,165 |
$1,165 |
$1,165 |
$ 1,165 |
|
|
SFEU balance |
7,200 |
6,740 |
7,286 |
3,237 |
|
|
DOF = Department of Finance and SFEU = Special Fund for Economic Uncertainties. |
|||||
LAO Estimates Assume No Reduction in Sales Tax Rates. California has two statutes that trigger reductions in the state’s sales tax rate if balances in the SFEU reach a certain threshold. Under either statute, the state’s sales tax rate automatically would decline by one-quarter cent for one calendar year, equal to around $1.7 billion, reducing the SFEU by the same amount. Our bottom line General Fund estimates assume these provisions are not triggered in 2018‑19. However, under our estimates of revenues and reserve balances, the state could trigger one or both of these statutory provisions. Neither provision is triggered under the administration’s current estimates.
2018‑19 Ends With Nearly $21 Billion in Total Reserves. Figure 2 compares our office’s estimates of total reserves in 2018‑19 to the administration’s estimates. In addition to the SFEU, the state holds budget reserves in the Budget Stabilization Account (BSA). Deposits into the BSA are dictated by a set of constitutional formulas in Proposition 2. In 2018‑19, the Governor proposes depositing enough reserves into the account so that the BSA reaches its maximum level, which is 10 percent of General Fund taxes. Consistent with this proposal, we assume the state fills the reserve to its maximum in 2018‑19. Under our estimates, this brings the fund’s balance to $13.9 billion in 2018‑19, slightly higher than the administration’s estimate. (Under our revenue estimates, 2017‑18 ends with a higher BSA balance compared to the administration, which lowers our estimated optional deposit in 2018‑19.)
Figure 2
Comparing LAO and DOF Total Reserves in 2018‑19
(In Billions)
|
LAO |
DOF |
|
|
2017‑18 BSA balance |
$11.1 |
$9.4 |
|
Required BSA deposit (2018‑19) |
2.1 |
1.7 |
|
Optional BSA deposit (2018‑19) |
0.7 |
2.6 |
|
BSA Balance |
$13.9 |
$13.8 |
|
SFEU balance |
$6.7 |
$3.2 |
|
Total reserves |
20.7 |
17.0 |
|
DOF = Department of Finance; BSA = Budget Stabilization Account; and SFEU = Special Fund for Economic Uncertainties. |
||
Longer-Term Budget Outlook
To evaluate the effect of the administration’s policy proposals on the state’s fiscal condition over several years, both our office and the administration produce a multiyear budget outlook. Both of these outlooks assume the economy continues to grow. (Our economic scenarios do contain some key differences, however. For example, our economic scenario assumes notably higher wage and salary growth in 2018 and 2019.) In this section, we present our longer-term budget outlook and compare our estimates with the administration’s forecast.
LAO Longer-Term Outlook
Assuming Economic Growth, Surpluses Through 2021‑22 in LAO Outlook. Figure 3 displays our office’s outlook for the General Fund. The top part of each bar shows our projection of the annual BSA deposit. The bottom part of each bar shows the annual operating surplus (the amount by which projected revenues exceed expenditures). These operating surpluses are positive, which indicates that—assuming the economy continues to grow—the state’s budget has the capacity to pay for the Governor’s May Revision proposals and still have a few billion dollars annually to build additional reserves or make additional commitments.
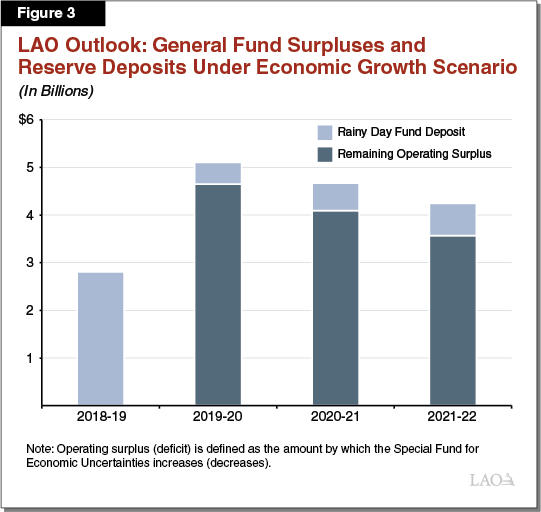
BSA Reaches Maximum in 2018‑19, Infrastructure Spending Begins in 2019‑20. As discussed earlier, we assume the state deposits enough funds into the BSA in 2018‑19 so that it reaches its maximum level. Once the BSA reaches this maximum, funds that would bring the BSA above 10 percent of General Fund taxes must be spent on infrastructure. Each year that General Fund tax revenues grow, the maximum level of the BSA also grows. Our outlook accounts for this growth by assuming deposits of several hundred million dollars into the BSA beginning in 2019‑20. In that year, the state also would be required to begin spending money on infrastructure. Similar to the administration, we estimate these spending requirements would be roughly $1 billion beginning in 2019‑20.
Proposition 98 Minimum Guarantee Grows Throughout the Period. Figure 4 shows our estimates of the minimum guarantee and compares them to the administration’s estimates. Under our outlook, the minimum guarantee grows on average by $3.2 billion (3.9 percent) per year over the period. By comparison, the administration has the guarantee growing on average $2.3 billion (2.9 percent) per year. The primary factor explaining this difference is our assumption of faster growth in General Fund revenue, particularly in 2020‑21 and 2021‑22. Partially offsetting our higher revenue assumption is our lower student attendance projection. Both of our outlooks reflect steady growth in local property tax revenue, with our growth rate somewhat higher than the administration estimates. Under each of our outlooks, higher local property tax revenue covers about half of the increase in the minimum guarantee over the period. Proposition 98 General Fund spending, in turn, grows somewhat more slowly than the guarantee itself.
Figure 4
Comparing Growth in Minimum Guarantee
Under LAO and Administration Estimates
(Dollars in Billions)
|
2017‑18 |
2018‑19 |
2019‑20 |
2020‑21 |
2021‑22 |
Average Annual Increase |
||
|
Amount |
Percent |
||||||
|
Guarantee Under LAO Outlook |
$75.6 |
$78.0 |
$80.2 |
$84.1 |
$88.2 |
$3.2 |
3.9% |
|
General Fund |
53.2 |
54.1 |
54.9 |
57.2 |
59.8 |
1.6 |
3.0 |
|
Local property tax |
22.4 |
23.9 |
25.3 |
26.9 |
28.4 |
1.5 |
6.2 |
|
Guarantee Under May Revision |
75.6 |
78.4 |
81.2 |
82.7 |
84.9 |
2.3 |
2.9 |
|
General Fund |
53.4 |
55.0 |
56.4 |
56.7 |
57.5 |
1.0 |
1.9 |
|
Local property tax |
22.2 |
23.4 |
24.8 |
26.0 |
27.4 |
1.3 |
5.3 |
Comparing LAO and DOF Longer-Term Budget Outlooks
Figure 5 compares our estimates of operating surpluses with the administration’s estimates. In this figure, operating surplus or deficit is defined as the amount by which the SFEU increases or decreases. While the administration displays operating deficits in the last two years of the outlook period, it still has positive SFEU balances in those years, meaning the state would have sufficient resources available to cover its costs.
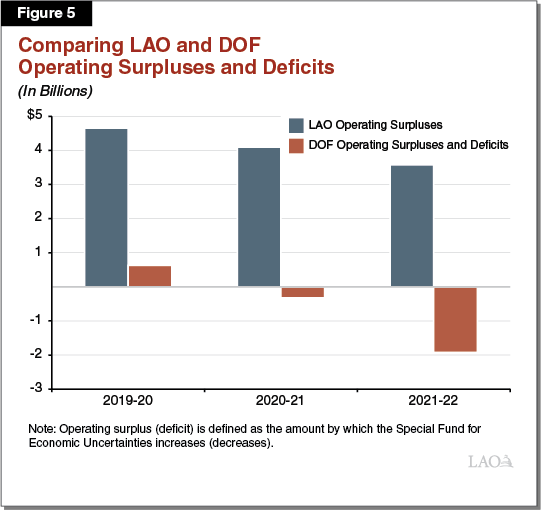
Differences in Outlook Assumptions. Four significant factors drive the bottom line differences between our outlook and the administration’s multiyear projections (some of which move in opposite directions). In particular, across the three outlook years (2019‑20 through 2021‑22), compared to the administration, our office estimates that:
- Revenues Are Higher. Our bottom line revenues grow (on average) $3 billion more per year than the administration. The difference largely is due to our office’s higher projections of PIT revenues across the period. This stems mainly from higher estimates of taxable wages and salaries. Consistent with our projections of low unemployment, we expect more wage growth than the Department of Finance (DOF) for every year starting from 2017, with especially higher growth rates in 2019 and 2020.
- General Fund Proposition 98 Spending Is Higher. Our estimates of General Fund spending for schools and community colleges grow roughly $1 billion more per year compared to the administration. As discussed above, this difference is largely driven by our office’s higher projections of General Fund revenue growth.
- Health and Human Services (HHS) Spending Is Considerably Lower. Our estimate of spending among programs in the HHS agency is roughly $3 billion lower per year. These differences are particularly significant in 2019‑20, where the administration assumes growth in HHS programs will be over $4 billion year over year, but our office estimates this growth will be only $1.4 billion. Some of the sources of these differences are related to our differing assumptions about underlying programmatic growth and the fiscal impact of various policy-related changes in the Medi-Cal program. We do not have programmatic detail from the administration, however, and therefore cannot identify the sources of these differences with certainty.
- Employee Compensation Is Higher. Our estimates of state employee compensation costs are hundreds of millions of dollars higher than the administration each year, growing to more than $1 billion higher by 2021‑22. These differences are driven by our offices’ assumptions about what will happen after current bargaining agreements expire. While we do not predict any single estimate of increases in employee compensation, our outlook reflects the assumption that employee compensation costs—including costs for salaries and health benefits—will grow after labor agreements expire. In its multiyear analysis, DOF does not assume any increased costs beyond those that are required by existing labor agreements. Because some major bargaining agreements expire early in the outlook period, these different assumptions have a significant effect on our bottom-line numbers.
LAO Comments
Uncertainties in the Longer-Term Outlook. The budget outlook for both the budget year and outyears face uncertainties. These include:
- Economic Conditions. In this post, we have described our office’s budgetary outlook under one set of economic assumptions—continuing economic growth. The budget’s bottom line condition would be worse if the economy stalls or contracts. On the other hand, better conditions in the economy and asset markets also are possible. For example, our office assumes growth in the stock market declines in 2019, but higher stock market growth would increase revenues (offset partially by higher formula-driven spending requirements).
- HHS Spending. As noted earlier, the administration assumes significant growth in HHS spending across the multiyear period. Our estimates of this growth are much lower. While we think our estimates are reasonable—and are based on available information about what future costs are likely to be—there still is significant uncertainty. In recent years the state has experienced a few large, unexpected cost increases in HHS spending, most notably in the Medi-Cal program. These may contribute to increasing uncertainty about the spending trajectory in the future.
- Bond Debt Service. There are a significant number of bonds that have qualified or may qualify for approval by voters on the June and November ballots. Most notably, there are two bonds for natural resources and one for housing that have already qualified. Our outlook does not include any debt service costs related to these measures. If all of the proposed bonds qualified and were approved by voters, we expect that annual debt service costs would increase by over $100 million in 2019‑20 and growing to several hundred million dollars in 2021‑22.
Budget Is Prepared for a Mild Recession. As we described in a recent report (Building Reserves to Prepare for a Recession), the Legislature has two main tools to prepare for a recession. They are: (1) budget reserves and (2) one-time spending. If these tools are sufficient to cover a shortfall that emerges during a recession, the Legislature would not have to take any additional actions—primarily spending cuts or revenues increases—to bring the budget into balance. Under our estimates, the budget ends 2018‑19 with over $20 billion in reserves, a sufficient amount to cover the estimated budget problem associated with a mild recession. Additional savings would be required to cover a moderate recession—which would involve a budget problem of roughly $40 billion over a multiyear period—with reserves alone.
Significant Proposed One-Time Spending Adds to Budget’s Preparedness. In addition to reserves, one-time spending also is an important tool to prepare for a recession. One-time spending does not increase ongoing expenditures, thereby reducing the size of a subsequent budget problem. The Governor proposes significant one-time spending in the May Revision (see: Overview of the Governor’s Budget and Initial Comments on the Governor’s May Revision). Together, these one-time spending proposals keep spending growth very low overall in our expenditure projections. As such, these proposals also help prepare the budget to withstand a future recession.