LAO Contacts
- Transportation Governance
- Driving
- Funding
- Mass Transportation
- Active Transportation
- Freight Movement

June 7, 2018
California's Transportation System
- Introduction
- Transportation Governance
- Driving
- Mass Transportation
- Active Transportation
- Freight Movement
- Funding
- Appendix
Introduction
The state’s transportation system helps to move people and goods around and through the state. The aim of this primer is to provide policymakers and the public with key information about this system. The primer begins with a chapter describing transportation governance. The subsequent five chapters consist of visual charts that provide information about the following:
- Driving. Provides information on drivers, vehicles, state highways, and local streets and roads.
- Mass Transportation. Describes modes of transportation that move large numbers of people at once, such as transit and commercial aviation.
- Active Transportation. Provides information on bicycling and walking trips.
- Freight Movement. Discusses the movement of goods through air travel, rail, seaports, and highways and roads.
- Funding. Describes the revenue sources supporting California’s transportation programs and infrastructure.
The appendix of this report contains a list of the data sources used in each of the figures.
Chapter 1
Transportation Governance
Transportation governance involves a variety of federal, state, regional, and local agencies. The federal government mainly provides funding and oversees certain safety requirements. The state, regional, and local governments help fund, plan, construct, operate, and maintain different transportation infrastructure, such as highways, streets and roads, transit systems, and intercity rail. Below, we describe the roles of each level of government.
Federal. The U.S. Congress appropriates federal funding for transportation and establishes national transportation policy objectives. The main federal agency tasked with carrying out Congress’ directives is the U.S. Department of Transportation. The department consists of nine administrations that each specialize in a particular mode or aspect of transportation. For example, the Federal Highway Administration provides funding to states for the construction and preservation of federally designated highways. (Most, but not all, of California’s state highway system is part of the federal highway system.) Other administrations perform similar functions for transit, railroads, aviation, and maritime activities.
State. The California Legislature sets the state’s overall transportation policies, including establishing state revenue sources and expenditure priorities. The Legislature typically appropriates a lump sum in the annual budget act for different types of transportation projects, while delegating the authority to select specific projects to various state entities and local governments. The main state transportation department is the California Department of Transportation (Caltrans), which owns, operates, maintains, and repairs the state highway system. It also provides the railroad cars for the state’s three intercity rail services. The California Transportation Commission (overseen by 11 voting members, including 9 appointed by the Governor and 2 by the Legislature) reviews and adopts the major transportation project lists proposed by Caltrans and regional agencies and oversees project delivery. Other state transportation departments include the High‑Speed Rail Authority (responsible for planning and constructing a high‑speed rail system), the Department of Motor Vehicles (DMV) (responsible for registering motor vehicles and issuing driver licenses), and the California Highway Patrol (CHP) (responsible for enforcing traffic laws on state highways). In addition, the state passes through certain federal and state funds to regional and local agencies.
Regional. There are two main types of regional transportation governing bodies that perform planning activities. First, the state has 18 Metropolitan Planning Organizations (MPOs) that are federally required planning bodies for every urbanized area in the state with a population over 50,000. These MPOs are comprised of representatives from local governments and transportation authorities in the designated area. They prepare 20‑year Regional Transportation Plans that project the area’s long‑term transportation needs and priorities, as well as four‑year Transportation Improvement Programs that identify specific transportation projects for federal funding. Second, the state has 26 Regional Transportation Planning Agencies (RTPAs). These RTPAs perform functions similar to the MPOs but are located in rural areas of the state. Most MPOs and RTPAs consist of a single county or a group of counties.
Local. California’s 58 counties and 482 cities own, maintain, and provide funding for the local streets and roads in their jurisdictions. They also typically own the commercial airports and seaports located in their communities (though these tend to be overseen by independent commissions and structured as revenue‑generating operations). Additionally, cities and counties set land‑use policies, nominate transportation projects for funding by their regional governing body, and enforce traffic laws in their communities. Some counties also have transportation authorities that are responsible for developing expenditure plans for voter‑approved local sales tax measures. The state has hundreds of transit agencies—such as the Bay Area Rapid Transit and Los Angeles County Metropolitan Transportation Authority—that deliver transit services, such as through buses, subways, and light rail. Three different joint powers authorities (groups of local governments) operate the state’s intercity rail services.
Chapter 2
Driving
Like elsewhere in the nation, driving is the predominant mode of transportation in California. The vast majority of Californians have driver licenses, and vehicle ownership is widespread, with the number of registered vehicles exceeding the number of licensed drivers. The state has a large network of highways and local streets and roads, consisting of almost 400,000 lane‑miles of pavement and over 25,000 bridges. Most of the state infrastructure is in good or fair condition—however, the state has struggled for many years with a large backlog of maintenance projects. Maintaining existing driving infrastructure has emerged as one of the key transportation issues facing the state (and local governments).
In this chapter, we provide information on driving in California, including information on drivers, vehicles, state highways, and local streets and roads.
Most Californians Have Driver Licenses
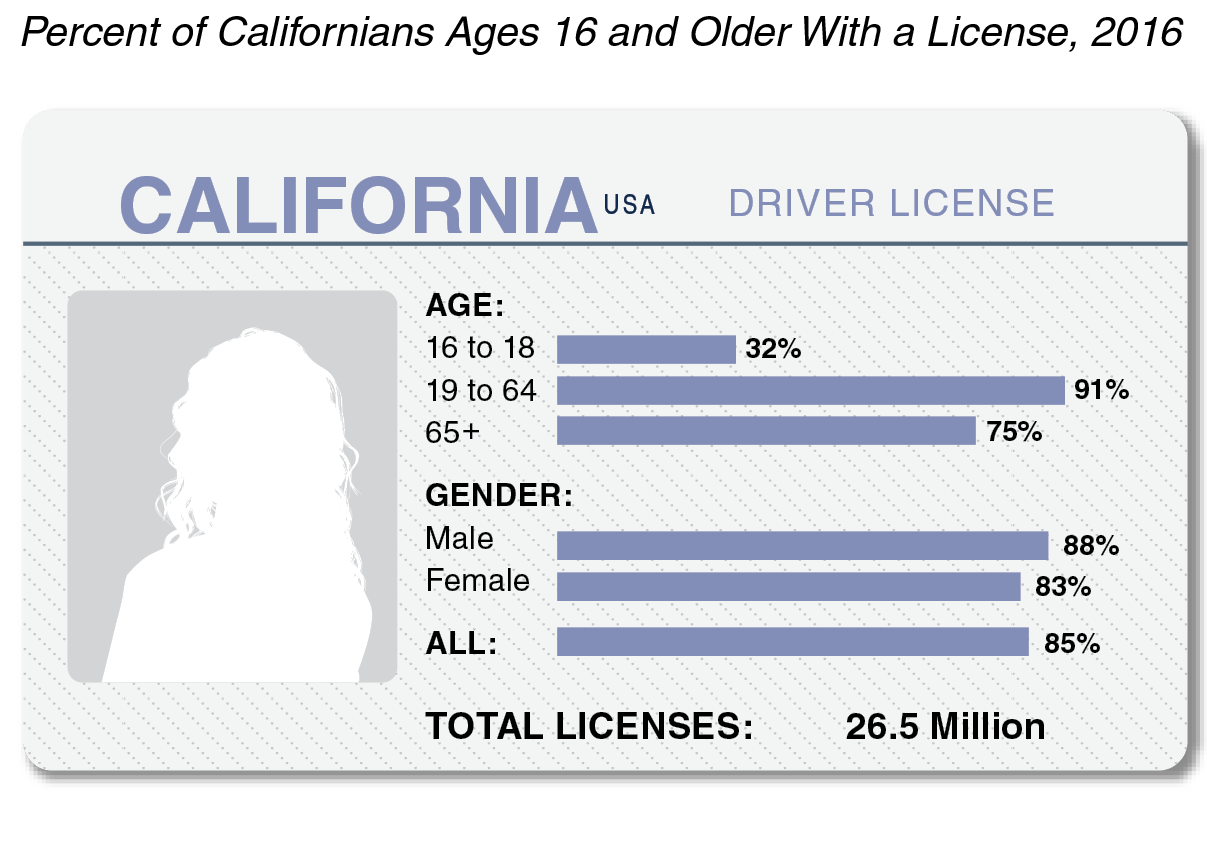
- In 2016, 85 percent of Californians ages 16 and over had a driver license. This share has increased slightly in recent years, likely due in part to Chapter 524 of 2013 (AB 60, Alejo), which authorized undocumented residents of California to obtain licenses.
- The share of Californians with licenses varied by age, with younger and older Californians less likely to have them. Less variation occurred by gender, though men were somewhat more likely to have them.
- The state does not collect data on the race, ethnicity, or income of Californians having driver licenses. However, one recent national survey showed that blacks and Latinos were somewhat less likely to have them.
Most California Vehicles Are Cars and Use Gas or Diesel
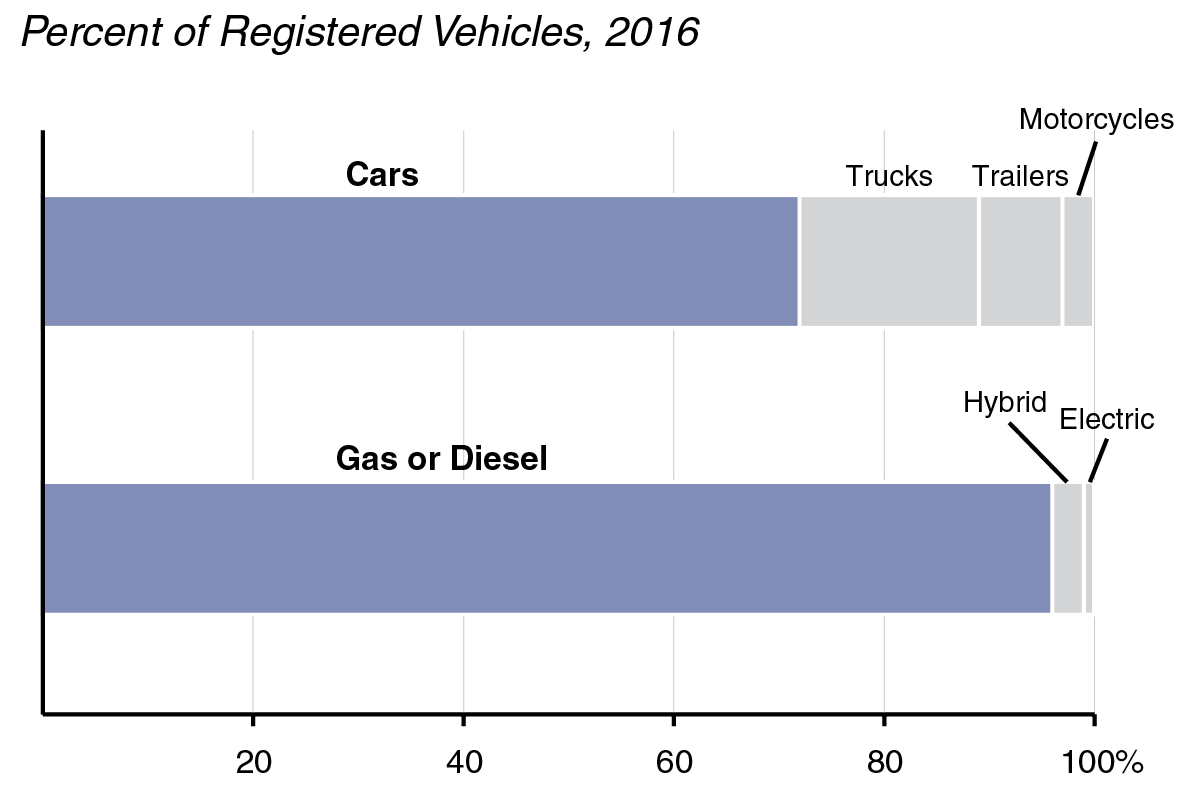
- In 2016, the DMV registered 35.3 million vehicles. This means there was 1.3 registered vehicles for every licensed driver.
- Nearly three‑quarters of registered vehicles were cars. Trucks and trailers made up most of the remaining one‑quarter.
- Though hybrid and electric vehicles made up only 3 percent of registered vehicles, ownership of these types of vehicles has increased rapidly in recent years. In 2016, there were nearly twice as many hybrid and electric vehicles registered as compared to four years earlier.
State Highway System Much Smaller Than Network of Local Streets and Roads
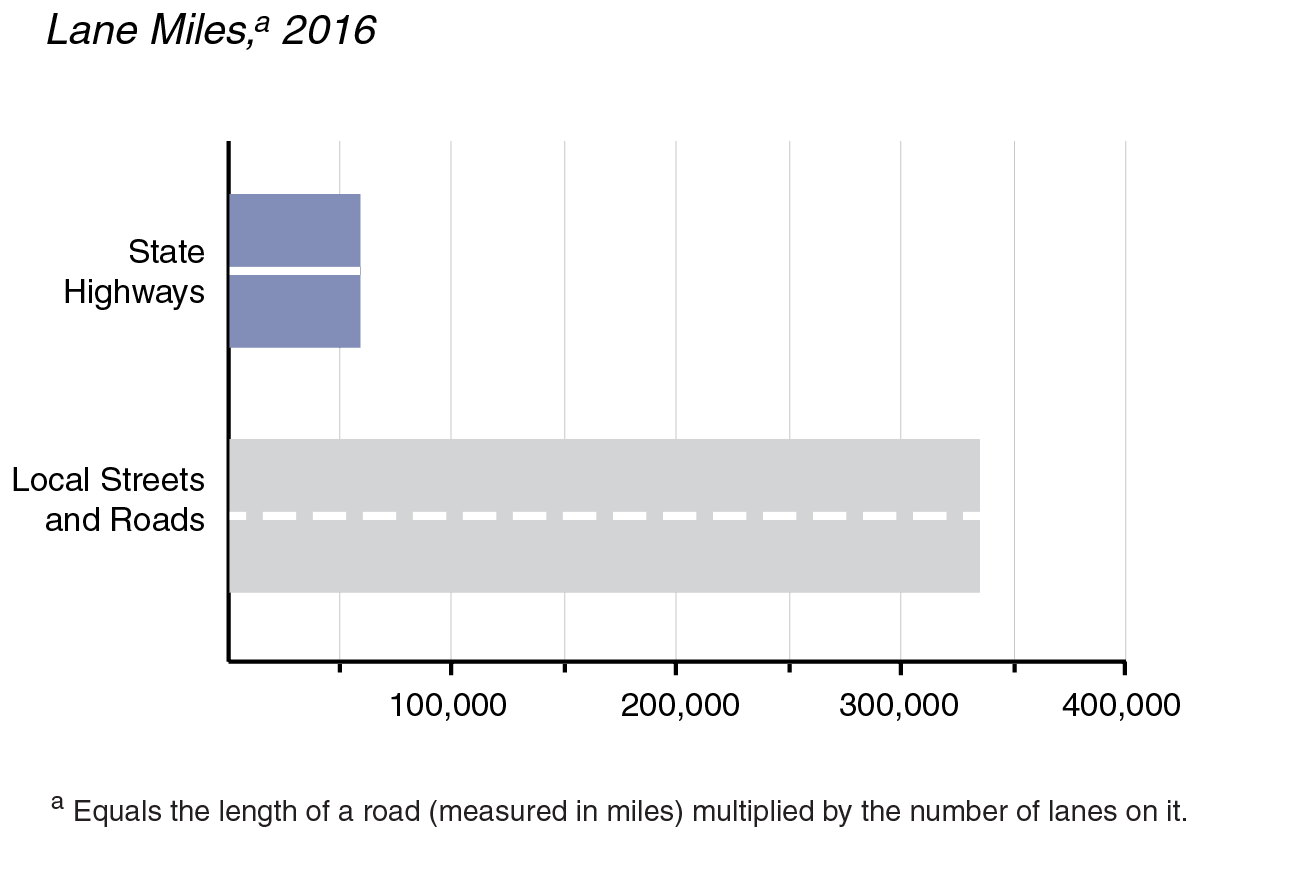
- In 2016, California’s state highway system was made up of 51,000 lane miles. The state highway system consists of both federally and state‑designated highways.
- California’s network of local streets and roads was much larger, consisting of about 335,000 lane miles. This includes 181,000 lane miles of city streets and 155,000 lane miles of county roads.
- The state has not added much highway capacity over the last decade, with the number of highway lane miles growing by only 1 percent.
Most State Highways and Bridges Are in Good or Fair Condition
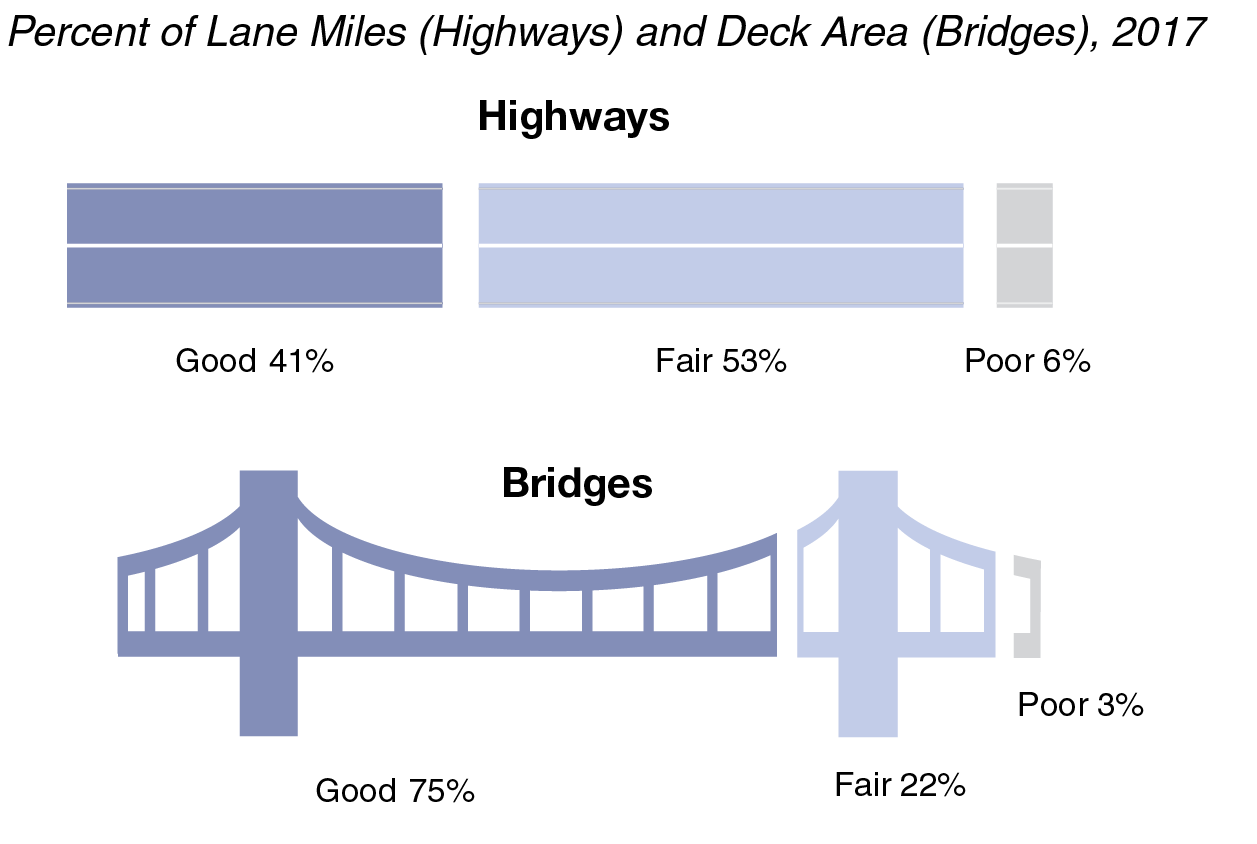
- In 2017, the state rated 94 percent of its highway pavement and 97 percent of the deck area on its bridges as being in good or fair condition. That same year it set a ten‑year goal to have at least 98 percent of pavement in good or fair condition.
- Ratings take into account factors such as roughness and cracking. In general, good condition means only maintenance work is necessary, while fair condition means either maintenance or rehabilitation is needed. Pavement and bridges rated as poor require major rehabilitation or outright replacement.
- According to one recent study, local governments collectively rated their pavement and bridges as being in somewhat similar condition as state highways and bridges.
Average California Driver Travels 35 Miles Per Day
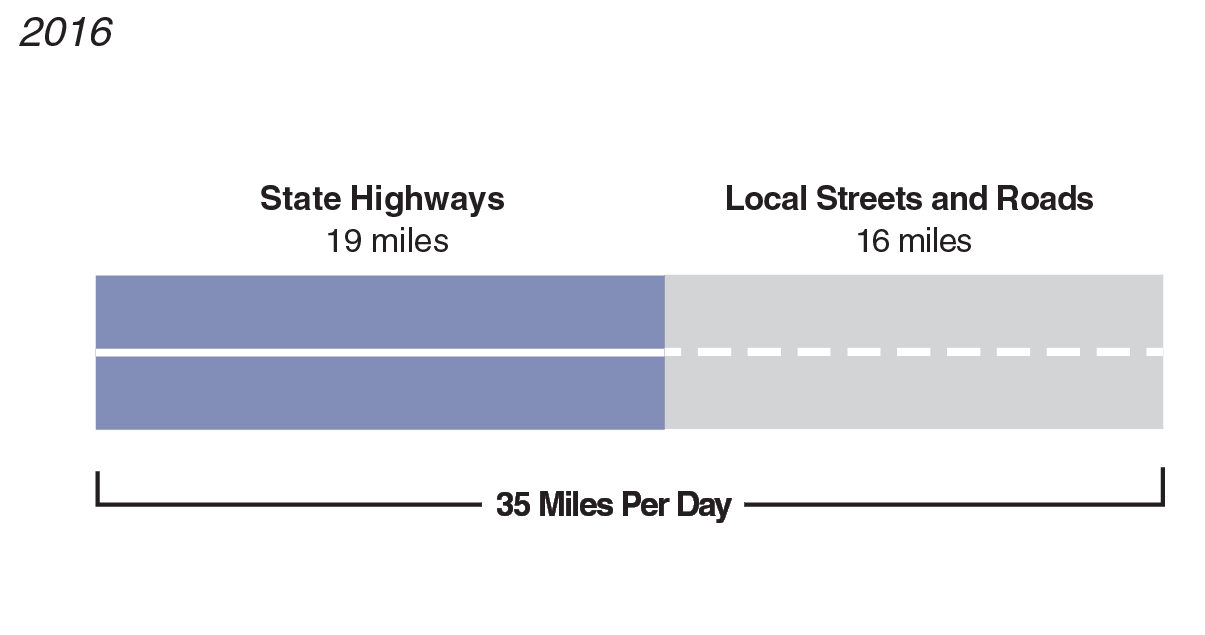
- In 2016, the average Californian drove slightly more on highways compared to local roads, even though the highway system is much smaller.
- Compared to a decade earlier, the average driver traveled four fewer miles each day. The decrease could be attributable to many factors such as changes in income and gas prices.
- Despite the decrease in miles driven per driver, the total miles driven statewide increased slightly over the decade, due to an increase in drivers.
- According to a 2017 survey, California ranked as the 15th lowest state for miles traveled per driver. A 2012 survey found California had a lower share of commuters who drive compared to most other states.
State Highway Congestion Increasing in Recent Years
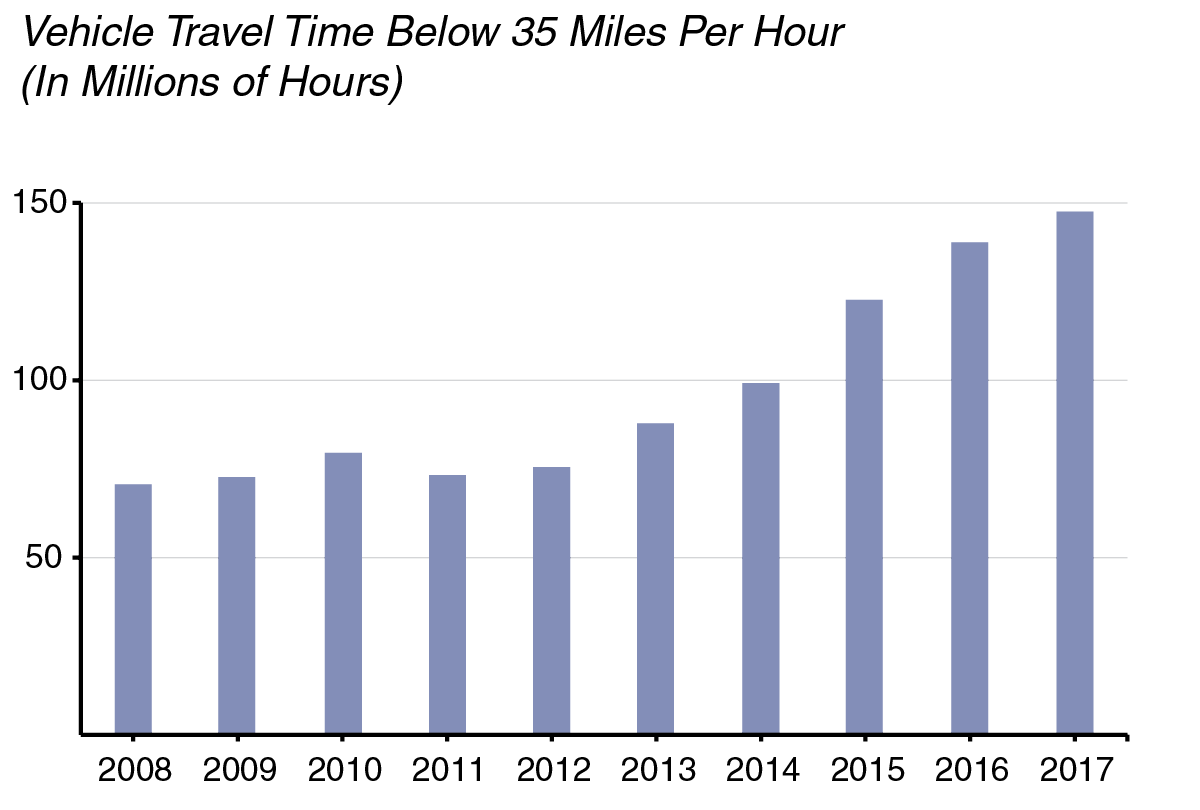
- Caltrans measures the time vehicles spend traveling below certain speeds—known as “vehicle hours of delay.” This measure has increased in recent years, likely because employment growth has led to more individuals commuting at the same time.
- In recent years, the state has not added much highway capacity to address congestion, as research suggests this approach only works temporarily because it ultimately attracts more drivers. Instead, the state has tried alternatives, such as creating fee‑based express lanes.
Driving Fatalities Climbing in Recent Years After Sharp Decline
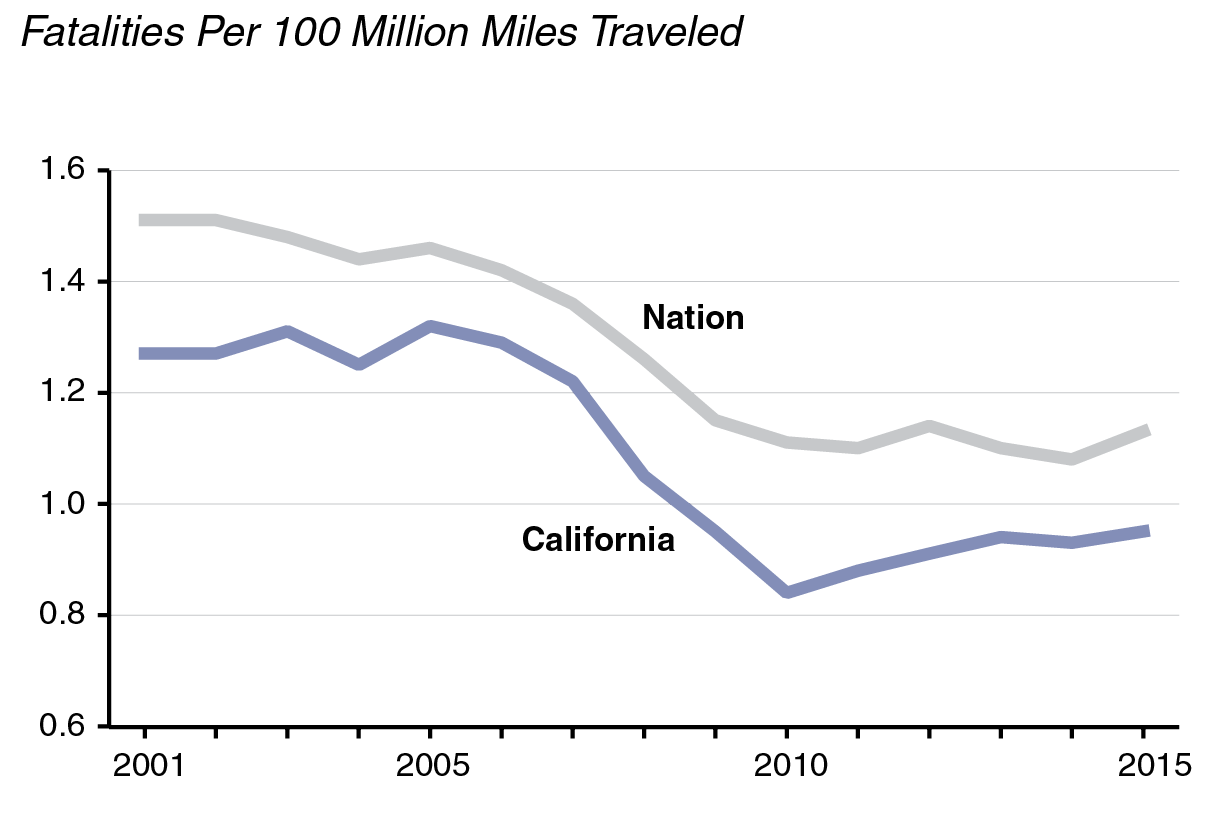
- In 2015, vehicle crashes in California caused 3,176 fatalities and 251,000 injuries—averaging to about one fatality every three hours and one injury every two minutes. Nearly half of fatalities and one in five injuries were caused by drunk driving or involved alcohol.
- Fatalities in California decreased by 34 percent from 2001 through 2010 (after controlling for miles driven). Since then, however, fatalities have increased by 13 percent. These trends mirror those occurring nationally.
- Experts cite various factors for the decrease in fatalities during the 2000s, such as enhanced vehicle safety. The causes of the recent uptick are not yet well understood, though some experts cite an increase in distracted driving.
Driving Is the Largest Source of Greenhouse Gas Emissions in California
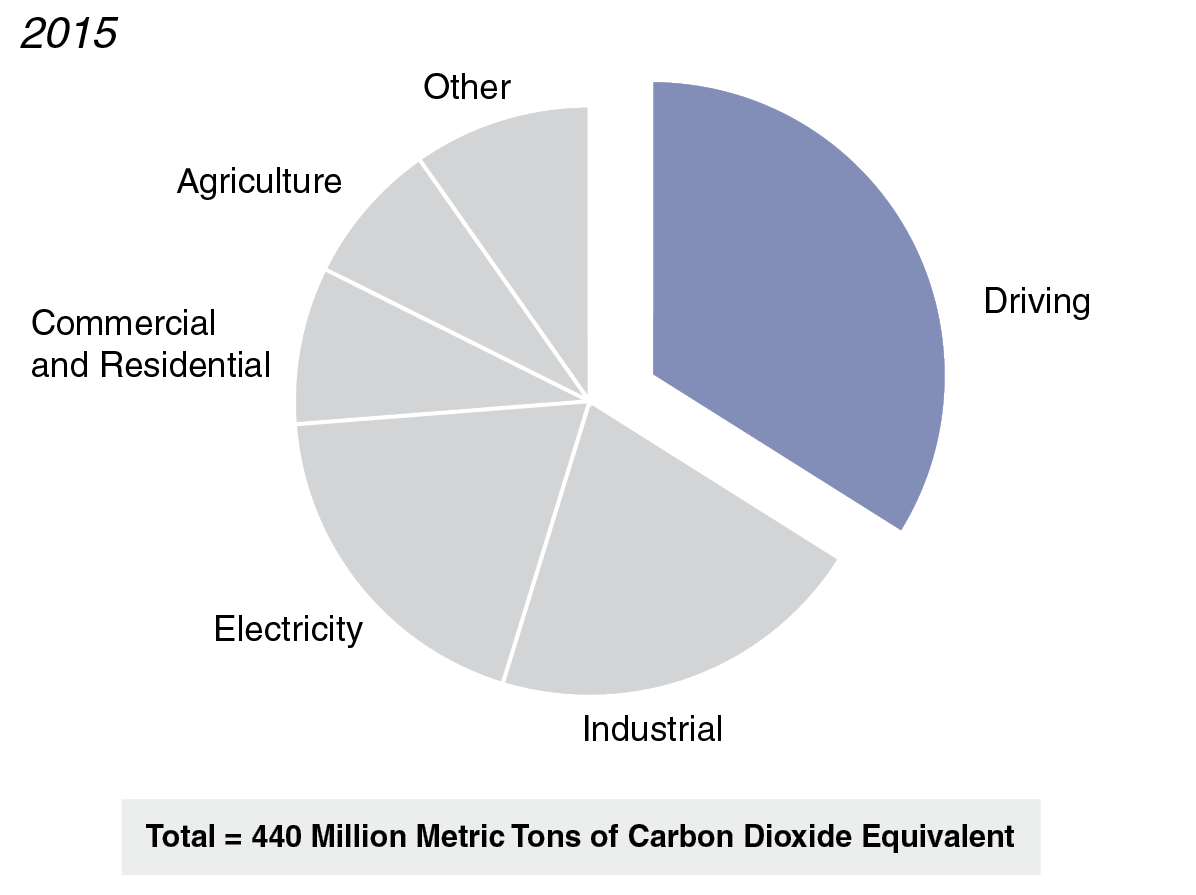
- In 2015, emissions from driving made up about one‑third of all greenhouse gas (GHG) emissions in California. Most of these emissions came from passenger vehicles.
- The amount of GHG emissions from driving decreased by 8 percent over the previous 15 years. This contributed to a decrease in overall GHG emissions of 6 percent during this same period.
- Driving also emits a notable amount of other air pollutants. In 2012, for instance, driving was the source of just over half of the carbon monoxide and nitrogen oxide found in California’s air. These other pollutants can have harmful effects on human health and the environment.
Fuel Use Per Driver Decreasing
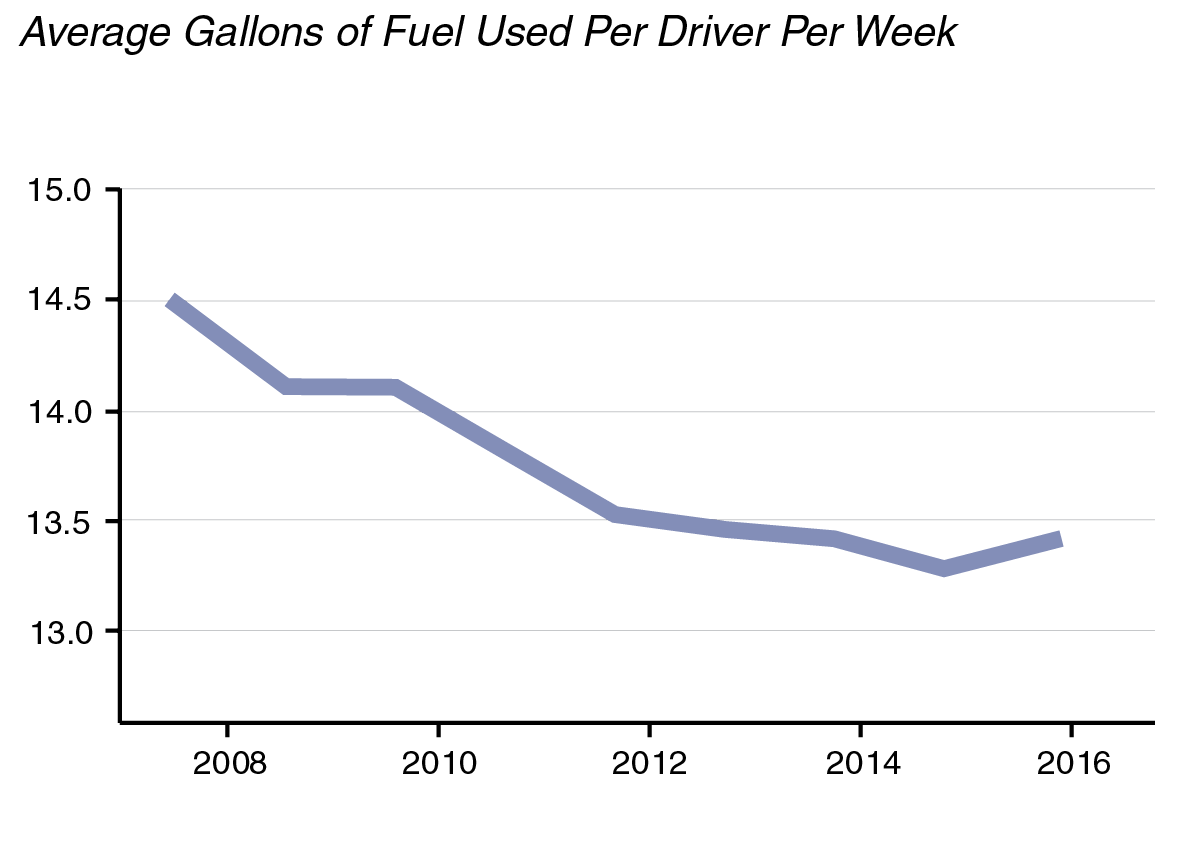
- In 2016, California drivers on average used 13.4 gallons of gasoline and diesel per week. This is a 7 percent decrease over the previous eight years.
- The amount of fuel used per driver decreased for two main reasons. First, as noted earlier, the average driver has been driving fewer miles. Second, many vehicles became more fuel efficient and ownership of alternative‑fuel vehicles increased.
- Despite the decrease in fuel consumption per driver, the total amount of fuel used statewide per week increased slightly from 2008 through 2016, due to increases in the number of California drivers.
Drivers on Average Pay About $750 Annually in Fuel Taxes and Vehicle Fees
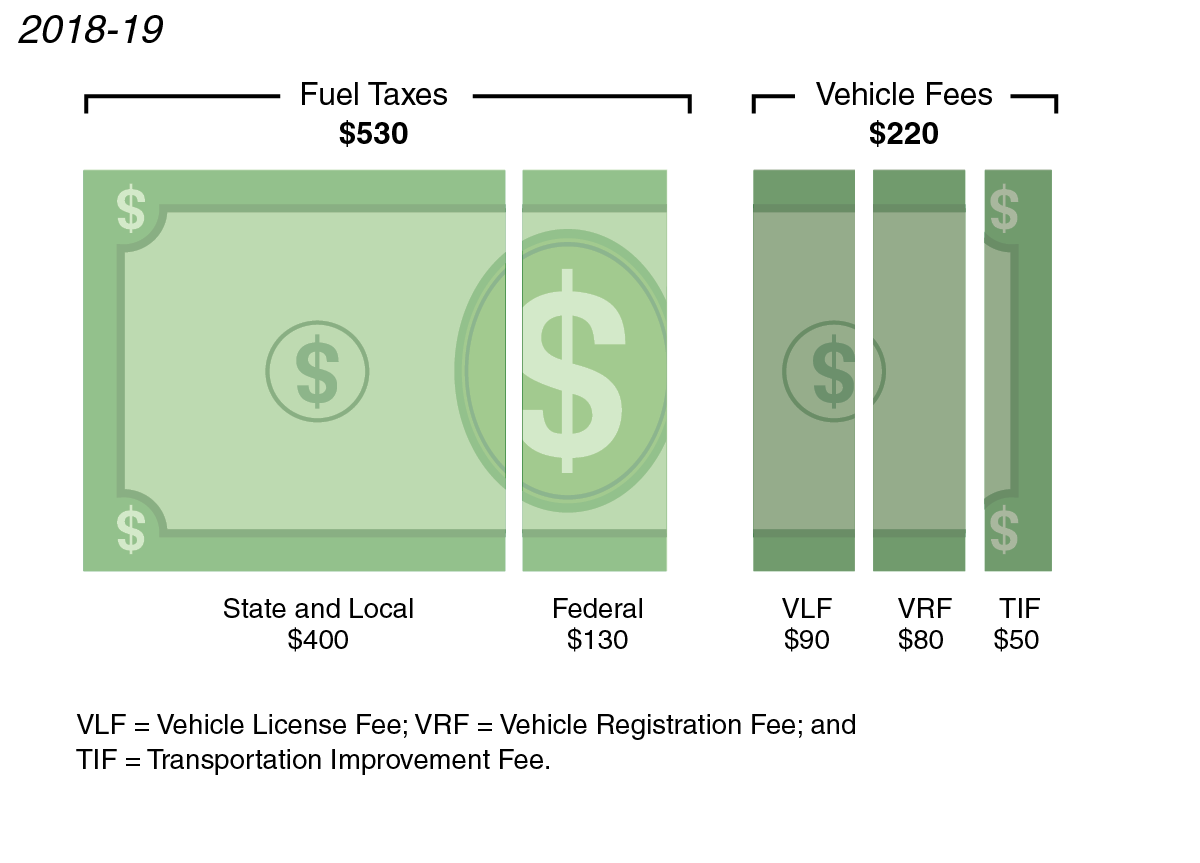
- State and federal excise (or per gallon) taxes on fuel and state and local sales taxes together cost drivers on average about $530 annually. The associated revenue mainly pays for transportation infrastructure.
- Additionally, drivers on average annually pay per vehicle about (1) $90 in vehicle license fees to support local governments, (2) $80 in vehicle registration fees primarily to support the DMV and the CHP, and (3) $50 in transportation improvement fees mainly to support transportation infrastructure.
- The figure does not include fees not paid annually (such as driver license fees). It also excludes fees not paid by all vehicle owners (such as truck weight fees) and fees imposed by counties.
Chapter 3
Mass Transportation
Mass transportation involves the movement of large numbers of people at once. For the purposes of this primer, mass transportation includes what are commonly referred to as “transit” services (such as city buses, subways, and ferries) as well as intercity rail and commercial aviation. California’s mass transportation infrastructure consists of approximately 22,000 transit vehicles serving more than 700 transit passenger stations, 2,550 miles of intercity rail corridors, and 28 commercial service airports. In recent years, the state has made significant investments in expanding transit and rail networks as one of several strategies for reducing the state’s GHG emissions and addressing highway congestion.
In this chapter, we provide information on mass transportation in California, including who uses transit; the state of repair of California’s transit assets; how the environmental impact of transit compares to driving; an overview of the planned high‑speed rail network; and recent trends in transit intercity rail; and airport ridership.
Largest Transit Systems Located in Major Urban Areas
|
Agency |
Share of Total Ridership |
|
Los Angeles Metro |
31% |
|
San Francisco Municipal Railway |
17 |
|
Bay Area Rapid Transit |
10 |
|
San Diego Metropolitan Transit System |
7 |
|
Alameda‑Contra Costa Transit |
4 |
|
Orange County Transportation Authority |
3 |
|
Santa Clara Valley Transportation Authority |
3 |
|
Long Beach Transit |
2 |
|
Sacramento Regional Transit District |
2 |
|
Los Angeles Department of Transportation |
2 |
- The state’s ten largest transit systems based on ridership accounted for 81 percent of all transit trips in 2016.
- California commuters who use transit tend to be somewhat younger and have lower incomes than commuters who drive alone.
Transit Ridership Has Declined in Recent Years
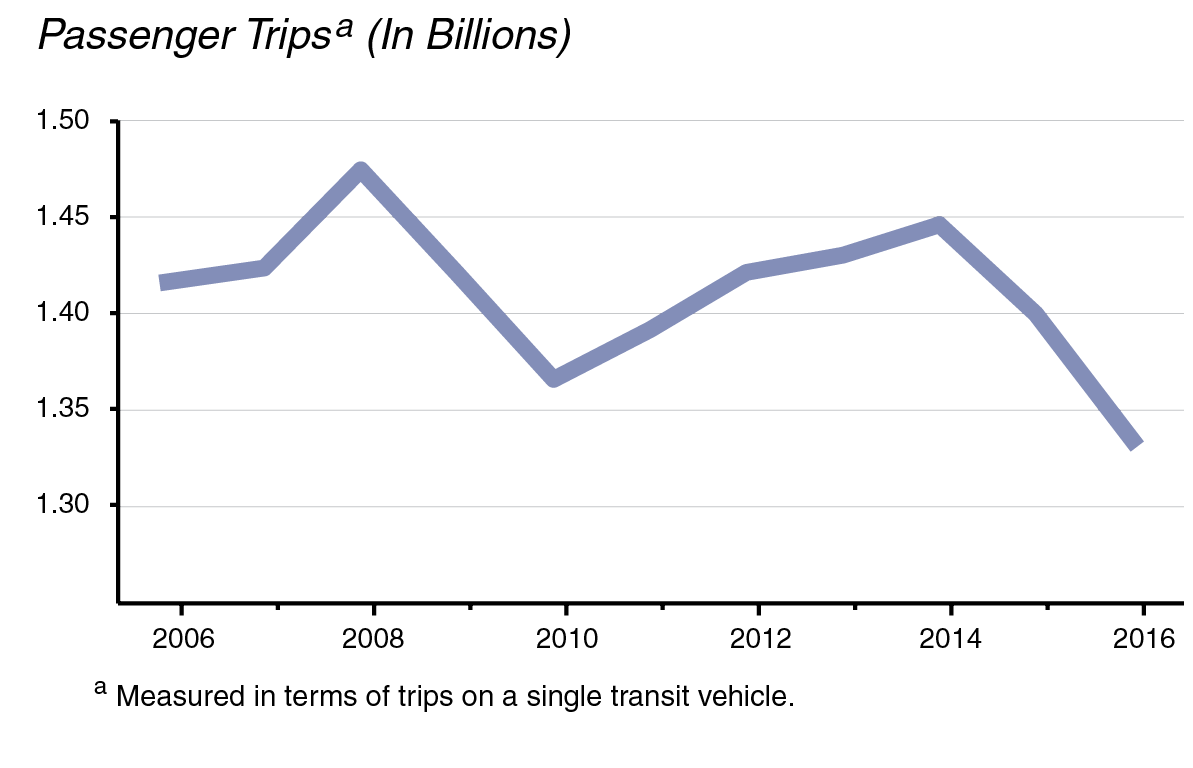
- Over the past decade, annual transit trips have fluctuated. Transit ridership declined—likely due to the recession—from 2008 through 2010 and then increased afterward for the next four years. However, since 2014 the number of passenger trips has declined by more than 100 million, or 7.7 percent. This decline is somewhat similar to trends across the nation, particularly in many of the nation’s largest cities such as New York, Washington, and Chicago.
- Several factors could explain the recent decline in transit ridership in California, including relatively lower gasoline prices that might have shifted some commuters to drive, the ability of undocumented immigrants to now obtain driver licenses, rising vehicle ownership in Southern California, and the growing usage of ride‑hailing services.
Most Transit Trips Occur on Buses
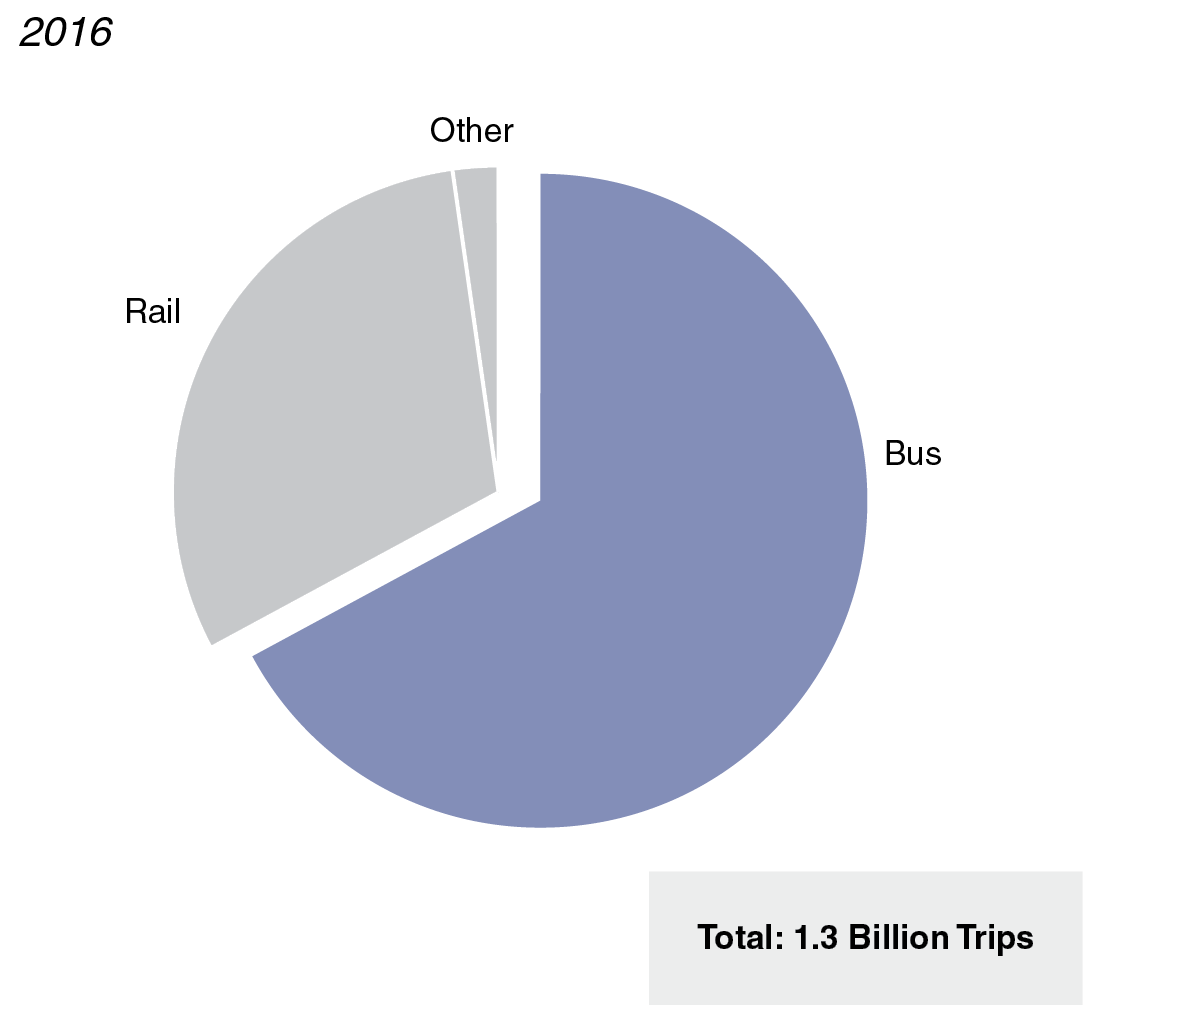
- In 2016, two‑thirds of all transit trips in California took place by bus, with most of the remaining trips made by rail. A relatively small portion of trips were in ferries, vanpools, and “on call” vehicles that transport disabled and elderly individuals.
- Over the past decade, however, the proportion of trips taken by bus has declined by 9 percentage points, falling from 76 percent to 67 percent. In contrast, the proportion of rail trips has increased over the same time period from 23 percent to 31 percent.
Large Share of Transit Assets Are in Need of Replacement
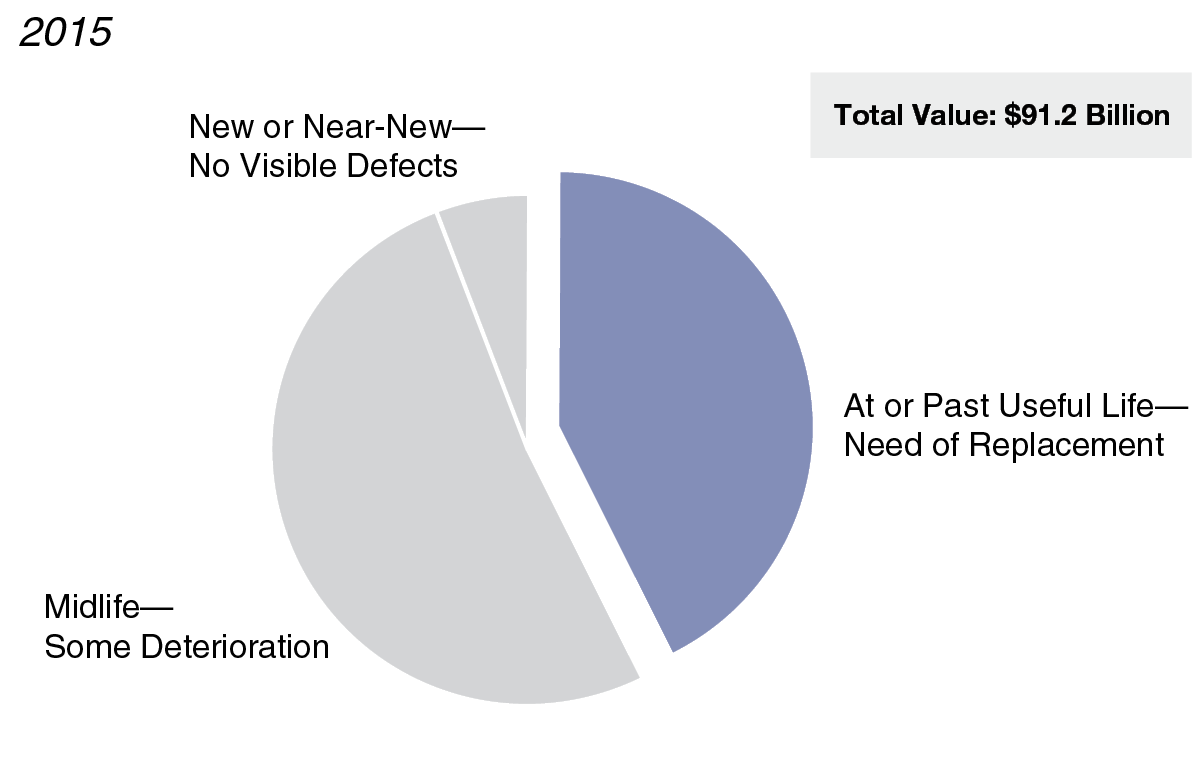
- Based on data from transit service providers, the Federal Transit Administration determines the current physical condition of transit capital assets around the country.
- A large share (43 percent) of California’s transit capital assets—including vehicles, stations, and fixed guideways such as rail tracks—are at or past their useful lives and require replacement. The remaining assets are in the middle of their useful lives with some deterioration (51 percent) or are new or near‑new (6 percent). Assets that operate beyond their useful life are at greater risk of failure, which can affect a transit system’s reliability and safety.
- Federal guidelines identify a 25‑year useful life for rail vehicles. The average age of California’s rail fleet is about 24 years.
Transit Trips Pollute Less Than Driving Alone
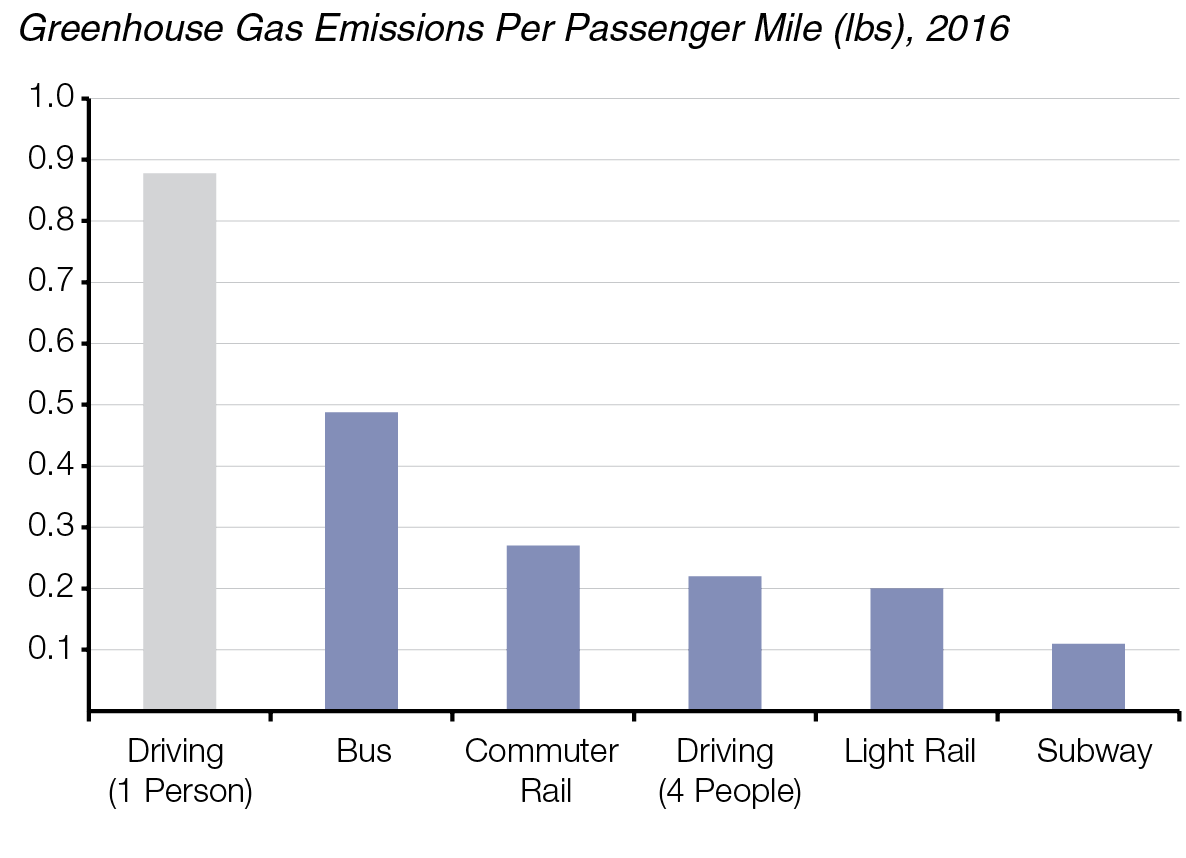
- Compared to driving alone, transit trips emit fewer GHGs on a per‑passenger‑mile basis.
- Carpooling reduces the per‑passenger‑mile impact of driving considerably. For example, a four‑person carpool emits fewer GHGs per passenger mile than a typical transit vehicle. However, four‑person carpools are relatively uncommon.
- Transit emissions vary by transit mode. In California, buses emit roughly four times more GHGs per passenger mile than subways, and approximately two times more than light rail and commuter rail systems.
Intercity Rail Ridership Growing
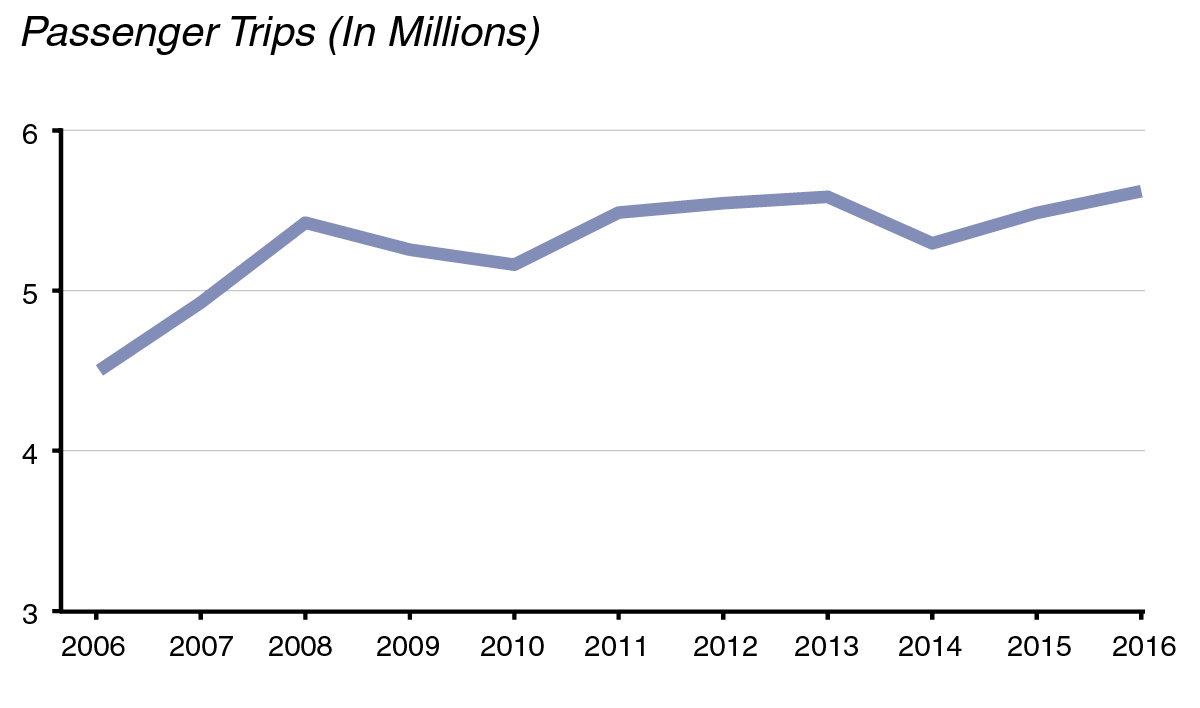
- The state funds three Amtrak‑operated intercity rail routes: (1) Capitol Corridor (San Jose, Oakland, Davis, Sacramento, and Auburn); (2) Pacific Surfliner (San Diego, Los Angeles, Santa Barbara, and San Luis Obispo); and (3) San Joaquin (Oakland, Sacramento, Fresno, and Bakersfield).
- Over the past decade, total ridership on all three routes has grown—increasing from about 4.5 million passengers in 2006 to 5.6 million passengers in 2016. Since intercity rail tends to serve longer‑distance travelers, ridership on these services represents a small share of all trips.
- While more frequent service likely explains some of the ridership growth, increasing roadway congestion could also be a contributing factor. Passenger surveys indicate that many Californians use intercity rail to maximize their time while traveling—whether through work or leisure—and to avoid traffic.
High‑Speed Rail Project Began Construction in 2015
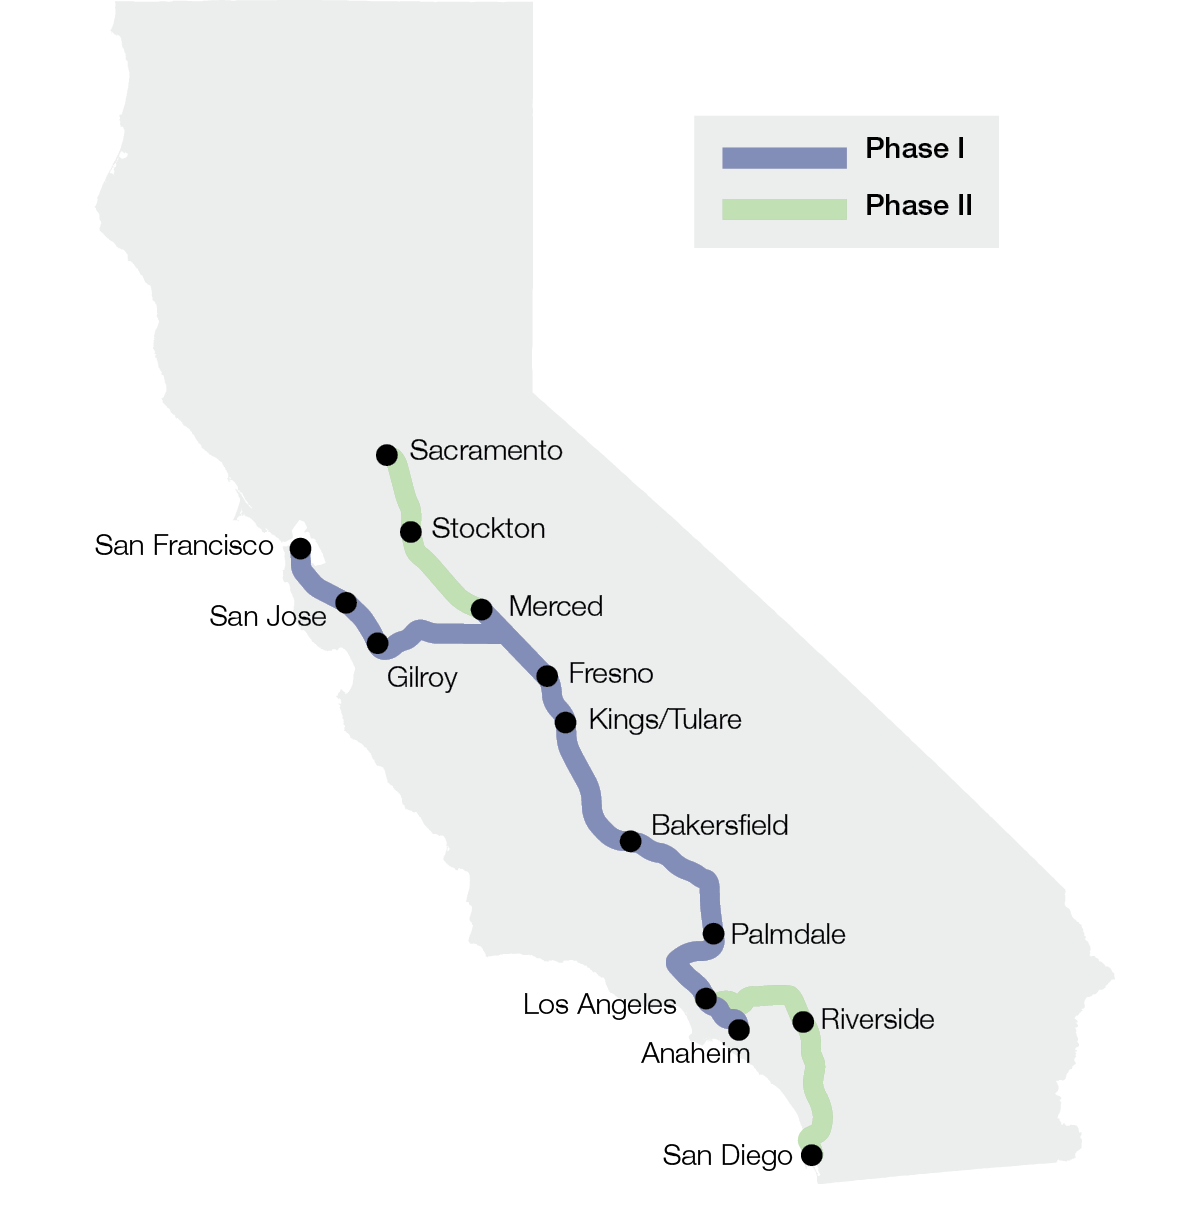
- The state’s high‑speed rail project has received $10 billion in state bond funding, $3.5 billion in federal funds, and currently receives 25 percent of the state’s cap‑and‑trade auction revenues.
- The state began construction on an initial operating segment connecting San Francisco to the Central Valley, which is scheduled to open by 2029.
Air Travel Within California Rising
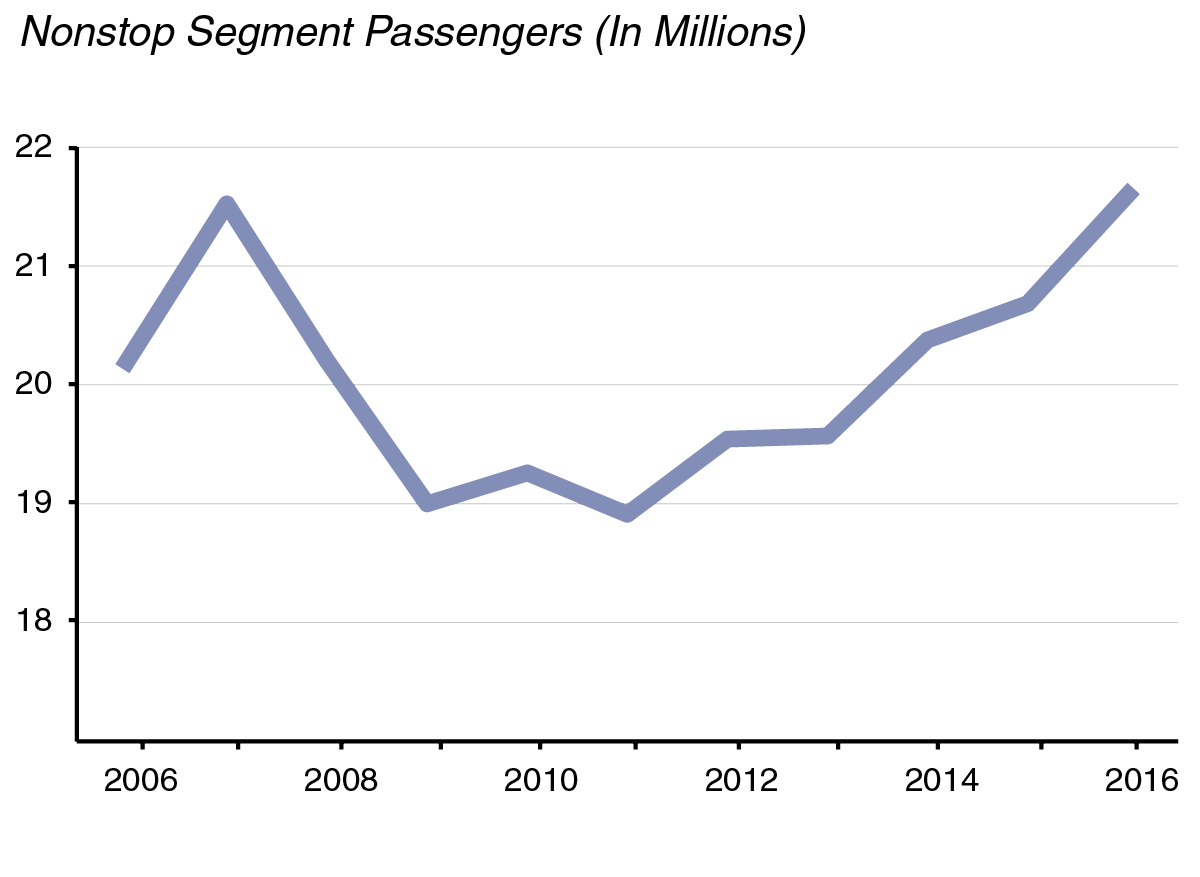
- While the number of passengers flying on nonstop routes between commercial service airports within California declined from 21.5 million in 2007 to 19 million in 2009, it has since increased to 21.6 million in 2016.
- There is a close relationship between air travel and the economy, which explains the sharp decline in passenger numbers during the Great Recession and the growth during the recent economic expansion.
Chapter 4
Active Transportation
Active transportation involves the traveler being physically active through biking and walking. In recent years, the state has taken steps to improve the infrastructure for this type of transportation. For example, in 2013 the state established the Active Transportation Program (ATP) by consolidating several existing state and federal bicycle and pedestrian programs in order to provide greater flexibility in meeting the state’s active transportation needs. In 2017, the state increased state funding for ATP by $100 million, bringing total annual funding for the program to $230 million. In addition, Caltrans recently published the state’s first bicycle and pedestrian plan, which focuses on four objectives—safety, mobility, preservation, and social equity. Beyond improving infrastructure for bicyclists and pedestrians, active transportation efforts also help the state meet its climate change goals by encouraging emission‑free modes of travel.
In this chapter, we provide information on active transportation in California, including data on bicycling and walking trips as well as cyclist and pedestrian injuries and fatalities.
Californians Walk More Than the National Average
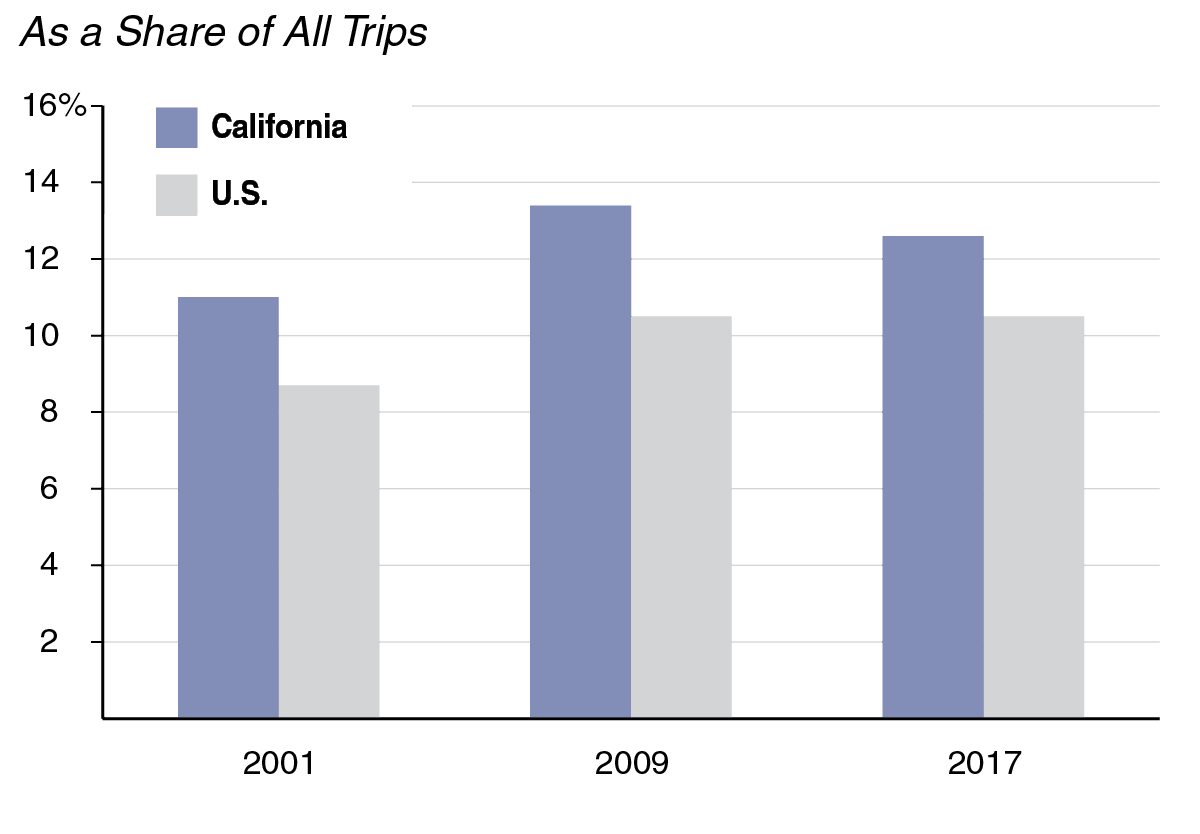
- Based on a series of national surveys of the travel behaviors of Americans (regardless of destination), the share of all trips taken by foot in California increased from 2001 to 2017—from about 11 percent to 13 percent. This is approximately two percentage points higher than for the country as a whole.
- Over the same time period, the share of all trips taken by bicycle in California increased slightly but still represent roughly 1 percent of the total. This is similar to the national figure.
- Walking and cycling are uncommon modes of travel for commuting to work. Just 3 percent of California commuters walk to work, while 1 percent bike.
Growing Focus on Planning for Bicycle and Pedestrian Travel
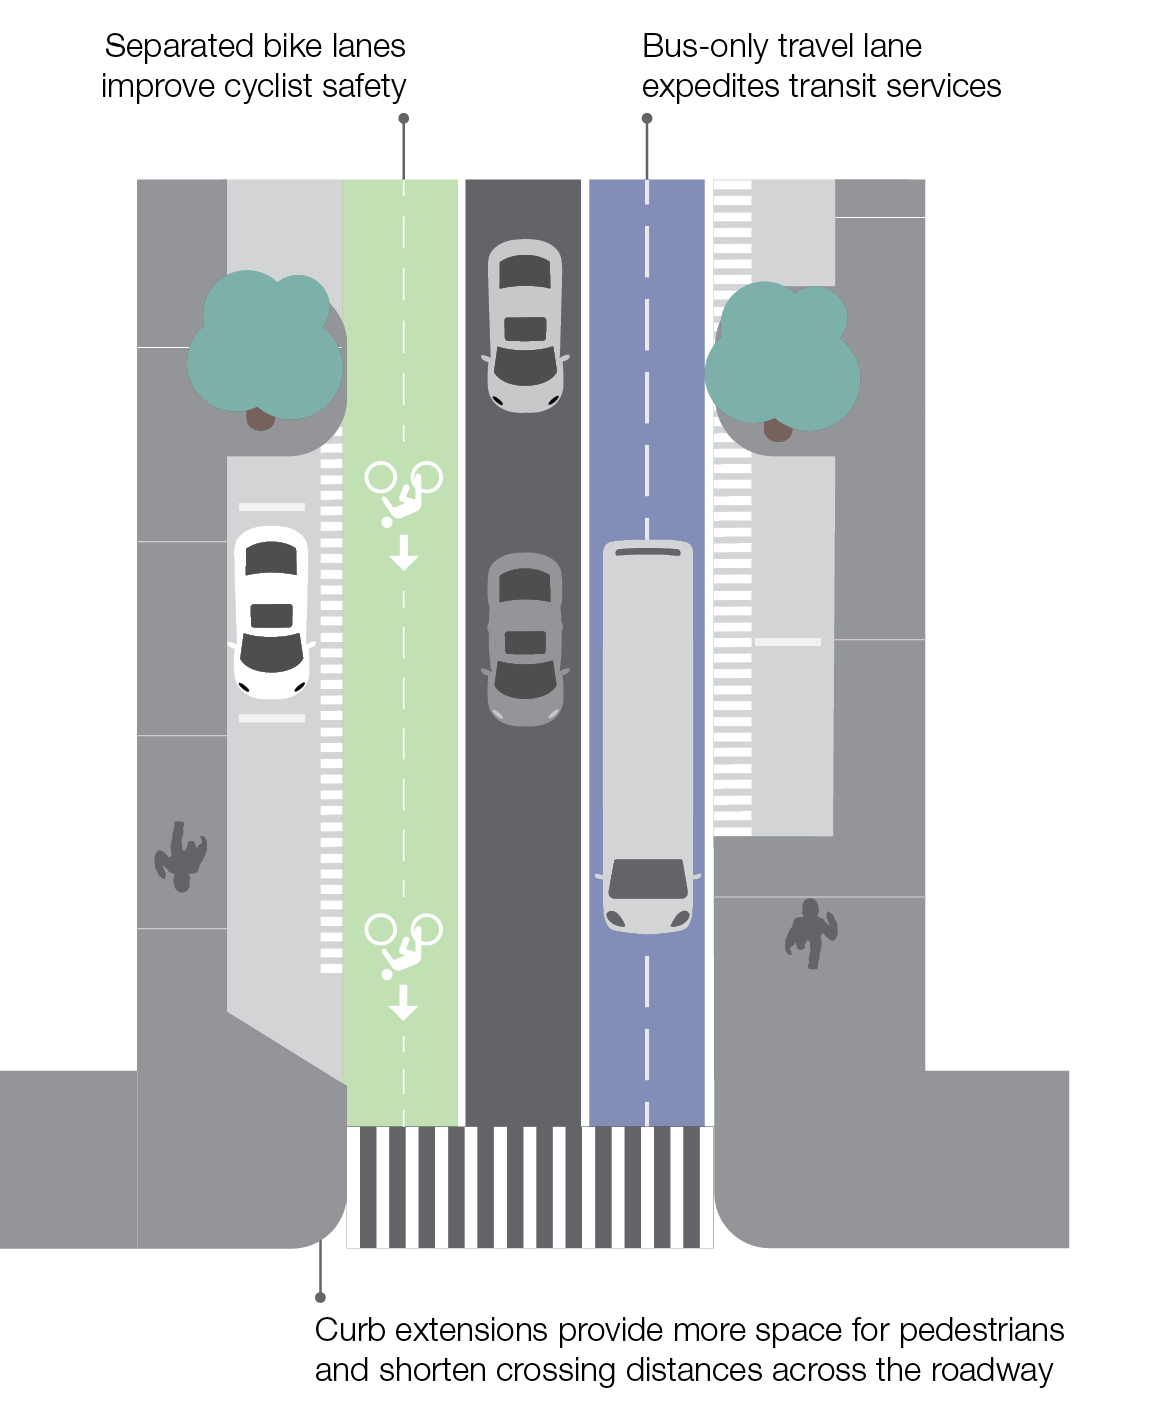
- In 2014, Caltrans began efforts to promote the “complete streets” urban design concept through design manuals and guidance. Complete streets are designed and operated for the safe mobility of all users, including cyclists and pedestrians.
Pedestrian and Cyclist Fatality Rates Increasing in Recent Years
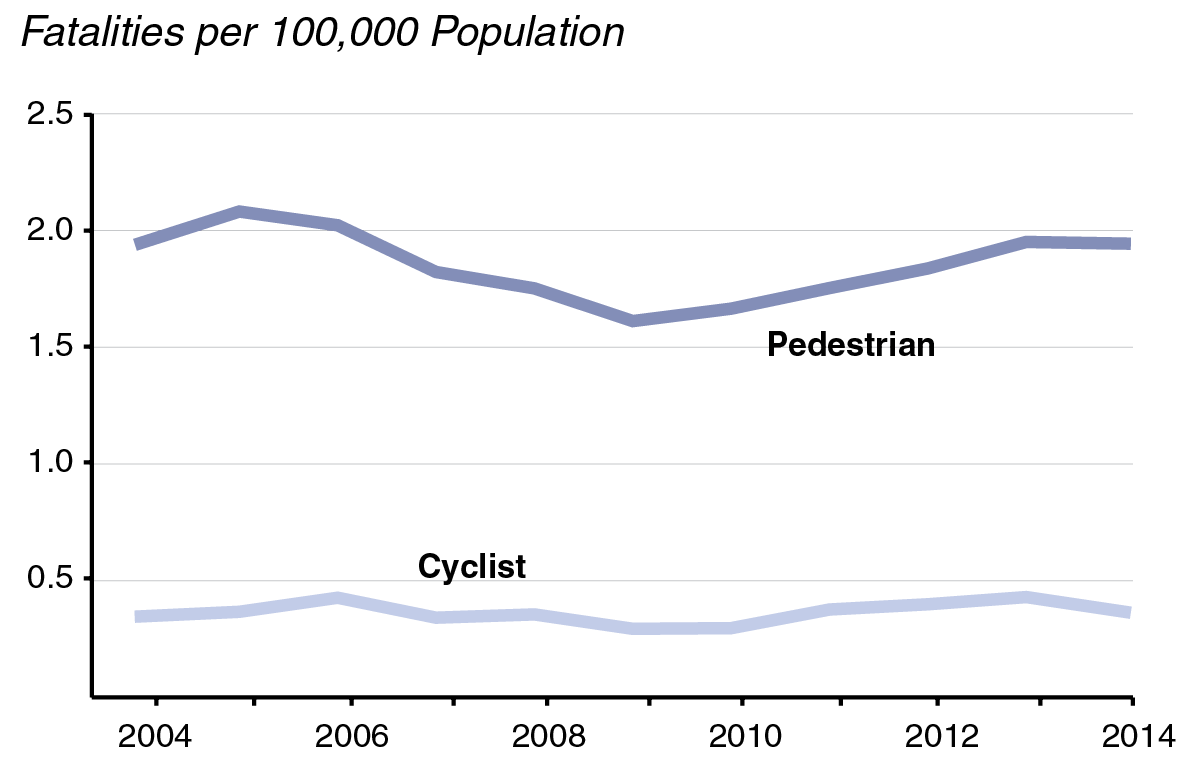
- Annual pedestrian fatality rates in California declined between 2005 and 2009, but have since increased. Cyclist fatality rates have also risen slightly in recent years. (Pedestrian and cyclist injury rates have exhibited similar trends.)
- Some experts suggest that the growing number of sport utility vehicles on the road, or pedestrian distraction due to mobile devices, might be contributing to the recent uptick in fatality rates.
- California’s fatality rates are higher than the national averages. In 2014, there were 1.9 pedestrian fatalities and 0.37 cyclist fatalities per 100,000 people in California, compared to 1.5 pedestrian and 0.23 cyclist fatalities per 100,000 people nationally.
Chapter 5
Freight Movement
California is a hub for freight movement. Measured by value, more international goods enter California than any other state, moving through its 12 seaports, 12 major cargo‑handling airports, and 3 land ports of entry with Mexico. In addition, the state’s agricultural sector is a critical source of goods for export.
Highways and trucks form the backbone of California’s freight transportation system. Air cargo volumes are on the rise, however, coinciding with the recent economic upswing. Privately operated and maintained railroads continue to play a key role in freight movement in California, while the state’s seaports handle large volumes of international imports and exports. The state recently completed a Freight Mobility Plan to enhance the economic competitiveness while mitigating the issues associated with freight movement.
In this chapter, we provide information on the movement of freight in California, including the share of international imports arriving in the state, shipment modes, air cargo volumes, and the scope of the freight rail network.
More Imports Enter the U.S. Through California Than Any Other State
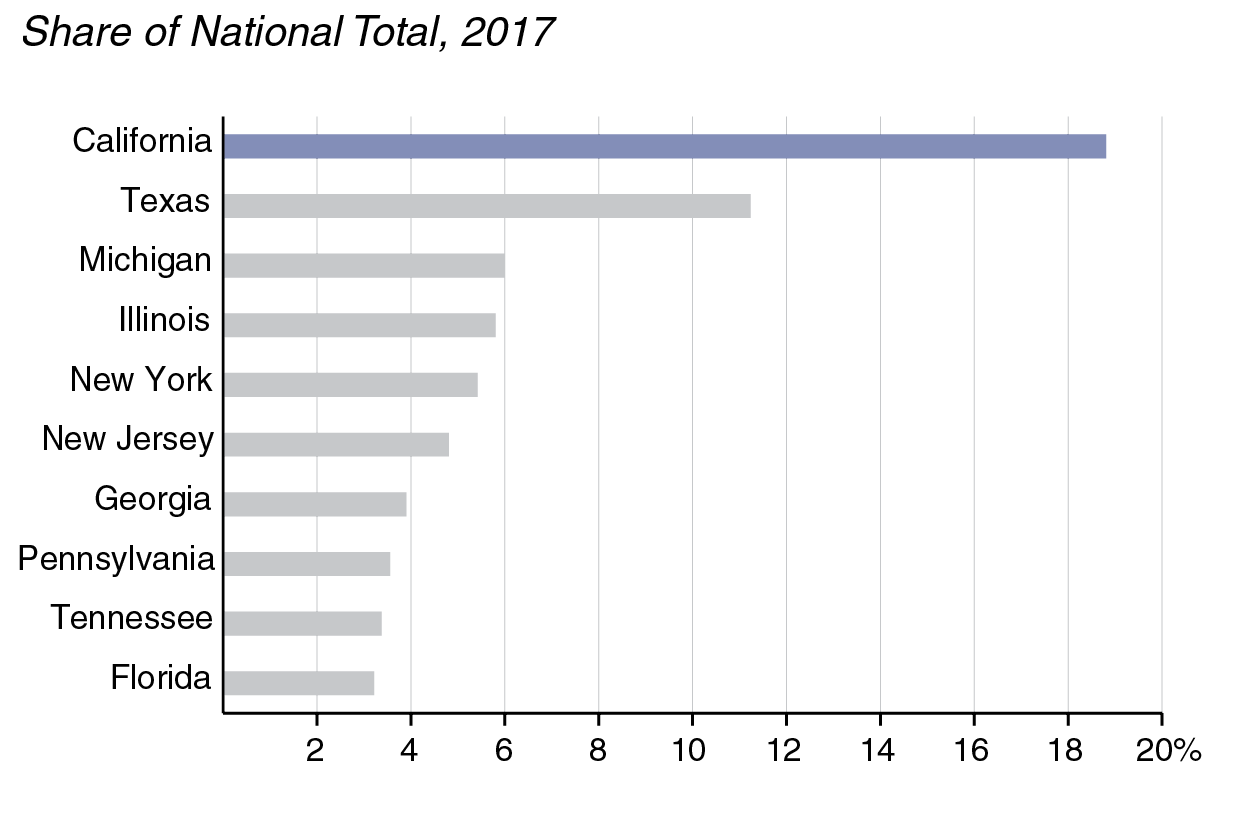
- California is the entry point for a larger share of U.S. imports than any other state. In 2017, approximately 19 percent of the country’s imports arrived in California.
- The top four imports to the state by dollar value were passenger vehicles, personal computers, cell phones, and oil.
Most Domestic Freight Shipped Out of California on Trucks
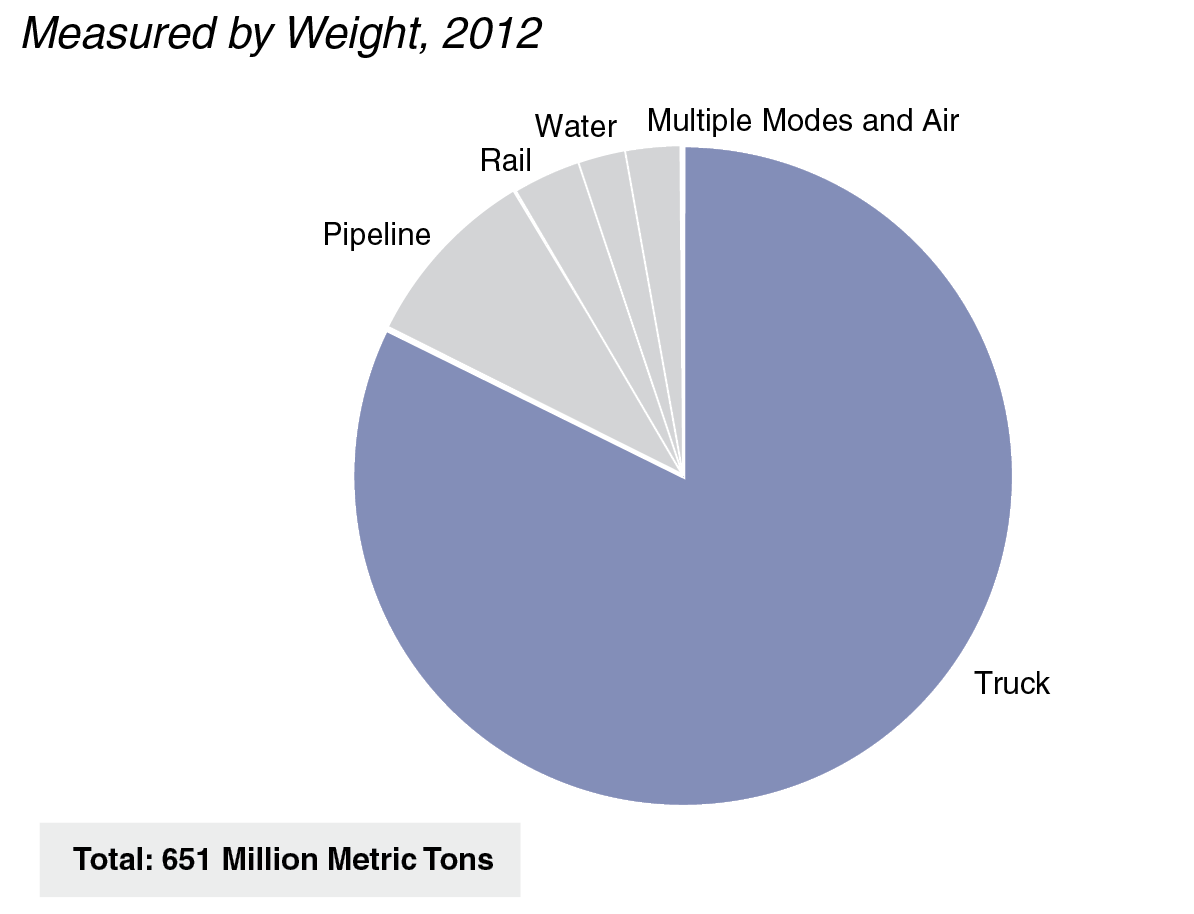
- More than 80 percent of the freight that was shipped out of California to elsewhere in the U.S. in 2012—as measured by weight—was on trucks. This includes goods produced in California, as well as imported goods being shipped to another location.
- Large trucks cause much more damage to roads than smaller vehicles. A single tractor‑trailer at the maximum allowed weight (80,000 pounds) can have the same impact on pavement as up to 17,000 cars (each weighing 4,000 pounds). The average weight of a tractor‑trailer in California is 51,000 pounds.
Air Cargo Volumes at California Airports Increasing After Sharp Decline
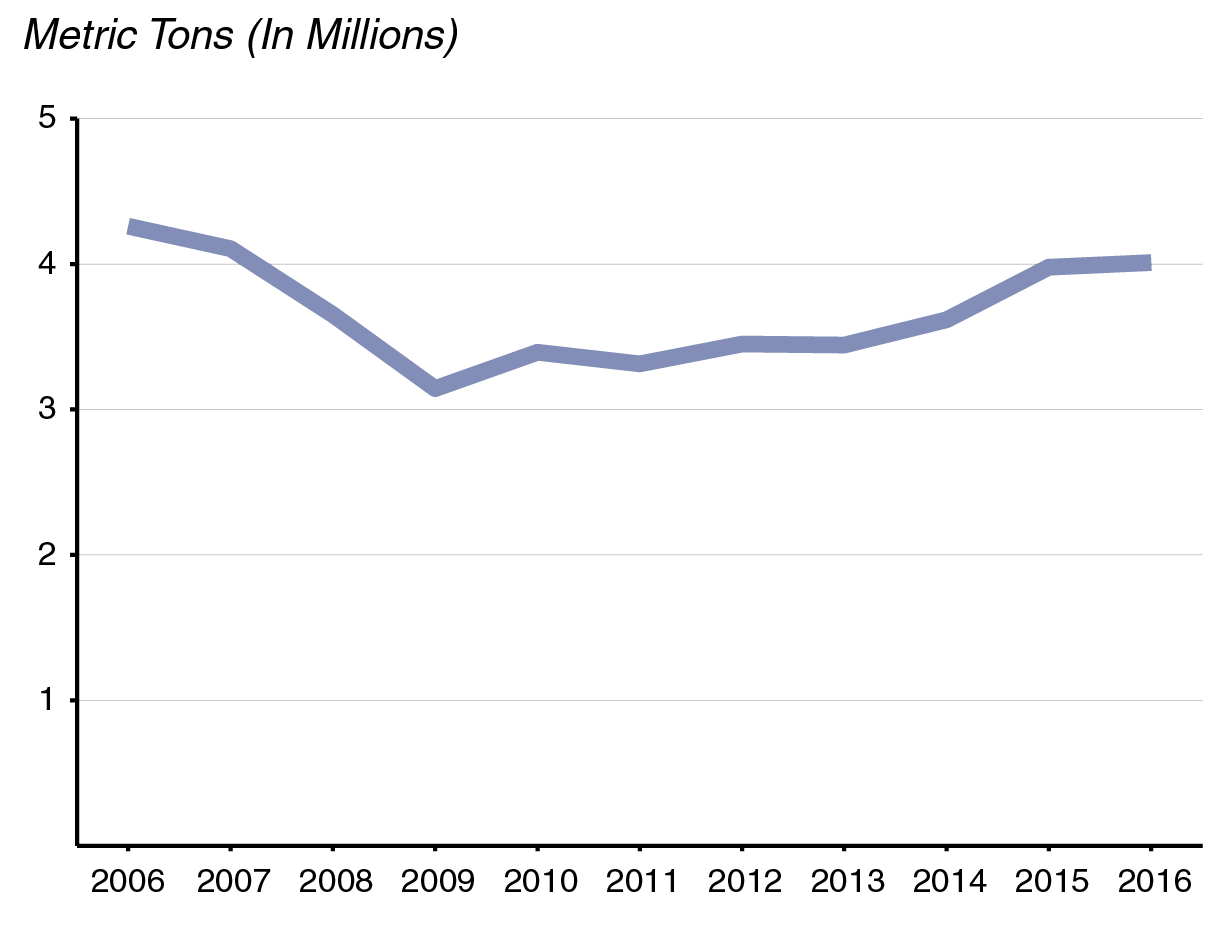
- Between 2006 and 2009, air cargo volumes at California’s airports decreased. Since that time, air shipments have generally increased but remain slightly below the 2006 level. Air cargo leaving California consists of perishable commodities, electronics, and pharmaceuticals, among other items.
- The air cargo sector is sensitive to economic conditions. The last recession likely explains the large decline in air cargo volumes between 2006 and 2009.
Many Companies Operate Thousands of Miles of Freight Railroads in California
|
Freight Railroad Type |
Companies |
Route Mileage |
|
Class I |
2 |
5,418 |
|
Class II |
— |
— |
|
Class III |
27 |
1,317 |
|
Totals |
29 |
6,735 |
- A total of 6,735 miles of freight rail routes cross California, operated by 29 companies. This represents about 5 percent of the national freight rail system.
- In 2013, the state’s routes carried 160 million tons of goods.
- Two Class I freight rail companies—BNSF and Union Pacific—are responsible for the majority of the state’s freight rail routes. Both companies maintain national networks and operations.
- Class I railroads are those with operating revenues of $448 million or more. Class III railroads, also sometimes known as “short line” railroads, have operating revenues of $36 million or less.
Chapter 6
Funding
The funding structure for California’s transportation programs and infrastructure is somewhat complex. Funding comes from multiple levels of government (federal, state, and local), from various charges (such as fuel taxes and vehicle fees), and supports various purposes (such as highway maintenance, transit operations, motor vehicle regulation, and debt service on transportation bonds). State funds are distributed to various programs pursuant to several formulas set forth in state law. Further, the State Constitution contains restrictions on the use of certain transportation revenues. For example, the state generally must spend fuel excise tax revenues on highways, streets and roads, and mass transportation infrastructure.
In this chapter, we provide an overview of California’s transportation funding, including information on funding for motor vehicle regulation, traffic enforcement, highways, local streets and roads, transit, intercity and high‑speed rail, airports, and seaports.
State Vehicle Registration Fees Mainly Support DMV and CHP
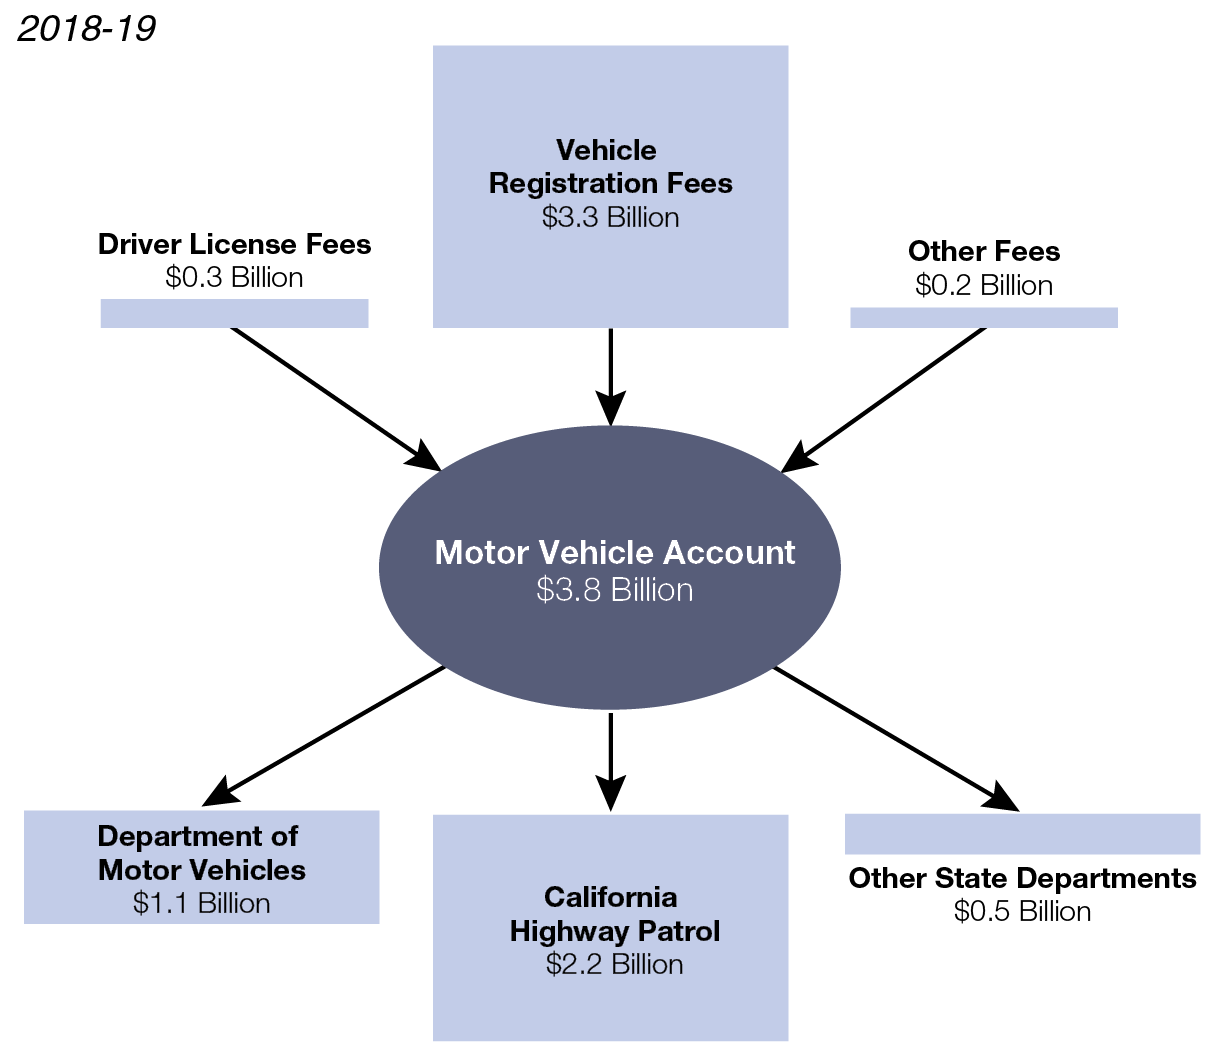
- In 2018‑19, funding in the Motor Vehicle Account for the regulation of motor vehicles (including the mitigation of environmental effects) and state highway traffic enforcement is estimated to total $3.8 billion.
- About 87 percent comes from vehicle registration fees, while driver license fees contribute another 8 percent.
- This funding primarily supports the operations of CHP and DMV. A small share goes to other state agencies, primarily for environmental protection programs to mitigate the effects of driving.
Funding for Highways, Roads, and Mass Transportation Comes From State, Local, and Federal Sources
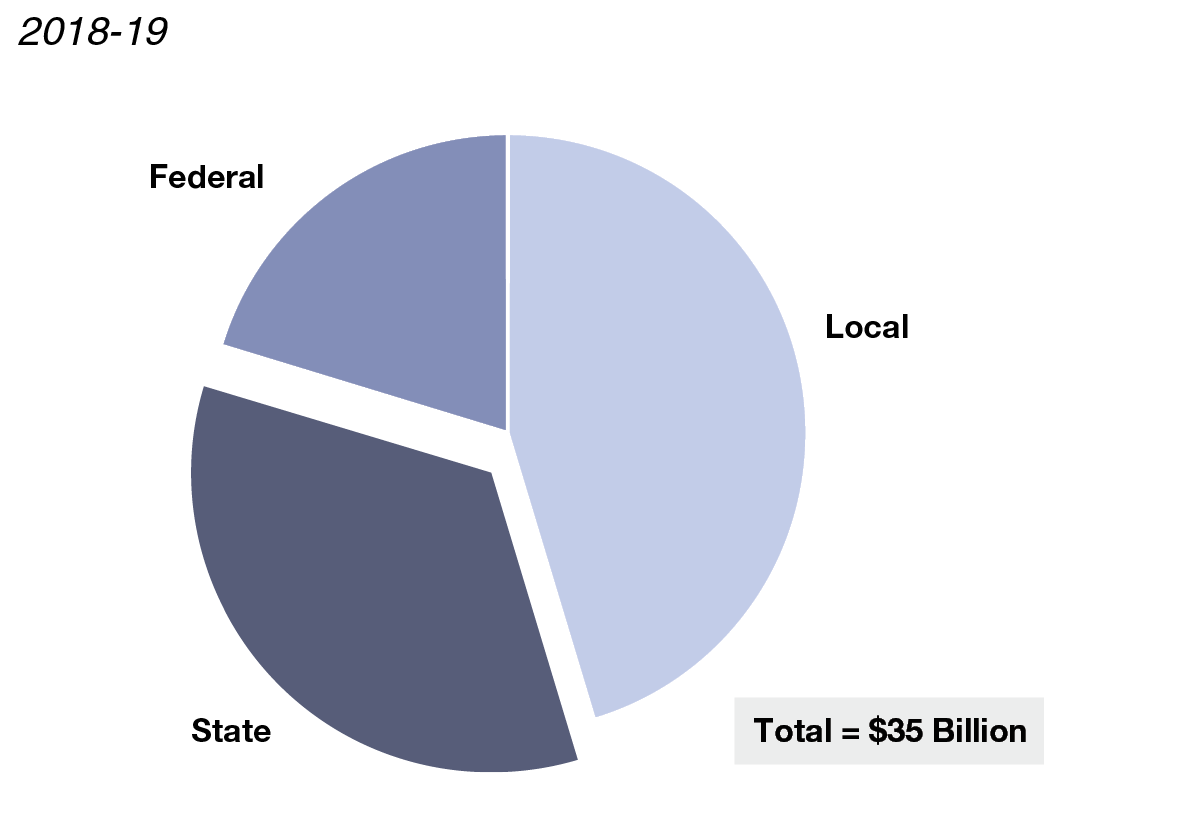
- In 2018‑19, funding for highways, streets and roads, and mass transportation (excluding airports and seaports) is estimated to total $35 billion.
- About one‑third comes from state sources, including fuel taxes and vehicle fees. Just under one‑half comes from local sources, such as county sales tax revenues, transit fare revenues, and city and county general funds. The remainder comes from the federal government.
- In April 2017, the state enacted Chapter 5 (SB 1, Beall) to increase state funding by raising various fuel taxes and vehicle fees. Due primarily to this measure, state funding is expected to increase from $6.6 billion in 2016‑17 to $12.1 billion in 2018‑19—an increase of over 80 percent.
State Funding for Highways, Roads, and Mass Transportation
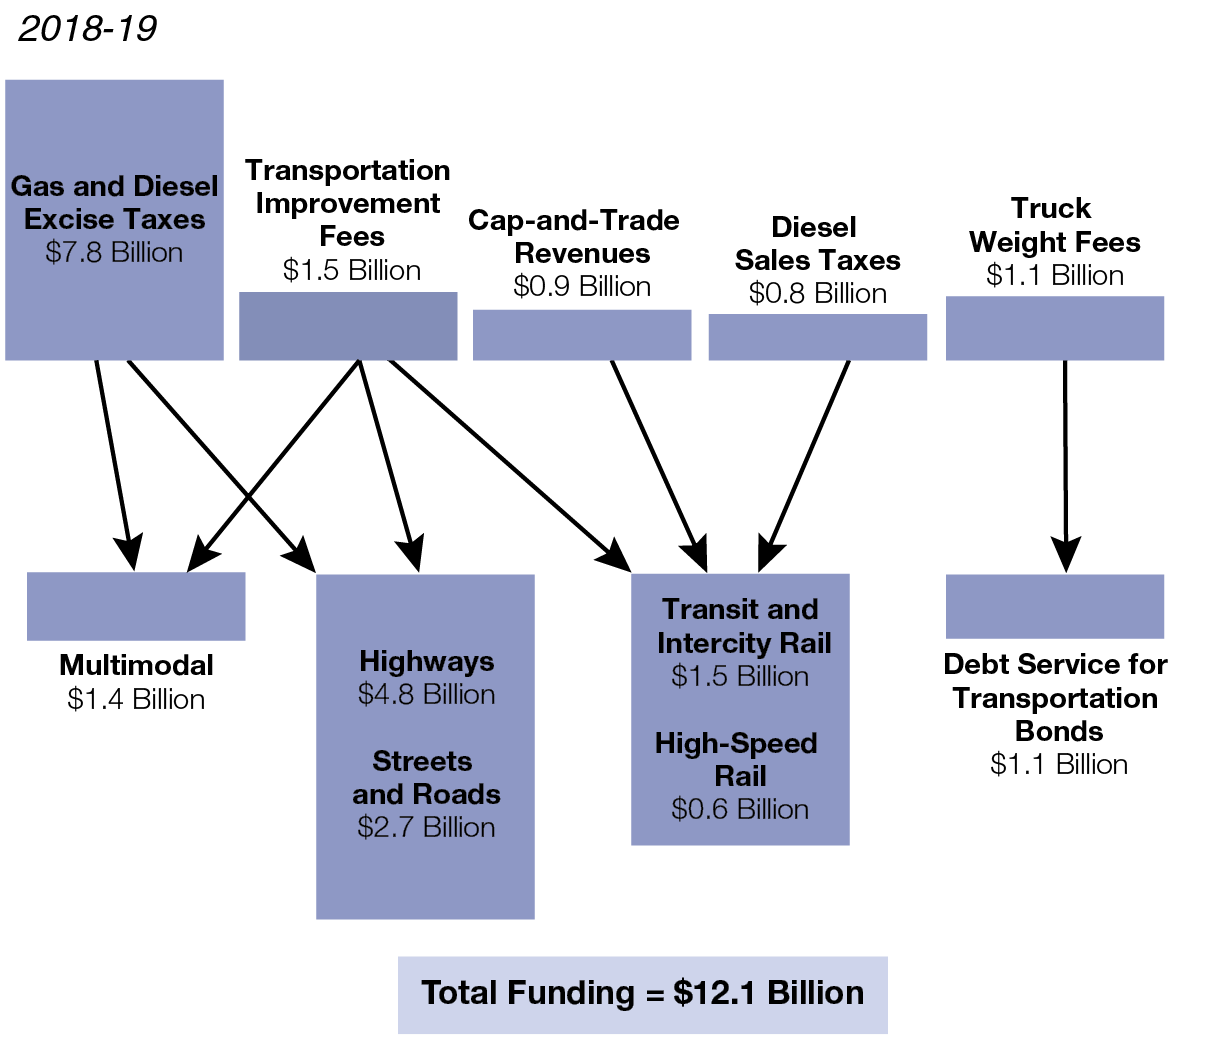
- Fuel excise taxes provide two‑thirds of state funding. In 2018‑19, the rates are assumed to be 46 cents and 36 cents per gallon, for gasoline and diesel respectively.
- Other sources include Transportation Improvement Fees (which range from $25 to $175, based on a vehicle’s value), cap and trade revenues (from permitting businesses to emit GHGs), diesel sales taxes (from part of the statewide sales tax and a 5.75 percent diesel‑specific tax), and truck weight fees (which range up to $2,064).
State‑Funded Transportation Programs
2018‑19 (In Billions)
|
Program |
Fundinga |
|
Highways and Roads |
|
|
Highway Maintenance Program and SHOPP |
$4.8 |
|
Local Streets and Roads |
2.7 |
|
Mass Transportation |
|
|
State Transit Assistance |
0.7 |
|
High‑Speed Rail |
0.6 |
|
Transit and Intercity Rail Capital Program |
0.5 |
|
Other |
0.3 |
|
Multimodal |
|
|
State Transportation Improvement Program |
0.5 |
|
Trade Corridor Enhancement Program |
0.3 |
|
Solutions for Congested Corridors |
0.3 |
|
Local Partnership Program |
0.2 |
|
Active Transportation Program |
0.1 |
|
Debt service on transportation bonds |
1.1 |
|
Total |
$12.1 |
|
aExcludes funding from bond proceeds and funding carried over from previous years. SHOPP = State Highway Operation and Protection Program. |
|
- State programs typically fund specific transportation projects in conjunction with federal and local programs. For instance, a highway project can receive funding from both the State Highway Operation and Protection Program and the Federal‑Aid Highway Program.
- Some programs can fund different types of transportation infrastructure (referred to as “multimodal”). For example, the Congested Corridors program could fund a transit project to reduce vehicles on the road, or a highway interchange project to smooth the flow of traffic.
Passenger Fares Provide Less Than Half of Transit Operating Revenues
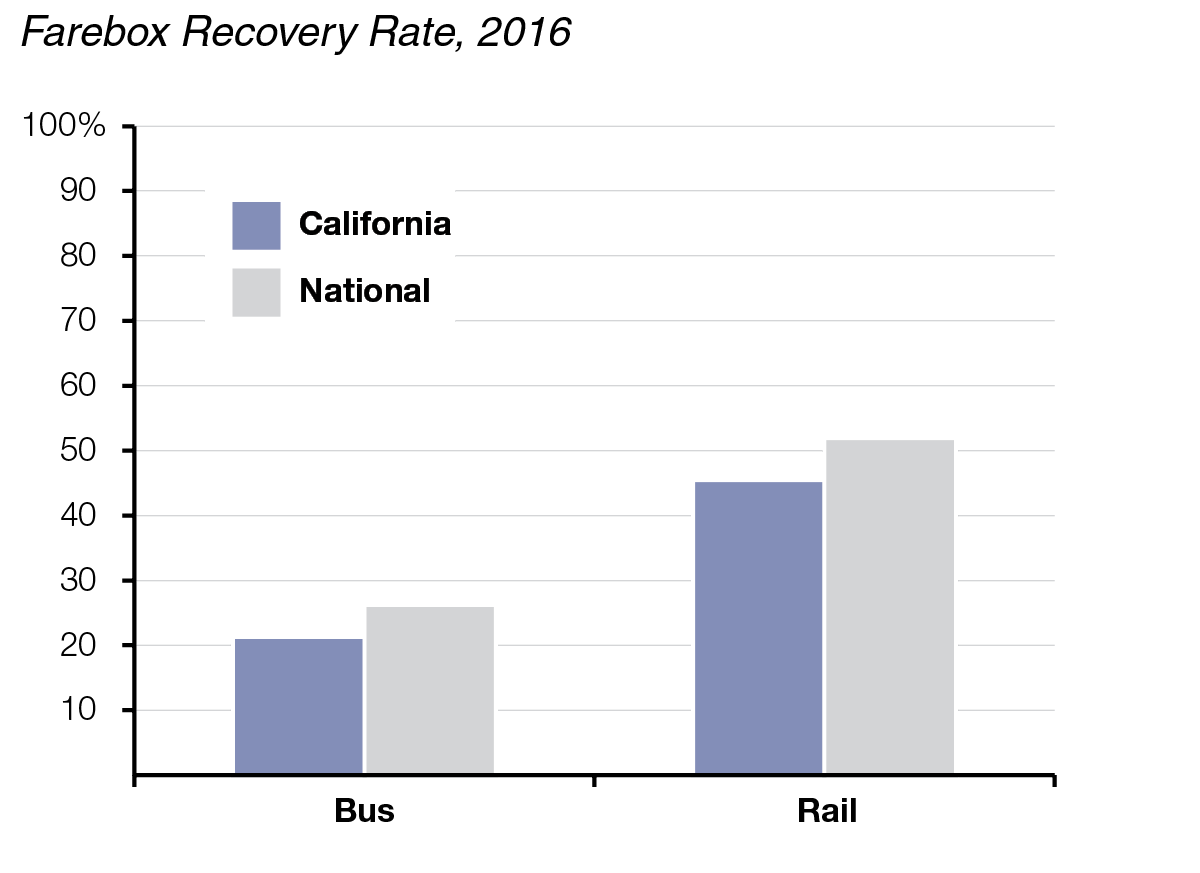
- For transit agencies, the farebox recovery rate shows the percent of operating revenues derived from passenger fares. (The other main revenue source for transit agencies is government subsidies.)
- For all California transit agencies combined, the rate is about 20 percent for buses and 45 percent for rail. These rates are similar to the national average but slightly lower.
- The statewide average rate masks variation across California’s transit agencies. For instance, the rate for buses varies from zero to 58 percent, while the rate for rail varies from 10 percent to 79 percent.
Airports and Seaports Generate $5 Billion in Revenues Annually
2017‑18 (In Billions)
|
Airports |
|
|
Aviation revenues |
$2.1 |
|
Non‑aviation revenues |
1.5 |
|
Subtotal |
($3.6) |
|
Seaports |
|
|
Maritime revenues |
$1.0 |
|
Non‑maritime revenues |
0.4 |
|
Subtotal |
($1.4) |
|
Total |
$5.0 |
- Airports and seaports generate operational revenues by charging for the use of their facilities. They typically do not receive government support for operating expenses (though government programs exist for infrastructure projects).
- The state’s 12 largest commercial airports (that account for 99 percent of passenger volume) together generate $3.6 billion in operating revenues annually. More than half comes from aviation fees (such as from leasing terminal space to airlines), while the remainder comes mainly from concessions (such as for parking and food).
- California’s 11 public seaports together generate $1.4 billion in operating revenues annually. Just under three quarters comes from shipping charges (such as on cargo or for docking). The remainder comes from various other sources, such as renting building space.
Appendix
The list below provides the data sources for each of the figures contained within this primer. Data sources citing a report title or data set are accessible online. Data sources citing only the name of a state department were requested from that department. In most cases, the figures reflect calculations made by our office.
Driving
Most Californians Have Driver Licenses: California Department of Motor Vehicles.
Most California Vehicles Are Cars and Use Gas or Diesel: California Department of Motor Vehicles.
State Highway System Much Smaller Than Network of Local Streets and Roads: California Department of Transportation, Public Road Data Report.
Most State Highways and Bridges Are in Good or Fair Condition: California Department of Transportation, Transportation Asset Management Plan.
Average California Driver Travels 35 Miles Per Day: California Department of Transportation, Public Road Data Report. Department of Motor Vehicles.
State Highway Congestion Increasing in Recent Years: California Department of Transportation.
Driving Fatalities Climbing in Recent Years After Sharp Decline: National Highway Traffic Safety Administration, Fatality Analysis Reporting System.
Driving Is the Largest Source of Greenhouse Gas Emissions in California: California Air Resources Board, California Greenhouse Gas Emission Inventory.
Fuel Use Per Driver Decreasing: California Department of Tax and Fee Administration, Taxable Gasoline and Diesel Gallons Ten‑Year Reports. California Department of Motor Vehicles.
Drivers on Average Pay About $750 Annually in Fuel Taxes and Vehicle Fees: California Department of Finance, 2018‑19 Governor’s Budget. California Department of Tax and Fee Administration, Taxable Gasoline and Diesel Gallons Ten‑Year Reports. U.S. Energy Information Administration, Weekly California All Grades Reformulated Retail Gasoline Prices and Weekly California No 2 Diesel Retail Prices. California Department of Motor Vehicles.
Mass Transportation
Largest Transit Systems Located in Major Urban Areas: Federal Transit Administration, National Transit Database.
Transit Ridership Has Declined in Recent Years: Federal Transit Administration, National Transit Database.
Most Transit Trips Occur on Buses: Federal Transit Administration, National Transit Database.
Large Share of Transit Assets Are in Need of Replacement: California Transportation Commission, California Mobility Investment Opportunities. U.S. Department of Transportation, 2015 Status of the Nation’s Highways, Bridges, and Transit: Conditions & Performance.
Transit Trips Pollute Less Than Driving Alone: Federal Transit Administration, National Transit Database. U.S. Environmental Protection Agency, Direct Emissions from Mobile Combustion Sources. U.S. Energy Information Administration, California Electricity Profile. Federal Highway Administration, Highway Statistics 2016.
Intercity Rail Ridership Growing: California Department of Transportation, Draft 2018 California State Rail Plan.
Air Travel Within California Rising: U.S. Bureau of Transportation Statistics, T‑100 Domestic Segment (All Carriers).
Active Transportation
Californians Walk More Than the National Average: Oak Ridge National Laboratory, National Household Travel Survey.
Pedestrian and Cyclist Fatality Rates Increasing in Recent Years: California Highway Patrol, Statewide Integrated Traffic Records System. California Department of Finance, E‑7: California Population Estimates, with Components of Change and Crude Rates, July 1, 1900‑2016.
Freight movement
More Imports Enter the U.S. Through California Than Any Other State: U.S. Census Bureau and U.S. Bureau of Economic Analysis, U.S. International Trade in Goods and Services.
Most Domestic Freight Shipped Out of California on Trucks: U.S. Census Bureau, Commodity Flow Survey.
Air Cargo Volumes at California Airports Increasing After Sharp Decline: California Department of Transportation.
Many Companies Operate Thousands of Miles of Freight Railroads in California: California Department of Transportation, Draft 2018 California State Rail Plan.
Funding
State Vehicle Registration Fees Mainly Support DMV and CHP: California Department of Finance, 2018‑19 Governor’s Budget.
Funding for Highways, Roads, and Mass Transportation Comes From State, Local, and Federal Sources: California Department of Finance, 2018‑19 Governor’s Budget. Federal Transit Administration, Allocations for Formula and Discretionary Grant Programs by State. California Air Resources Board, Greenhouse Gas Reduction Fund Appropriation by Fiscal Year and Summary of Proceeds to California and Consigning Entities. California State Controller’s Office, Transit Operators Financial Data, Transportation Planning Agencies Financial Data, and Streets and Roads Annual Report. California Department of Tax and Fee Administration.
State Funding for Highways, Roads, and Mass Transportation: California Department of Finance, 2018‑19 Governor’s Budget.
State‑Funded Transportation Programs: California Department of Finance, 2018‑19 Governor’s Budget.
Passenger Fares Provide Less Than Half of Transit Operating Revenues: Federal Transit Administration, National Transit Database.
Airports and Seaports Generate $5 Billion in Revenues Annually: Annual financial reports and annual budget documents of each port.