LAO Contact

November 26, 2018
Taxation of Sugary Drinks
- Introduction
- Background
- Why Tax Sugary Drinks?
- Defining the Tax Base
- Choosing the Type of Tax
- Setting the Tax Rate
- Allocating the Revenue
- Conclusion
- Appendix: The Effects of Sugary Drink Taxes
Executive Summary
Sugary Drink Taxes. Excise taxes on sugary drinks have become increasingly common in recent years. In June 2018, the Legislature passed a law prohibiting local governments from levying such taxes. The Legislature may now face two decisions:
- Should the state levy an excise tax on sugary drinks?
- If so, how should the tax be designed?
This report provides information and perspectives for the Legislature to consider as it weighs these choices.
Why Tax Sugary Drinks?
Sugary Drink Taxes Have Two Purposes. Sugary drink tax proponents tend to emphasize two goals: a fiscal goal of raising revenue and a policy goal of improving health.
- Fiscal Purpose: Revenue. Sugary drink taxes are one of many options available to policymakers who want to raise revenue. However, sugary drink taxes—and excise taxes more generally—are not an ideal way to achieve this fiscal goal. Excise taxes impose undue burdens on narrowly defined groups. Additionally, such taxes—and narrowly targeted tax policies more generally—make businesses’ success less dependent on marketplace competition and more dependent on political competition.
- Policy Purpose: Health. A statewide sugary drink tax likely would reduce sugary drink consumption, potentially leading to improvements in health—such as reduced rates of heart disease and diabetes. However, consumer responses to a sugary drink tax would be complex, so the net health effects of such a tax are uncertain.
Key Design Decisions
Defining the Tax Base. Many recent sugary drink tax proposals exclude artificially sweetened “diet” drinks, dairy‑based drinks, and 100 percent juice. The juice exclusion illustrates a key trade‑off. On one hand, policymakers could take a relatively aggressive approach by taxing a broad range of sugary drinks, maximizing potential health benefits. On the other hand, policymakers could take a relatively cautious approach by limiting the tax to drinks—such as soda—that provide no beneficial nutrients.
Choosing the Type of Tax. A sugary drink tax can be based on the volume of the drink (for example, 2 cents per ounce) or on the amount of sugar in the drink (for example, 3 cents per teaspoon of sugar). A third alternative is a tiered tax that combines aspects of the other two (for example, 1 or 2 cents per ounce, depending on the amount of sugar). Volume‑based taxes are simplest, but sugar‑based taxes align more closely with the health goals of the policy.
Setting an Initial Tax Rate. A statewide sugary drink tax would reduce sugary drink consumption. For example, a 2 cent per ounce tax likely would reduce consumption by 15 percent to 35 percent. This effect on consumption is central to the policy purpose of the tax, but it affects the fiscal outcome as well.
Adjusting the Tax Rate Over Time. As time passes, inflation reduces the effectiveness of taxes whose rates are defined as fixed amounts of money (such as 2 cents per ounce). Indexing the rate to inflation can help maintain the fiscal and policy effectiveness of the tax over time.
Allocating the Revenue. Allocating sugary drink tax revenues—and tax revenues more generally—to special funds is not a good budgetary practice. Doing so:
- Constrains the Legislature’s budgetary choices.
- Exacerbates the conflict between the tax’s fiscal goals and policy goals.
Moreover, revenues from specific taxes can diverge from the costs of specific programs over time, making ongoing commitments problematic.
Introduction
Taxes on sugary drinks have become increasingly common in recent years. In June 2018, the Legislature passed a law (Chapter 61 of 2018 [AB 1838, Committee on Budget]) prohibiting local governments from levying such taxes (and other taxes on groceries) through 2030. The law stated the Legislature’s intent to regulate the imposition and collection of such taxes to the exclusion of local action. As such, the Legislature may face the following decisions:
- Should the state levy an excise tax on sugary drinks?
- If so, how should the tax be designed?
This report provides information and perspectives for the Legislature to consider as it weighs these choices.
Background
State and Federal Governments Levy Excise Taxes. Unlike broad‑based taxes—such as income, property, and sales taxes—excise taxes apply to narrow categories of goods. Figure 1 lists examples of goods that are subject to state and federal excise taxes in California. For example, the federal government and the state of California both levy excise taxes on alcoholic beverages. Currently, however, they do not levy excise taxes on sugary drinks. (In this report, we use the term “sugary drinks” to refer to drinks containing added sugar, such as soda, energy drinks, and fruit drinks. As such, the term excludes many other drinks—such as milk—that contain naturally occurring sugars.)
Figure 1
Notable California Excise Taxes
|
Tax Base |
State Rate |
Federal Rate |
Representative Retail Price (Including Taxes) |
|
Gasoline |
$0.42 per gallon |
$0.18 per gallon |
$3.50 per gallon |
|
Diesel |
$0.36 per gallon |
$0.24 per gallon |
$3.80 per gallon |
|
Cigarettes |
$2.87 per pack |
$1.01 per pack |
$8.00 per pack |
|
Other tobacco products (cigars, chewing tobacco, etc.) |
63% of wholesale price |
Varies across products |
Varies across products |
|
Beer |
0.2 cent per ounce |
0.1 to 0.5 cent per ounce |
10 cents per ounce |
|
Wine |
0.2 cent per ounce |
0.1 to 2.7 cents per ounce |
40 cents per ounce |
|
Distilled Spirits |
2.6 cents per ounce |
0.7 to 13.4 cents per ounce |
50 cents per ounce |
|
Cannabisa |
$9.25 per ounce of flowers, $2.75 per ounce of leaves, and 15 percent of retail price of final product |
— |
$300 per ounce of flowers |
|
aLocal taxes also apply. |
|||
Excise Taxes on Nonalcoholic Drinks
Many Jurisdictions Have Levied Excise Taxes on Nonalcoholic Drinks. Four California cities levy excise taxes on sugary drinks. As shown in Figure 2, Berkeley has levied such a tax since 2015, while Albany, Oakland, and San Francisco have done so since 2017. (The recent ban on local grocery taxes left these four in place). Additionally, the state Legislature and the cities of El Monte and Richmond have considered sugary drink tax proposals but have not adopted them. Outside of California, a variety of local, state, and national governments have levied excise taxes on nonalcoholic drinks. Most of these policies have been in place for less than a decade.
Figure 2
Some Notable Nonalcoholic Drink Tax Proposals
|
Jurisdiction |
Tax |
Applies Only to Sugary Drinks? |
Status as of |
Year Tax Went Into Effect |
|
California |
||||
|
Berkeley |
1 cent/oz of drink volume |
Yes |
In effect |
2015 |
|
Albany |
1 cent/oz of drink volume |
Yes |
In effect |
2017 |
|
Oakland |
1 cent/oz of drink volume |
Yes |
In effect |
2017 |
|
San Francisco |
1 cent/oz of drink volume |
Yes |
In effect |
2017 |
|
El Monte |
1 cent/oz of drink volume |
Yes |
Did not pass (2012 ballot measure) |
— |
|
Richmond |
1 cent/oz of drink volume |
Yes |
Did not pass (2012 ballot measure) |
— |
|
California |
1 cent/tsp of sugar |
Yes |
Did not pass (2009‑10 Legislative Session) |
— |
|
California |
1 cent/oz of drink volume |
Yes |
Did not pass (2013‑14 Legislative Session) |
— |
|
California |
2 cents/oz of drink volume |
Yes |
Did not pass (2017‑18 Legislative Session) |
— |
|
California |
2 cents/oz of drink volume |
Yes |
Collecting signatures (Initiative) |
— |
|
Other States in U.S. |
||||
|
West Virginia |
0.1 cent/oz of drink volume |
No |
In effect |
1951 |
|
Arkansas |
0.2 cent/oz of drink volume |
No |
In effect |
1993 |
|
Washington |
0.2 cent/oz of drink volume |
No |
Repealed in 2010 |
2010 |
|
Other Local Governments in U.S. |
||||
|
Boulder, CO |
2 cents/oz of drink volume |
Yes |
In effect |
2017 |
|
Philadelphia, PA |
1.5 cents/oz of drink volume |
No |
In effect |
2017 |
|
Seattle, WA |
1.75 cents/oz of drink volume |
Yes |
In effect |
2018 |
|
Cook County, IL |
1 cent/oz of drink volume |
No |
Repealed in 2017 |
2017 |
|
Outside of U.S.a |
||||
|
Norway |
0.5 to 1.4 cent/oz of drink volume |
No |
In effect |
1924 |
|
France |
0.3 to 0.7 cent/oz of drink volume, depending on amount of sweetener |
No |
In effect |
2012 |
|
Chile |
8 percentage‑point difference in value‑added tax rate between higher‑sugar and lower‑sugar drinks |
Yes |
In effect |
2014 |
|
Mexico |
0.3 cent/oz of drink volume |
Yes |
In effect |
2014 |
|
Bahrain, Saudi Arabia, and the United Arab Emirates |
50 to 100 percent of retail price |
No |
In effect |
2017 |
|
Catalonia |
0.4 to 0.5 cent/oz of drink volume, depending on amount of sugar |
Yes |
In effect |
2017 |
|
Philippines |
0.3 to 0.7 cent/oz of drink volume, depending on type of sweetener |
No |
In effect |
2018 |
|
South Africa |
1.4 cent/tsp of sugar (except the first tsp per 3.4 oz) |
Yes |
In effect |
2018 |
|
Sri Lanka |
0.1 cent/tsp of sugar |
Yes |
In effect |
2018 |
|
United Kingdom and Ireland |
0.75 to 1 cent/oz of drink volume, depending on amount of sugar |
Yes |
In effect |
2018 |
|
Denmark |
0.7 cent/oz of drink volume |
No |
Repealed in 2014 |
1934 |
|
aForeign tax rates converted to U.S. dollars based on purchasing power parity. |
||||
Many Drink Taxes Not Limited to Sugary Drinks. The state and local nonalcoholic drink taxes proposed in California have applied only to sugary drinks. Outside of California, however, many excise taxes apply to broader categories of nonalcoholic drinks. Philadelphia’s tax, for example, applies both to sugary drinks and to artificially sweetened drinks, such as “diet” soda.
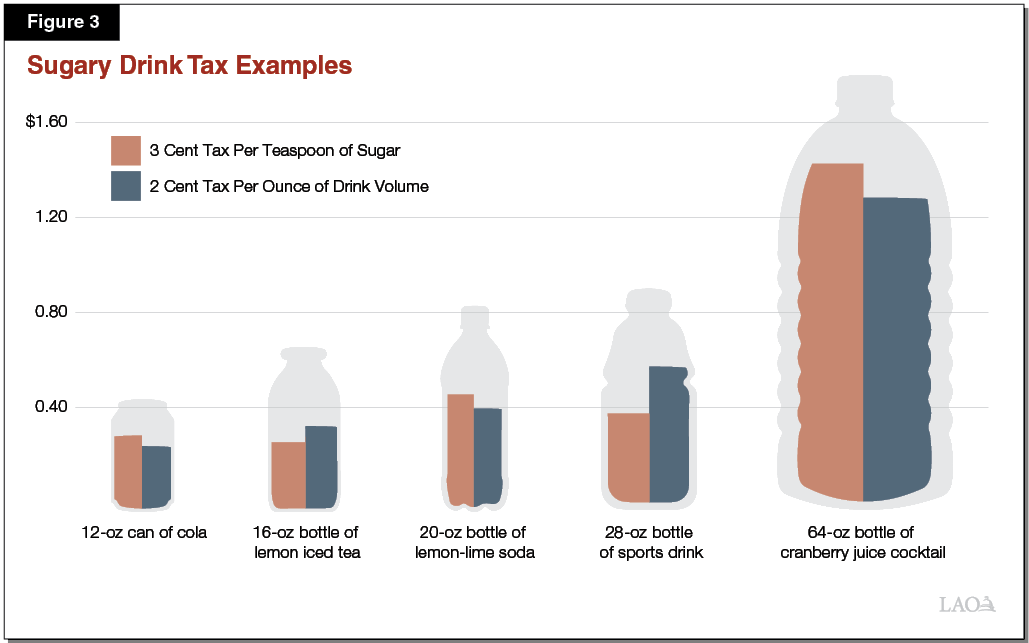
Sugary Drink Tax Examples. Figure 3 illustrates how two hypothetical sugary drink taxes would apply to five types of drinks. The first tax is based on drink volume: two cents per fluid ounce. This tax ranges from $0.24 on a 12‑ounce can of cola to $1.28 on a 64‑ounce bottle of cranberry juice cocktail. The second tax is based on sugar content: 3 cents per teaspoon of sugar. Compared to the first policy, the second one levies a larger tax on the sodas and the cranberry juice cocktail—which contain relatively large amounts of sugar—and a smaller tax on the lemon iced tea and the sports drink, which contain more moderate amounts of sugar.
Sales Taxes on Nonalcoholic Drinks
State and Local Governments Levy Sales Tax on Many Goods. The sales and use tax (hereafter, sales tax) applies to retail sales of tangible goods. The rate varies across the state, ranging from 7.25 percent to 10.25 percent, with a statewide average of 8.5 percent.
State Constitution Exempts “Food Products” From Sales Tax. The state has developed a complex system of rules for determining whether a particular food or drink qualifies for the food products exemption. These rules classify many—but not all—drinks as exempt food products. For example, juice, milk, and bottled water are considered food products and therefore exempt from sales tax. As shown in the first column of Figure 4, however, almost all carbonated drinks—including sugary soda, diet soda, and unsweetened sparkling water—are not considered food products and therefore are subject to sales tax.
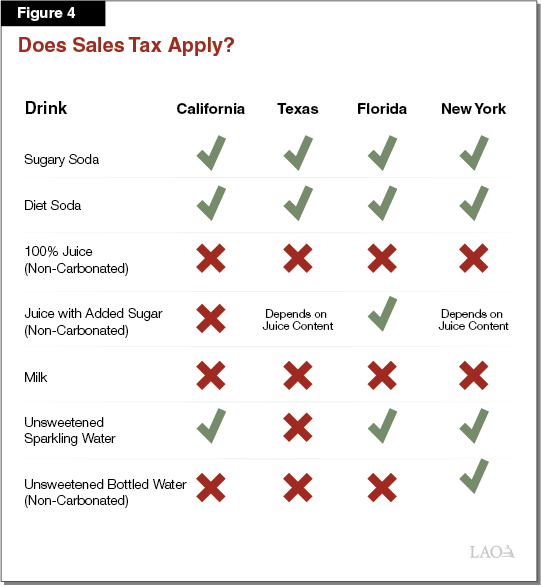
Sales Taxes on Drinks in Other States. Like California, other states levy sales taxes on many drinks. As shown in Figure 4, the four most populous states all apply sales tax to sugary soda and to diet soda but exempt milk and 100 percent juice. Sales taxation of some other drinks, however, varies across these states. For example, all four have different rules regarding fruit drinks that contain added sugar. Texas is the only one of the four that exempts sparkling water from its sales tax, while New York is the only one of the four that applies its sales tax to non‑carbonated bottled water.
Why Tax Sugary Drinks?
Sugary drink tax proponents tend to emphasize two goals: a fiscal goal of raising revenue and a policy goal of improving health.
Fiscal Purpose: Revenue
A sugary drink tax is one of many options available to policymakers who want to raise revenue. Other options include:
- Raising Rates of Existing Taxes. For example, Proposition 30 (2012) raised state revenue by increasing income tax and sales tax rates.
- Expanding the Base of Existing Taxes. For example, some policymakers have proposed expanding the sales tax base to include services.
- Reducing “Tax Expenditures.” Tax expenditures are exceptions to the basic tax structure that apply to certain types of taxpayers or transactions. As described above, for example, California exempts food products from the sales tax.
Excise Taxes Not an Ideal Way to Raise Revenue. As fiscal tools, excise taxes have several shortcomings, including:
- Undue Burdens. The cost of funding basic government services is generally borne by the entire public—based on broad measures such as income and wealth. An excise tax, on the other hand, is borne by a narrowly defined group of businesses or consumers. As such, the tax burden can be disproportionately borne. For instance, excise taxes are usually regressive, meaning lower‑income people tend to spend a higher share of their incomes on the tax than higher‑income people.
- Political Competition. Narrowly targeted tax policies make businesses’ success less dependent on competition in the marketplace and more dependent on competition for favorable policy treatment.
Policy Purpose: Health
A statewide sugary drink tax likely would reduce sugary drink consumption, potentially leading to improvements in health.
Heart Disease and Diabetes Kill Many Californians. Heart disease was California’s leading cause of death in 2016, accounting for 23 percent of the state’s deaths. Diabetes was the seventh most common cause of death at 3.5 percent. These diseases have adverse effects not only on life expectancy, but also on quality of life. Many behavioral and genetic factors contribute to these diseases.
Sugary Drink Tax Potentially Could Improve Health. Sugary drink consumption can contribute to heart disease and diabetes in multiple ways. For example, consumption of these drinks can lead to excess caloric intake. Additionally, some research suggests that the links between sugary drinks and chronic disease might not be limited to their caloric content. In particular, sugary drinks enable rapid consumption of large amounts of sugar, and they do not contain other nutrients—such as fat, protein, or fiber—that can help the body process sugar. As a result, these drinks could contribute to diabetes to a greater extent than would be suggested by their caloric content alone. (A full assessment of this body of research falls outside of the scope of our expertise.) As discussed later in this report, however, consumer responses to a sugary drink tax could be complex, so the net health effects of such a tax are uncertain.
Purpose of Tax Should Guide Its Design
Design Choices Should Reflect Rationale for Tax. Policymakers considering sugary drink taxes face several major design choices:
- What types of drinks should be included in the tax base?
- Should the tax be based on the volume of the drink, the amount of sugar, or something else?
- What should the tax rate be?
- How should the revenue be used?
As discussed later in this report, the answers to these questions can depend on whether the main purpose of the tax is to raise revenue or to improve health.
Consider Administrative Burden. In addition to the fiscal goal of raising revenue and the policy goal of improving health, the design choices listed above hinge on a third factor: the administrative burden imposed by the tax. To account for this factor, policymakers should ask two questions of any tax proposal:
- Can tax administrators and taxpayers implement the tax successfully? (For simplicity, we use the term “taxpayers” to refer to businesses that would register and remit the tax. As discussed below, however, consumers would pay much of the tax indirectly through price increases.)
- How difficult is it for taxpayers to comply with the tax?
Continue Monitoring Evidence Regarding Efficacy. If the Legislature enacts a sugary drink tax, it should continue to evaluate the tax and make adjustments as necessary. This evaluation should monitor evidence not only from California, but also from other states and countries. Ideally, the evaluation would focus on the ultimate goals of these policies—such as improvements in health. In practice, however, estimating the effects of the taxes on those ultimate goals could be very difficult. Accordingly, monitoring some intermediate outcomes—such as consumption of sugary drinks—could be useful as well.
Defining the Tax Base
Should the Tax Base Include Food? An excise tax designed to reduce heart disease and diabetes need not be limited to sugary drinks. It also could apply to foods that contribute to those diseases. In principle, broadening the base in this way could help the tax achieve both its health goals and its fiscal goals more effectively. In practice, however, designing, administering, and complying with such a tax could be difficult at the state or local level for a couple of reasons:
- The distinctions between taxed and untaxed foods could be subtle and hard to track.
- Such a tax would apply to a much larger set of taxpayers with a much wider variety of products, business models, and industry structures.
Common Features of Recent Proposals. Many recent sugary drink tax proposals—including local ordinances enacted in Boulder, Seattle, and four California cities, and recent bills introduced in the Legislature—define their tax bases similarly. In particular, their bases do not include artificially sweetened drinks, dairy‑based drinks, or 100 percent juice.
Below, we discuss the merits of each of these choices.
Key Decisions Regarding the Tax Base
Should the Tax Apply to Artificially Sweetened Drinks? As shown in Figure 2, some soft drink taxes apply only to sugary drinks, while others apply to artificially sweetened drinks as well. If the primary goal of an excise tax is to improve health, then the decision to omit artificially sweetened drinks should depend on an assessment of the health effects of consuming those drinks. If sugary drinks present much greater health concerns than artificially sweetened drinks, then a health‑focused tax should apply only to sugary drinks and not to any others.
Should the Tax Exempt Milk? Most sugary drink taxes do not apply to dairy‑based drinks despite their significant sugar content (including naturally occurring sugars). If the main goal of the tax is to raise revenue, then this narrowing of the base clearly is counterproductive. If, however, the main goal of the tax is health‑related, then the decision to exclude dairy from the base is more nuanced. Although most dairy‑based drinks contain sugar, they also contain fat and protein. If, as some researchers argue, sugary drinks contribute to diabetes primarily because they lack these nutrients, it is reasonable to exclude dairy from these taxes. Furthermore, some types of dairy products—such as yogurt‑based or cream‑based products—can blur the line between drinks and food, which could make administration and compliance more difficult.
Should the Tax Exempt Juice? Sugary drink tax bases typically exclude 100 percent juice but include other fruit drinks. Excluding 100 percent juice reduces revenue, just as excluding dairy does. However, the nutritional case for excluding 100 percent juice appears to be much weaker than the case for excluding dairy. Some types of 100 percent juice contain protein or fiber, but many others do not. Many types of 100 percent juice contain vitamins and minerals, but so do many sugary fruit drinks and energy drinks. Accordingly, the American Academy of Pediatrics has recommended limiting children’s intake of juice.
Key Trade‑Off: Main Policy Goal vs. Other Health Effects. The potential exclusion of 100 percent juice illustrates a general trade‑off in the design of sugary drink taxes. Some sugary drinks contain beneficial nutrients. At one end of the spectrum, policymakers could take a relatively aggressive approach by applying the tax to as many sugary drinks as possible. This approach likely would lead to the greatest reduction in sugary drink consumption, maximizing potential reductions in the key diseases of interest—heart disease and diabetes. However, this approach also could reduce intake of some beneficial nutrients, such as vitamins. At the other end of the spectrum, policymakers could take a relatively cautious approach by limiting the tax to sugary drinks—such as soda—that provide no beneficial nutrients. This approach likely would have weaker effects on sugary drink consumption, but it also would be less likely to reduce intake of vitamins and other nutrients.
Choosing the Type of Tax
Different Types of Sugary Drink Taxes
Volume‑Based Tax. Under a volume‑based tax, the amount of tax owed depends only on the volume of the taxed drink. As shown in Figure 3, for example, a one cent per ounce tax results in a tax of $0.12 on a can of cola and $0.64 on a large bottle of cranberry juice cocktail. For a given container size, this type of tax treats all sugary drinks equally, regardless of their sugar content or other characteristics. This is the most common type of excise tax levied on sugary drinks.
Sugar‑Based Tax. Sugar‑based taxes have rates that vary depending on the amount of sugar that drinks contain. In the 2009‑10 session, for example, the Legislature considered two bills that would have levied a tax of one cent per teaspoon of sugar in each drink. Compared to a volume‑based tax, a sugar‑based tax would lead to higher taxes on drinks with more sugar and lower taxes on drinks with less sugar. As shown in Figure 3, for example, a sugar‑based tax would result in somewhat higher taxes on many sodas and fruit drinks, and somewhat lower taxes on many sweetened teas and sports drinks.
Tiered Tax. Many volume‑based taxes exempt drinks with small amounts of sugar. Berkeley’s tax, for example, does not apply to drinks that contain less than two calories per ounce. (Very few sugary drinks fall below this threshold.) As a result, these taxes effectively separate sugary drinks into two categories, or tiers, based on sugar content. Some other jurisdictions—such as the United Kingdom (U.K.) and Catalonia—have taxes that extend this concept with more than two tiers. The U.K. tax, for example, has three tiers: a zero rate for drinks with less than three‑eighths of a teaspoon of sugar per ounce; a middle rate (roughly equivalent to 0.8 cent per ounce U.S.) for drinks with three‑eighths to three‑fifths of a teaspoon; and a higher rate (roughly equivalent to 1 cent per ounce U.S.) for drinks with more than three‑fifths of a teaspoon. (For example, many sweetened teas are in the middle tier, while most sodas are in the highest tier.)
Trade‑Offs Among Types
Volume‑Based Tax Simplest. The simpler a tax, the easier it is for taxpayers and tax administrators to implement. Volume‑based taxes are the simplest sugary drink taxes, as they depend only on information that is commonly tracked and relatively easy to verify. Sugar‑based or tiered taxes are more complex, as they require taxpayers and tax administrators to track drinks’ sugar content. This information already appears on federally mandated nutrition labels, so a sugar‑based or tiered tax likely would be feasible at the state level. Local governments have less tax administration capacity than the state, so their ability to administer such a tax is less clear.
Sugar‑Based Tax Likely Most Effective for Health. Volume‑based taxes discourage production and consumption of all sugary drinks similarly. In contrast, a sugar‑based tax would discourage production and consumption proportionally to the amount of sugar in the drink. As a result, we would expect a sugar‑based tax to reduce liquid sugar consumption to a greater degree than a volume‑based tax. Furthermore, sugar‑based taxes give drink manufacturers an incentive to reduce the sugar content of their drinks—an incentive that volume‑based taxes do not provide. Tiered taxes provide this incentive to some degree, but much more weakly than sugar‑based taxes. Given the central role of sugar content in the health rationale for these taxes, we would expect sugar‑based taxes to be more effective for achieving health goals than volume‑based or tiered taxes.
All Types Could Raise Similar Amounts of Revenue. The choice among volume‑based, sugar‑based, and tiered taxes affects the relative tax rates on different types of sugary drinks. However, the rates of any of these taxes could be set to raise a given amount of revenue, so this choice has little bearing on the tax’s fiscal effectiveness.
Setting the Tax Rate
Setting Rate to Achieve a Policy Goal
Statewide Tax Would Reduce Sugary Drink Consumption. Based on our review of available evidence (discussed in the Appendix), we would expect a statewide sugary drink tax to lead to higher prices for the taxed drinks and lower consumption of those drinks. The Legislature can set the tax rate based on the reduction in sugary drink consumption that it wants to achieve. For example, a two cent per ounce tax likely would reduce consumption by 15 percent to 35 percent.
Complex Relationship Between Tax and Potential Health Improvements. The tax would affect health due to the drop in aggregate sugary drink consumption described above. The net effects of the tax on health would depend not only on that drop in consumption, but also on:
- How the reductions in consumption are distributed among people who face different health risks. In particular, the health effects of the tax would depend disproportionately on the responses of people who face a relatively high risk of heart disease and diabetes.
- Other consumer responses, such as changes in consumption of other foods and drinks. If, for example, consumers respond by consuming more candy or beer, the net health benefits of the tax could be minimal. If, on the other hand, consumers respond to the tax by eating more vegetables, the tax could lead to larger health improvements than those resulting from the drop in sugary drink consumption alone.
Setting Rate to Achieve a Revenue Goal
Revenue Depends on Initial Size of Base . . . At a basic level, the amount of revenue produced by a given tax is equal to the tax rate times the size of the tax base. Based on this relationship, policymakers can set the tax rate to raise the desired amount of revenue. A complication arises, however, due to the consumer response described earlier. Due to that response, the size of the tax base depends, in turn, on the tax rate.
. . . And Magnitude of Consumer Response. As noted above, we estimate that a two cent per ounce statewide sugary drink tax likely would reduce the size of the tax base by 15 percent to 35 percent. A lower rate would lead to a proportionally smaller reduction in the tax base, while a higher rate would lead to a proportionally larger reduction in the tax base.
Adjusting Rate Over Time
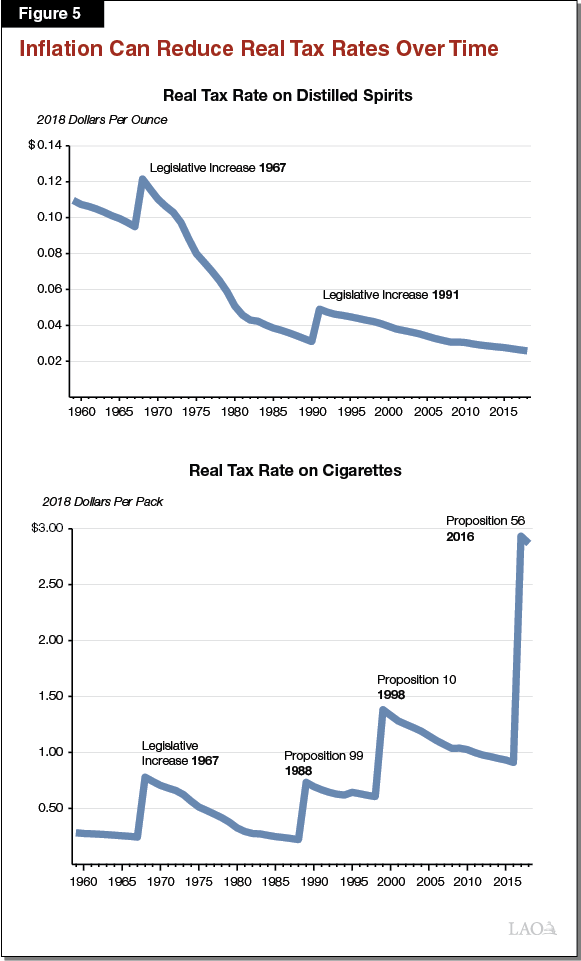
Inflation Can Reduce Real Tax Rates Over Time. Prices tend to rise over time. Due to this inflation, the real value of any fixed amount of money—such as a tax rate defined as a specific number of cents per ounce—diminishes over time. As shown in Figure 5, for example, California’s real tax rate on distilled spirits has declined gradually due to inflation. This gradual decline has more than offset the modest one‑time rate increases enacted by the Legislature in 1968 and 1991. In the case of cigarettes, however, several large one‑time rate increases have more than offset the gradual decline resulting from inflation, so the real rate has risen over time.
Inflation Indexing Helps Achieve Fiscal Goals . . . Due to inflation, sugary drink taxes that are fixed in dollar terms will raise declining amounts of real revenue over time. Instead of keeping excise tax rates fixed in dollar terms, policymakers could index them to inflation—automatically keeping their real value constant over time. For example, an inflation‑indexed tax on sugary drinks would raise an amount of real revenue per ounce that is constant over time, instead of one that diminishes over time. (In either case, total revenue would depend not only on revenue per ounce, but on the total number of ounces consumed.)
. . . And Policy Goals. Inflation gradually erodes fixed‑rate taxes not only from a fiscal standpoint, but also from a policy standpoint. As the real value of the tax gets smaller, the incentives it provides—and hence its effects on consumers’ behavior—become weaker. In contrast, the incentives provided by an inflation‑indexed tax are unlikely to decline over time.
Multiple Indices Available. Inflation measurement is not straightforward. Many economists have raised concerns that the most commonly used measures of inflation—Consumer Price Indices—tend to overstate increases in the cost of living. Some alternative measures of inflation—known as chained indices—likely overstate inflation to a lesser degree. However, chained indices are not available at the state level. Furthermore, some key prices in California—such as housing prices—historically have risen faster than the national average, so nationwide indices may well understate inflation in California.
Allocating the Revenue
Tax Revenues Are Typically Available for General Fund Purposes. Historically, the Legislature has placed almost all tax revenue in the General Fund. This has also been the case for most excise taxes (except for fuel taxes). For instance, the Legislature has placed revenues from the excise taxes on cigarettes and alcoholic beverages into the General Fund. In recent decades, however, ballot measures have allocated increases in excise tax revenue—such as tobacco tax increases and new taxes on cannabis—to special funds designated for specific purposes. In our view, this is not a good budgetary practice, as it constrains the Legislature in its annual budgetary choices. In addition, the revenues from an excise tax can diverge from the costs of a specific program over time. Below, we elaborate on these concerns.
Legislature’s Priorities Tend to Change Over Time. If the current Legislature sets aside revenue for specific programs, then it will be more difficult for future Legislatures to make choices that are consistent with their own priorities. This is because:
- Future Legislatures could assess the value of alternative programs very differently. For example, a future Legislature might feel that additional spending on child care was preferred over whatever program had been specified to receive the excise tax funds.
- Future Legislatures could face circumstances that the current Legislature does not anticipate. In a budget crisis, for example, the current Legislature might want the future Legislature to use the excise tax revenue to lessen cuts to existing programs supported by the General Fund rather than go for expanded services to the program specified for the excise tax revenues.
Excise Tax Revenue and Program Costs Often Diverge Over Time. When policymakers link a program’s budget to revenue from a specific tax, the resulting funding often diverges from program costs over time.
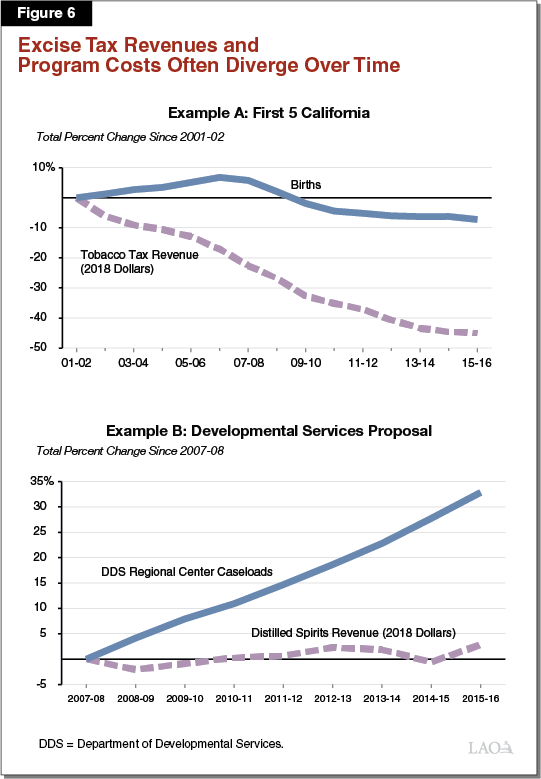
- Example: First 5 California. First 5 California—which funds services for children under 5 years old—receives the vast majority of its funding from tobacco taxes. As shown in the top panel of Figure 6, the number of births in California—the main factor determining the number of children served by First 5—has remained roughly constant over time. Real tobacco tax revenue, however, has declined steadily over time.
- Example: Developmental Services. Several years ago, the Legislature considered—but did not adopt—a proposal to fund the Department of Developmental Services (DDS) by raising taxes on distilled spirits. As shown in the bottom panel of Figure 6, however, DDS regional center caseloads—the primary driver of the department’s costs—have grown steadily over time, while real revenue from the distilled spirits tax has remained flat.
General Fund Reduces Conflict Between Fiscal Goals and Policy Goals. As noted above, the Legislature can use excise taxes to meet policy goals as well as fiscal goals, but these goals can conflict with each other in some scenarios. In the first panel of Figure 6, for example, the decline in cigarette sales has reduced funding for certain early childhood services. In this instance, the policy goal of reducing smoking conflicts with the fiscal goal of funding early childhood services. Depositing excise tax revenues in the General Fund can help the Legislature avoid such conflicts. Proportionally large changes in an excise tax base—such as the dramatic decline in smoking over the last half‑century—lead to revenue changes that are minor compared to General Fund revenue. Consequently, if such revenues are part of the General Fund, the Legislature can deal with the fiscal effects of such revenue changes by making proportionally modest adjustments to spending or to other tax rates. This approach would enable the Legislature to design and adjust excise taxes based primarily on policy goals rather than fiscal goals. As described below, however, there are some limits to the flexibility of General Fund revenue.
Tax Likely Would Increase Funding Requirement for Schools. Proposition 98, approved by voters in 1988 and modified in 1990, establishes a minimum funding level for schools and community colleges. This minimum guarantee depends, in part, on General Fund tax revenues. When the Legislature raises General Fund tax revenue, the minimum guarantee generally increases. Over the long run, the minimum guarantee increases by roughly 40 cents for every dollar of new revenue. As a result, the net increase in revenue available for nonschool purposes is smaller than the increase in General Fund revenue.
Conclusion
The effectiveness of sugary drink taxes as fiscal tools and as policy tools depends on several aspects of their design, such as the tax base, the type of tax, the tax rate, and the use of the revenue. We encourage the Legislature to consider each of these features carefully as it decides whether and how to enact such a tax.
Appendix: The Effects of Sugary Drink Taxes
This Appendix discusses our estimates of the effects of a statewide tax on sugary drinks in California.
Research on Sugary Drink Taxes
Assessing Studies. We reviewed a wide range of studies related to the effects of sugary drink taxes. To assess the usefulness of each study, we considered many factors, including:
- The quality of the data and methods used.
- The degree of similarity between the context studied and present‑day California.
- The degree of similarity between the policies studied and the policies discussed in this report.
LAO Estimates Place Very Little Weight on Studies of Local Taxes. Local excise taxes tend to be less effective fiscal and policy tools than statewide or national excise taxes for two reasons:
- Cross‑Border Shopping. Some consumers respond to the tax by buying the taxed good in other jurisdictions instead of reducing their consumption.
- Price Setting. Large retail chains often set prices on a regional basis. Consequently, a modest tax that covers only a small area might not lead such chains’ stores to raise their prices.
Sugary Drink Taxes Are Different From Sales Taxes. As mentioned in the “Background” section of the report, state and local sales taxes apply to many sugary drinks. However, sugary drink taxes are distinct from sales taxes in four important ways:
- Sales taxes apply to a wide variety of goods besides sugary drinks.
- Many sugary drinks—such as fruit drinks—are exempt from sales tax.
- Recently proposed sugary drink tax rates are much larger than typical sales tax rate changes.
- In most cases, retailers charge sales tax at the register instead of including it in posted prices. As a result, sales taxes likely have smaller effects on consumers’ behavior than equivalent excise taxes, which tend to be reflected in posted prices.
LAO Estimates Place Very Little Weight on Sales Tax Studies. Summaries of evidence on sugary drink taxes often draw heavily upon studies of changes in sales tax rates. As discussed above, changes in sales tax rates are different from sugary drink taxes in several important ways. As a result, these studies do not tell us much about sugary drink taxes.
Effects on Prices
Higher Prices for Sugary Drinks. A statewide tax on sugary drinks would lead to higher prices for the taxed drinks. The higher the tax rate, the larger the resulting price increase. For example, a tax of two cents per ounce likely would increase the price of the taxed drinks by 15 percent to 25 percent on average. This estimate is based on research on nationwide sugary drink taxes implemented in Mexico and Chile and on statewide fuel and tobacco taxes implemented in the U.S.
Broad Price Increases on Groceries Very Unlikely. Some discussions of sugary drink taxes have raised the possibility that retailers would respond to these taxes by raising prices across the board, resulting in a de facto “grocery tax.” This outcome is very unlikely for several reasons, including:
- Sugary drink taxes have no direct effect on the cost of selling other products.
- Changing prices can be costly. These costs discourage retailers from making small price changes to a large number of products.
- When the cost of a product increases, it can become harder for retailers to compete for shoppers by selling that product cheaply. As a result, retailers can have an incentive to compete for shoppers by lowering the prices of other products.
- Just like sugary drink taxes, most existing excise taxes—including taxes on fuel, tobacco, and alcohol—apply to products sold by multiproduct retailers. We are not aware of any credible evidence that these taxes have led to across‑the‑board price increases at the affected retailers.
Effects on Food and Drink Consumption
Lower Consumption of Sugary Drinks. Due to the price increases described above, consumers would buy fewer sugary drinks. The magnitude of the drop in consumption would depend crucially on the tax rate. For example, a two cent per ounce tax likely would reduce consumption by 15 percent to 35 percent. This estimate is based primarily on studies of sugary drink taxes implemented in Mexico and Chile and of simulated sugary drink taxes in the U.S. In our view, the most useful study is Allcott, Lockwood, and Taubinsky (2018), which uses data on U.S. households’ grocery purchases from 2006 through 2015 to estimate the consumer response to hypothetical sugary drink taxes.
Potential Changes in Consumption of Other Foods and Drinks. A sugary drink tax would lead to changes in behavior extending well beyond a reduction in sugary drink consumption. When consumers buy fewer sugary drinks, they also reduce their purchases of complementary goods. At the same time, they increase their purchases of substitute goods. For example, to the extent that people buy drinks because they are thirsty, we might expect the reduction in sugary drink consumption to coincide with increased consumption of other drinks. As noted above, the net effects of the tax on health depend crucially on a broad range of behavioral responses beyond the change in sugary drink consumption. Available evidence, however, does not support clear conclusions about these effects.
Selected References
Aguilar, Arturo, Emilio Gutierrez, and Enrique Seira (2017). “The Effectiveness of Sin Food Taxes: Evidence From Mexico.” Mimeo, Instituto Tecnológico Autónomo de México.
Allcott, Hunt, Rebecca Diamond, and Jean‑Pierre Dube (2018). “The Geography of Poverty and Nutrition: Food Deserts and Food Choices Across the United States.” National Bureau of Economic Research Working Paper 24094.
Allcott, Hunt, Benjamin Lockwood, and Dmitry Taubinsky (2018). “Regressive Sin Taxes, with an Application to the Optimal Soda Tax.” Mimeo, New York University.
Chetty, Raj, Adam Looney, and Kory Kroft (2009). “Salience and Taxation: Theory and Evidence.” American Economic Review 99(4):1145‑1177.
Colchero, M. Arantxa, Carlos Manuel Guerrero‑Lopez, Mariana Molina, and Juan Angel Rivera (2016). “Beverage Sales in Mexico Before and After Implementation of a Sugar Sweetened Beverage Tax.” PLoS ONE 11(9).
Colchero, M. Arantxa, Juan Carlos Salgardo, Mishel Unar‑Munguia, Mariana Molina, Shuwen Ng, and Juan Angel Rivera‑Dommarco (2015). “Changes in Prices After an Excise Tax to Sweetened Sugar Beverages Was Implemented in Mexico: Evidence from Urban Areas.” PLoS ONE 10(12).
DellaVigna, Stefano and Matthew Gentzkow (2017). “Uniform Pricing in U.S. Retail Chains.” National Bureau of Economic Research Working Paper No. 23996.
Grogger, Jeffrey (2017). “Soda Taxes and the Prices of Sodas and Other Drinks: Evidence From Mexico.” American Journal of Agricultural Economics 99(2).
Harding, Matthew, Ephraim Leibtag, and Michael Lovenheim (2012). “The Heterogeneous Geographic and Socioeconomic Incidence of Cigarette Taxes: Evidence from Nielsen Homescan Data.” American Economic Journal: Economic Policy 4(4):169‑198.
Harding, Matthew and Michael Lovenheim (2017). “The Effect of Prices on Nutrition: Comparing the Impact of Product‑ and Nutrient‑Specific Taxes.” Journal of Health Economics 53.
Kopczuk, Wojciech, Justin Marion, Erich Muehlegger, and Joel Slemrod (2016). “Does Tax‑Collection Invariance Hold? Evasion and the Pass‑Through of State Diesel Taxes.” American Economic Journal: Economic Policy 8(2).
Marion, Justin and Erich Muehlegger (2011). “Fuel Tax Incidence and Supply Conditions.” Journal of Public Economics 95.
McMillan, Rob (2007). “Different Flavor, Same Price: The Puzzle of Uniform Pricing for Differentiated Products.” Mimeo, Federal Trade Commission.
Nakamura, Ryota, Andrew Mirelman, Cristobal Cuadrado, Nicolas Silva‑Illanes, Jocelyn Dunstan, and Marc Suhrcke (2018). “Evaluating the 2014 Sugar‑Sweetened Beverage Tax in Chile: An Observational Study in Urban Areas.” PLoS Medicine 15(7).
Powell, Lisa, Zeynep Isgor, Leah Rimkus, and Frank Chaloupka (2014). “Sugar‑Sweetened Beverage Prices: Estimates From a National Sample of Food Outlets.” Bridging the Gap research brief.
Rahkovsky, Ilya and Samantha Snyder (2015). “Food Choices and Store Proximity.” United States Department of Agriculture Economic Research Service Report No. 195.
Thomassen, Oyvind, Howard Smith, Stephan Seiler, and Pasquale Schiraldi (2017). “Multi‑Category Competition and Market Power: A Model of Supermarket Pricing.” American Economic Review 107(8).