
December 13, 2018
The 2020 Census:
Potential Impacts on California
- Introduction
- What is the U.S. Census?
- How Will the Federal Government Conduct the 2020 Census?
- How Are State Governments Preparing for the 2020 Census?
- Possibility of Undercount in 2020 Census
- Implications of the Count for Congressional Representation
- Implications of the Count for Federal Funding to California
- Conclusion
Executive Summary
Federal Government Counts the Number of People in the United States Every Ten Years. The U.S. Constitution requires the federal government to count the total number of people in the United States every ten years. This is the decennial Census. The U.S. Census Bureau (“the Bureau”), a division of the U.S. Department of Commerce, will conduct the next Census in 2020.
Census Population Counts Used to Determine Congressional Representation and Certain Federal Funding Levels for States. The results of the Census are used to distribute seats in the House of Representatives and inform the amount of federal funds allocated to states for certain programs. Census results also are used to determine legislative districts for federal, state, and local representatives within each state. Moreover, the Census provides a social, demographic, and economic profile of the country’s residents, informing decisions by policymakers and businesses across the state.
California Has Experienced an Undercount in Past Censuses, Particularly in 1990. An undercount of California occurs when there are more people living in the state than are counted by the Census. While the Census has become more accurate over time, some past Censuses have resulted in significant undercounts of California’s population. For example, the 1990 Census undercounted California’s population by 2.74 percent (about 835,000 people), which was disproportionately worse than the national undercount—1.59 percent or about 4 million people. As a result, California gained one fewer seat in Congress than it was entitled to receive and was estimated to have lost over $200 million of federal funds in a single fiscal year. The 2000 and 2010 Censuses were much more accurate.
California Could Experience an Undercount in 2020 . . . There are a variety of reasons to believe that California could experience an undercount in 2020. First, the state experienced greater undercounts than the rest of the nation in all of the past three Censuses. Second, the state has a higher share of people who historically have been more difficult to count relative to the rest of the nation (referred to as the hard‑to‑count population). This hard‑to‑count population includes immigrants, who may be even harder to count in 2020 than they were in the past.
. . . But an Undercount Would Likely Be Smaller Than the 1990 Scenario. That said, we think that a statewide undercount equivalent to the 1990 undercount is not likely. There are a variety of reasons for this, including: (1) improvements in the Census’ methodology, (2) advances in access to statistical and administrative data, and (3) adequate funding levels for current Census preparation activities. (While past funding issues did limit some of the Bureau’s planning activities, Congress has granted the Bureau its full budget request for the most recent fiscal year.)
California Unlikely to Lose a Seat Due to an Undercount . . . Other researchers have found that an undercount like the one that occurred in 1990 would not cause California to lose a congressional seat. Because we think even that scenario is unlikely, the risk of California losing a congressional seat is low.
. . . Or Much Federal Funding. Some reports have indicated that California has billions of dollars at stake as a result of an undercount similar to 1990. Even in this worst‑case scenario, however, we find that an undercount could result in the California state government losing tens of millions of dollars—not billions of dollars—in federal funding. In budgetary terms, this amount of money is very small. (Federal funds distributed directly to local governments also could be affected, but the size of this effect is unknown.)
Complete and Accurate Count in 2020 Still Important. There are other reasons to ensure a complete and accurate count in 2020. For instance, certain regions in the state run a greater risk of being undercounted than others. As a result, an undercount of some regions relative to others could result in some people within the state having less congressional (and state legislative) representation relative to what they should receive.
Introduction
The U.S. Constitution requires the federal government to count the number of people in the United States every ten years—the Census. The Census is important, in part, because it is used to determine each state’s representation in the House of Representatives and the amount of federal funds allocated to states for certain programs. Generally, a higher population count by the Census means that a state will be eligible to receive more seats in Congress and more funds. In contrast, “undercounting” the population of a state could result in fewer seats and less funds relative to what the state should receive. This report discusses these potential effects of an undercount in California.
In this report, we first provide information on what the Census is. Second, we discuss how the Census is conducted—including the steps the federal government has taken to date and what it plans to do over the next few years to conduct the 2020 Census. (We also describe state efforts to supplement these federal activities.) We then discuss the likelihood of an undercount in California in 2020. Finally, we discuss the implications of an undercount for California both in terms of representation in Congress and federal funding.
What is the U.S. Census?
U.S. Constitution Requires a Count of Each Person Residing in the Country. Article I, Section 2 of the U.S. Constitution requires the federal government to count the total number of people residing in the United States, including citizens and noncitizens, once every ten years. This decennial count is known as the Census. (In addition to residents physically located in the United States, the Census also includes military and civilian federal personnel and their dependents who live overseas.) The U.S. Census Bureau (the Bureau), which is part of the U.S. Department of Commerce, conducts the Census.
Next Census Will Occur in 2020. The United States conducted the first Census in 1790 and has done so every ten years since. The next decennial Census—the nation’s 24th—will be conducted in 2020. In general, the Census collects information on how many people live in a household, as well as their respective sexes, ages, races, and ethnicities. The Bureau also uses the decennial Census as the basis for its annual population estimates of the nation, as described in the nearby box.
Federal and State Population Estimates Affected by the Census
The Decennial Census Informs Annual Population Estimates. The U.S. Census Bureau (the Bureau) produces annual population estimates for the nation, states, and counties for the years in between Censuses. In years the decennial Census is conducted, the Bureau’s population counts are “re‑benched” to equal the final Census count. For years in‑between decennial censuses, the Bureau adjusts the most recent Census counts using administrative records on the number of births, deaths, and net migration (and some other information) to calculate annual population estimates.
The Bureau Uses the Decennial Census for Other Products. The annual population estimates from the Bureau serve as the population counts for other data products. For example, the Bureau also produces the American Community Survey (ACS) annually, which surveys demographic and economic characteristics of populations at various geographic levels. These products are commonly used by academics, governmental entities, research and policy institutions, and businesses to conduct studies and implement programs. For example, our office uses the ACS to analyze socio‑economic and housing trends in California.
State Entities Use the Decennial Census for Annual Estimates. At the state level, the Department of Finance (DOF) also uses Census population counts to re‑bench its population estimates every ten years (although DOF has its own population estimates for the intervening years). DOF population estimates are a key input in a variety of state‑level spending formulas and allocations. As a result, the Census also affects many aspects of state and local financing in California.
Census‑Related Activities Occur Over Many Years. While the counting of people in the United States will occur in 2020, key planning, preparation, and operational activities for the 2020 Census began as early as 2013 and will continue past 2020. For instance, in 2013 the Bureau conducted a series of studies to examine the feasibility and effects of using new data collection methods in the 2020 Census. In addition, the Bureau’s analysis and publication of the final Census population counts will continue until 2021. (We discuss 2020 Census preparation and expected future activities in detail later in the report.)
Why Is the Census Important?
Congressional Representation. The U.S. Congress—comprised of the Senate and House of Representatives—passes federal laws, raises revenues for the federal government through taxes, and allocates those funds through the federal budget process. While each state—regardless of the number of people who live there—has two seats in the U.S. Senate, seats in the U.S. House of Representatives are apportioned based on population. There are 435 seats in the House. Under the Constitution, each state is guaranteed one seat in the House and the remaining 385 seats are apportioned based on the Census population counts. Based on the 2010 Census, California has the largest delegation of Representatives in the House with 53 seats—accounting for 12 percent of the seats. (The second largest delegation is from Texas with 36 seats.) As the definitive source of population counts for purposes of determining the number of House seats allotted to California, the accuracy of the Census helps ensure that residents of California have appropriate representation in the federal legislative and budgetary process. (As we discuss later, Census data also informs how these seats are distributed within the state.)
Electors in the Electoral College. The U.S. President is elected by the Electoral College. The Electoral College consists of 538 electors. A presidential candidate must receive at least a majority (270) of electoral votes to be elected to the Office of the President. Each state is entitled to a number of electors equal to state’s number of House and Senate seats, meaning California has 55 electors. (In addition, the District of Columbia is entitled to three electors.) By determining the size of each state’s congressional delegation, the Census determines the level of representation each state has in electing the President.
Federal Funding to the State. In some cases, the Census population count affects how much federal funds each state receives. That is, many federal statutes allocate funding to the states based on a formula that uses states’ populations—as determined by the Census—as one variable to determine their respective shares of the funding. In most cases, the higher a state’s population count, the more federal funding the state is eligible to receive. Similarly, certain federal funds provided directly to local governments and nongovernmental entities are based on Census population counts.
How Will the Federal Government Conduct the 2020 Census?
This section describes how the federal government will conduct the 2020 Census. First, we discuss the overall goals of the Census. Then, we outline recent actions the federal government has taken to fund the Census. Finally, we describe the Bureau’s timeline for completing the Census, from pre‑count activities that have already been completed, to the count of people in 2020, to the activities it completes post‑count to finalize the Census.
Goal of the Census Is to Get a Complete and Accurate Count. The Bureau’s goal for the 2020 Census is to count everyone once, only once, and in the right place. In other words, the Bureau strives to get a complete and accurate count. A “complete count” occurs if the Census counts the right number of people in the state. An “accurate count” occurs if the Census captures the characteristics of people correctly—including where they live and other demographic information. Ideally, the 2020 Census will be both complete and accurate. (As we explain later, the Bureau evaluates accuracy and completeness with post‑Census analyses using surveys and other methods.)
The Bureau Conducts Two Types of Population Counts. The Bureau will complete two separate counts of people living in the United States as part of the 2020 Census: the household enumeration (a count of people living in houses, apartments, and other dwellings) and a group quarters enumeration (a count of people living in facilities, like dormitories, military bases, and prisons). This report focuses on the household enumeration, which accounts for about 97 percent of the state’s total population.
Funding for the 2020 Census
Census Has Made a Number of Changes to Improve Cost‑Efficiency. Over the last several decades, conducting the Census has become more expensive on a per‑person basis. There are a variety of reasons for this cost increase: (1) self‑response rates have declined (which the Bureau believes could result from distrust of government or concerns about sharing information); (2) people move more frequently; and (3) more people live in complex living arrangements (such as multigenerational households or individuals with ties to multiple residences), which makes it a challenge to associate a person with a single location. In light of these trends and direction from Congress, the Bureau set out to create cost efficiencies for the 2020 Census. The Bureau sought to design the Census so that, per housing unit, it would cost less than the 2010 Census, but still maintain high‑quality results. (The 2010 Census cost the Bureau an estimated $120 per housing unit. The Bureau set out to have the 2020 Census cost $107 per unit, for a total estimated cost of $15.6 billion.)
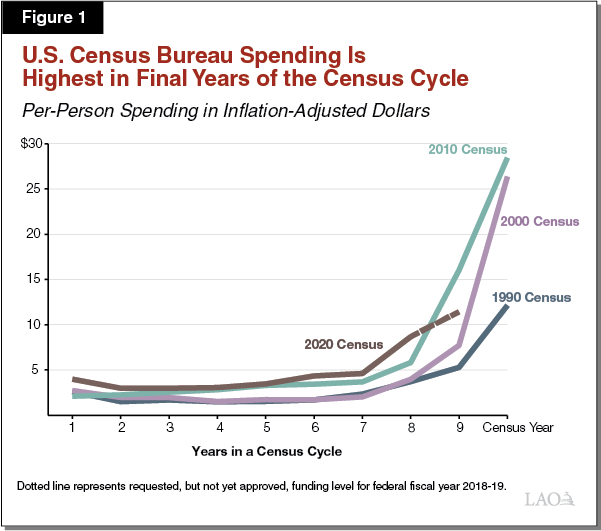
Typical Census‑Related Spending Cycle. The federal government typically provides the Bureau with funding during the early years of a Census cycle (that is, early in the decade) to complete certain planning and preparation activities. As shown in Figure 1, funding grows slowly in these early years. It is not until the last three to four years of a Census cycle—when the Bureau is beginning to open regional offices, hire Census workers, and visit households—that federal funding significantly ramps up. As Figure 1 also shows, to date, funding throughout the 2020 Census cycle has, in nearly all years, been slightly higher in inflation and population‑adjusted terms than for the last three Census cycles.
Recent Actions on Federal Funding to Support the 2020 Census. In the past couple of years, the funding allocated to 2020 Census activities has been less than what the Bureau initially requested. For example, in federal fiscal year (FFY) 2016‑17, the amount of federal funding provided for Census‑related activities ($1.47 billion) was 10 percent less than what the Bureau requested ($1.63 billion). The 2017‑18 federal spending bill (passed in March 2018), however, nearly doubled the Bureau’s FFY 2016‑17 funding level to a total of $2.8 billion. (The majority of this funding is expected to support 2020 Census activities, rather than other activities, like conducting annual population and demographic surveys.) The Bureau has requested $3.8 billion for FFY 2018‑19, a 37 percent increase relative to FFY 2017‑18 funding levels. Such an increase in spending follows past trends of the Bureau’s budget significantly increasing in the years leading up to the Census. What level of funding the federal government ultimately will allocate to the Bureau in FFY 2018‑19 and FFY 2019‑20 to support future Census efforts is unknown. (When this report was published, the federal government had yet to approve a final FFY 2018‑19 funding level for the Bureau.)
Census Preparation Activities
This section discusses the activities the Bureau has conducted to prepare for 2020 Census.
Bureau Has Compiled the National Address List. A couple of years before beginning to count people, the Bureau collects addresses for every known household in the country. This list is used to mail census forms and follow up with people who do not respond to those forms. In past years, the Bureau relied heavily on field workers on the ground to update the national address list. To reduce costs for the 2020 Census, the Bureau has relied primarily on state and local government data, satellite imagery, and other administrative records to update its address list. (Although in 2019 the Bureau will conduct some on‑the‑ground canvassing to finalize the address list.)
Bureau Has Updated the Questionnaire. The Bureau has finished updating the questions contained in the Census questionnaire—the questions every household will receive as part of the 2020 Census. As is required by law, the Bureau submitted to Congress its planned questions for the 2020 Census on March 29, 2018. These questions include topics on age, race, and sex. The Bureau also plans to include a question about citizenship status in the questionnaire. (The California Attorney General and others have challenged the inclusion of the citizenship question on the grounds that it could result in lower response rates among immigrants, resulting in an incomplete population count that violates its constitutional purpose.) The nearby box describes the history of the inclusion of a citizenship question in the Census.
History of the Census Questionnaire and Citizenship Question
History of the Census Questionnaires. The Census has been conducted every decade since 1790. For most of this history, there was only one relatively short Census questionnaire that asked basic questions about overall household size and characteristics for each household member (race, gender, and age). Beginning in 1970, the U.S. Census Bureau (the Bureau) began using two questionnaires—a short‑form and a long‑form—so that it could ask a subset of households more detailed information. Five in six households received the “short‑form” questionnaire, which continued to include basic questions on household size and characteristics. One in six households received the “long‑form” questionnaire. The long‑form Census included many more questions on various topics, such as the value of a person’s home or their monthly rent, number of rooms in a household, or a person’s marital status, occupation, and income.
Recent Changes to the Structure of the Census Questionnaire. In 2010, all households received the short‑form Census only. Instead of distributing a long‑form Census, the Bureau instead collected detailed data on a small percentage of households throughout the decade in the American Community Survey (ACS). Effectively, this means most questions asked on the long‑form question are now asked on the ACS instead. The 2020 Census will continue with this approach.
History of the Inclusion of a Citizenship Question. Beginning in 1870 and running through 2000, a Census questionnaire included at least one question about citizenship. When the Census began using two separate forms (the short‑ and long‑form) in 1970, a citizenship question was included on the long‑form, but not the short‑form, questionnaire. When the long‑form questionnaire was replaced with the ACS in 2010, a question about citizenship status was included on the ACS instead. As such, a citizenship question was not included in the 2010 decennial Census.
Bureau Completed One and Only “Dress Rehearsal” for 2018. Before the Census count, the Bureau typically conducts several full dress rehearsals to test its methods for reaching people who do not respond to the questionnaire on their own. The Bureau initially planned to do a dress rehearsal in three areas of the country. As a result of budget limitations discussed earlier, the Bureau reduced the number to one (although the questionnaire used in the dress rehersal excluded the question on citizenship). In 2018, the Bureau conducted that dress rehearsal in Providence, Rhode Island. The Bureau has called the test a success: self‑response rates were higher than expected (52.3 percent compared to 49.3 percent expected) and Census workers were able to count 1.56 houses per hour (higher than the rate in the 2010 Census of 1.05 houses per hour). These results, however, may not be indicative of how quickly Census workers will be able to count people in other cities and towns across the nation. Specifically, the dress rehearsal was conducted in an urban area and enumerations will likely be slower in less densely populated areas. The Bureau also plans to test response rates with the inclusion of the citizenship question in the questionnaire in 2019.
Census Count of Households
Bureau Contacts Every Household in Nation by Mail. In 2019, the Census will begin developing broad public awareness about the upcoming Census, including through paid advertisements, social media outreach, and events. In 2020, using its compiled address list, the Bureau will contact every household in the country by mail. Specifically, the Bureau will mail: to 80 percent of households an invitation to submit responses online and to 20 percent of households a paper questionnaire to submit through the mail. (The decennial Census has never systematically used an online response option before, but the Bureau has allowed households to respond to the American Community Survey online for several years.) The Bureau will ask households to respond by April 1, 2020: “Census Day.” Those who do not respond to the survey online after two mailed reminders will receive a paper questionnaire.
After April 1, 2020, Census Workers Will Follow‑Up With Nonrespondents in Person. From mid‑May to mid‑August 2020, a team of about 420,000 Census workers will conduct in‑person follow‑up visits to households across the country that did not respond to the questionnaire. In these follow‑up visits, staff will go door‑to‑door with mobile devices and tablets that they can use to collect the household’s data. In previous years, Census workers visited every nonresponding household up to six times to complete their surveys. In 2020, the number of follow‑up visits a household will receive will vary. The default number of visits is still six, but it could be higher or lower depending on two main factors:
- Availability of Administrative Data. If the Bureau has complete and reliable administrative data available for a household that does not respond to the initial mailed questionnaires and reminders, a Census worker will conduct one follow‑up visit to that home. If the household does not respond after that visit, the Bureau will complete the count for that household using its administrative data. Administrative records that the Bureau will use include: tax returns from the Internal Revenue Service, Medicare and Medicaid enrollment information, Supplemental Nutrition Assistance Program records, and property tax and deed data.
- Whether the Household Is in a Hard‑to‑Count Area. The Bureau has designated certain areas as hard to count based on how many of that area’s households mailed back their 2010 census questionnaire. Households in areas known to be hard‑to‑count may receive more than the six default attempts.
The Bureau may also increase follow‑up visits to certain households based on the test of the citizenship question. As they have in the past, after a Census worker follows up with a household three times, and no one has completed the questionnaire, Census workers are allowed to complete the count for that household by interviewing a “proxy.” A proxy can be a neighbor, landlord, relative, caregiver, utility worker, or other person who knows the household.
Bureau Will Use Statistical Methods to Impute Data for Other Households. If Census workers are unable to complete the count for a household using all of the above methods, the Bureau can count the household using statistical imputation. Imputation means the Bureau infers a household’s characteristics based on the characteristics of surrounding households. The Bureau uses imputation to indicate whether or not a household is occupied; the number of people living there; and the characteristics of those people, like age and race. For example, the Bureau could use imputation to estimate how many people live in a household that never responded to the Census. Or, if a household completes the survey, but does not indicate the age of one of the people living there, the Bureau can use imputation to estimate the persons age. The 2010 Census counted about 1.2 million people using imputation (less than 1 percent).
Post‑Count Activities
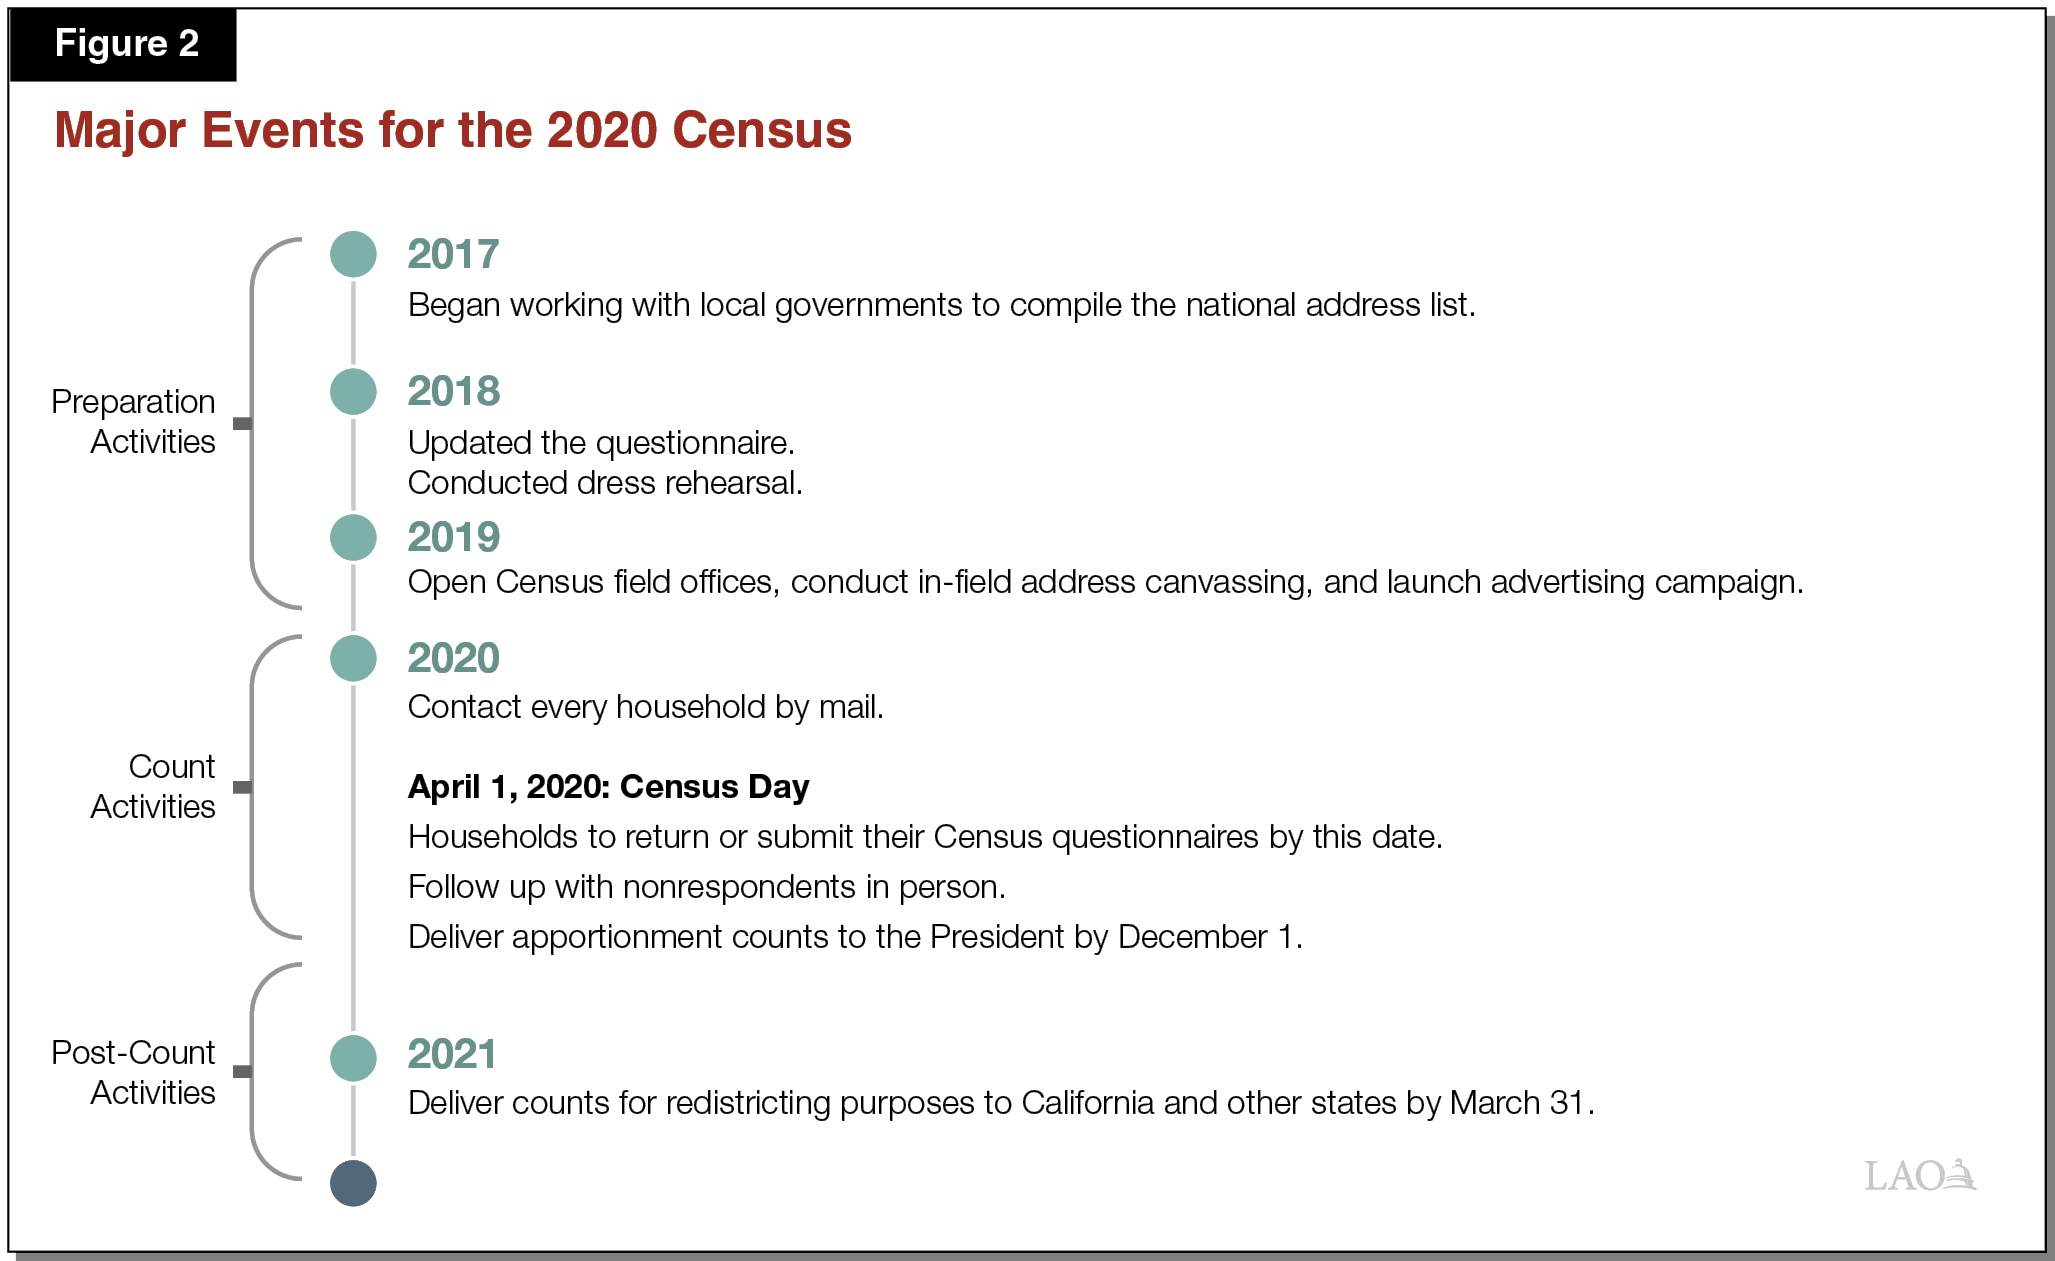
Finalize the Count. After conducting the core count operations described above, the Bureau will combine the results from the household enumeration with the group quarters enumeration. The Bureau will then tabulate all of the data and release the results. The Bureau has until December 1, 2020 to deliver apportionment counts to the President and until March 31, 2021 to deliver the counts for redistricting purposes to California and other states. Figure 2 summarizes the main events in the 2020 Census activities, from preparation to post‑count.
After Finalizing All Enumerations, Bureau Will Conduct Surveys to Evaluate Accuracy. After the count is finalized, the Bureau will conduct two major analyses to measure the accuracy of the household enumeration. One approach compares the Census counts to data from surveys that the Bureau completes after the Census. A second approach compares the count to administrative records. Both of these methods examine how complete the overall count was and whether the count was accurate for some demographic groups. These surveys are conducted only for informational purposes; the Bureau does not update its decennial Census population counts based on these surveys.
How Are State Governments Preparing for the 2020 Census?
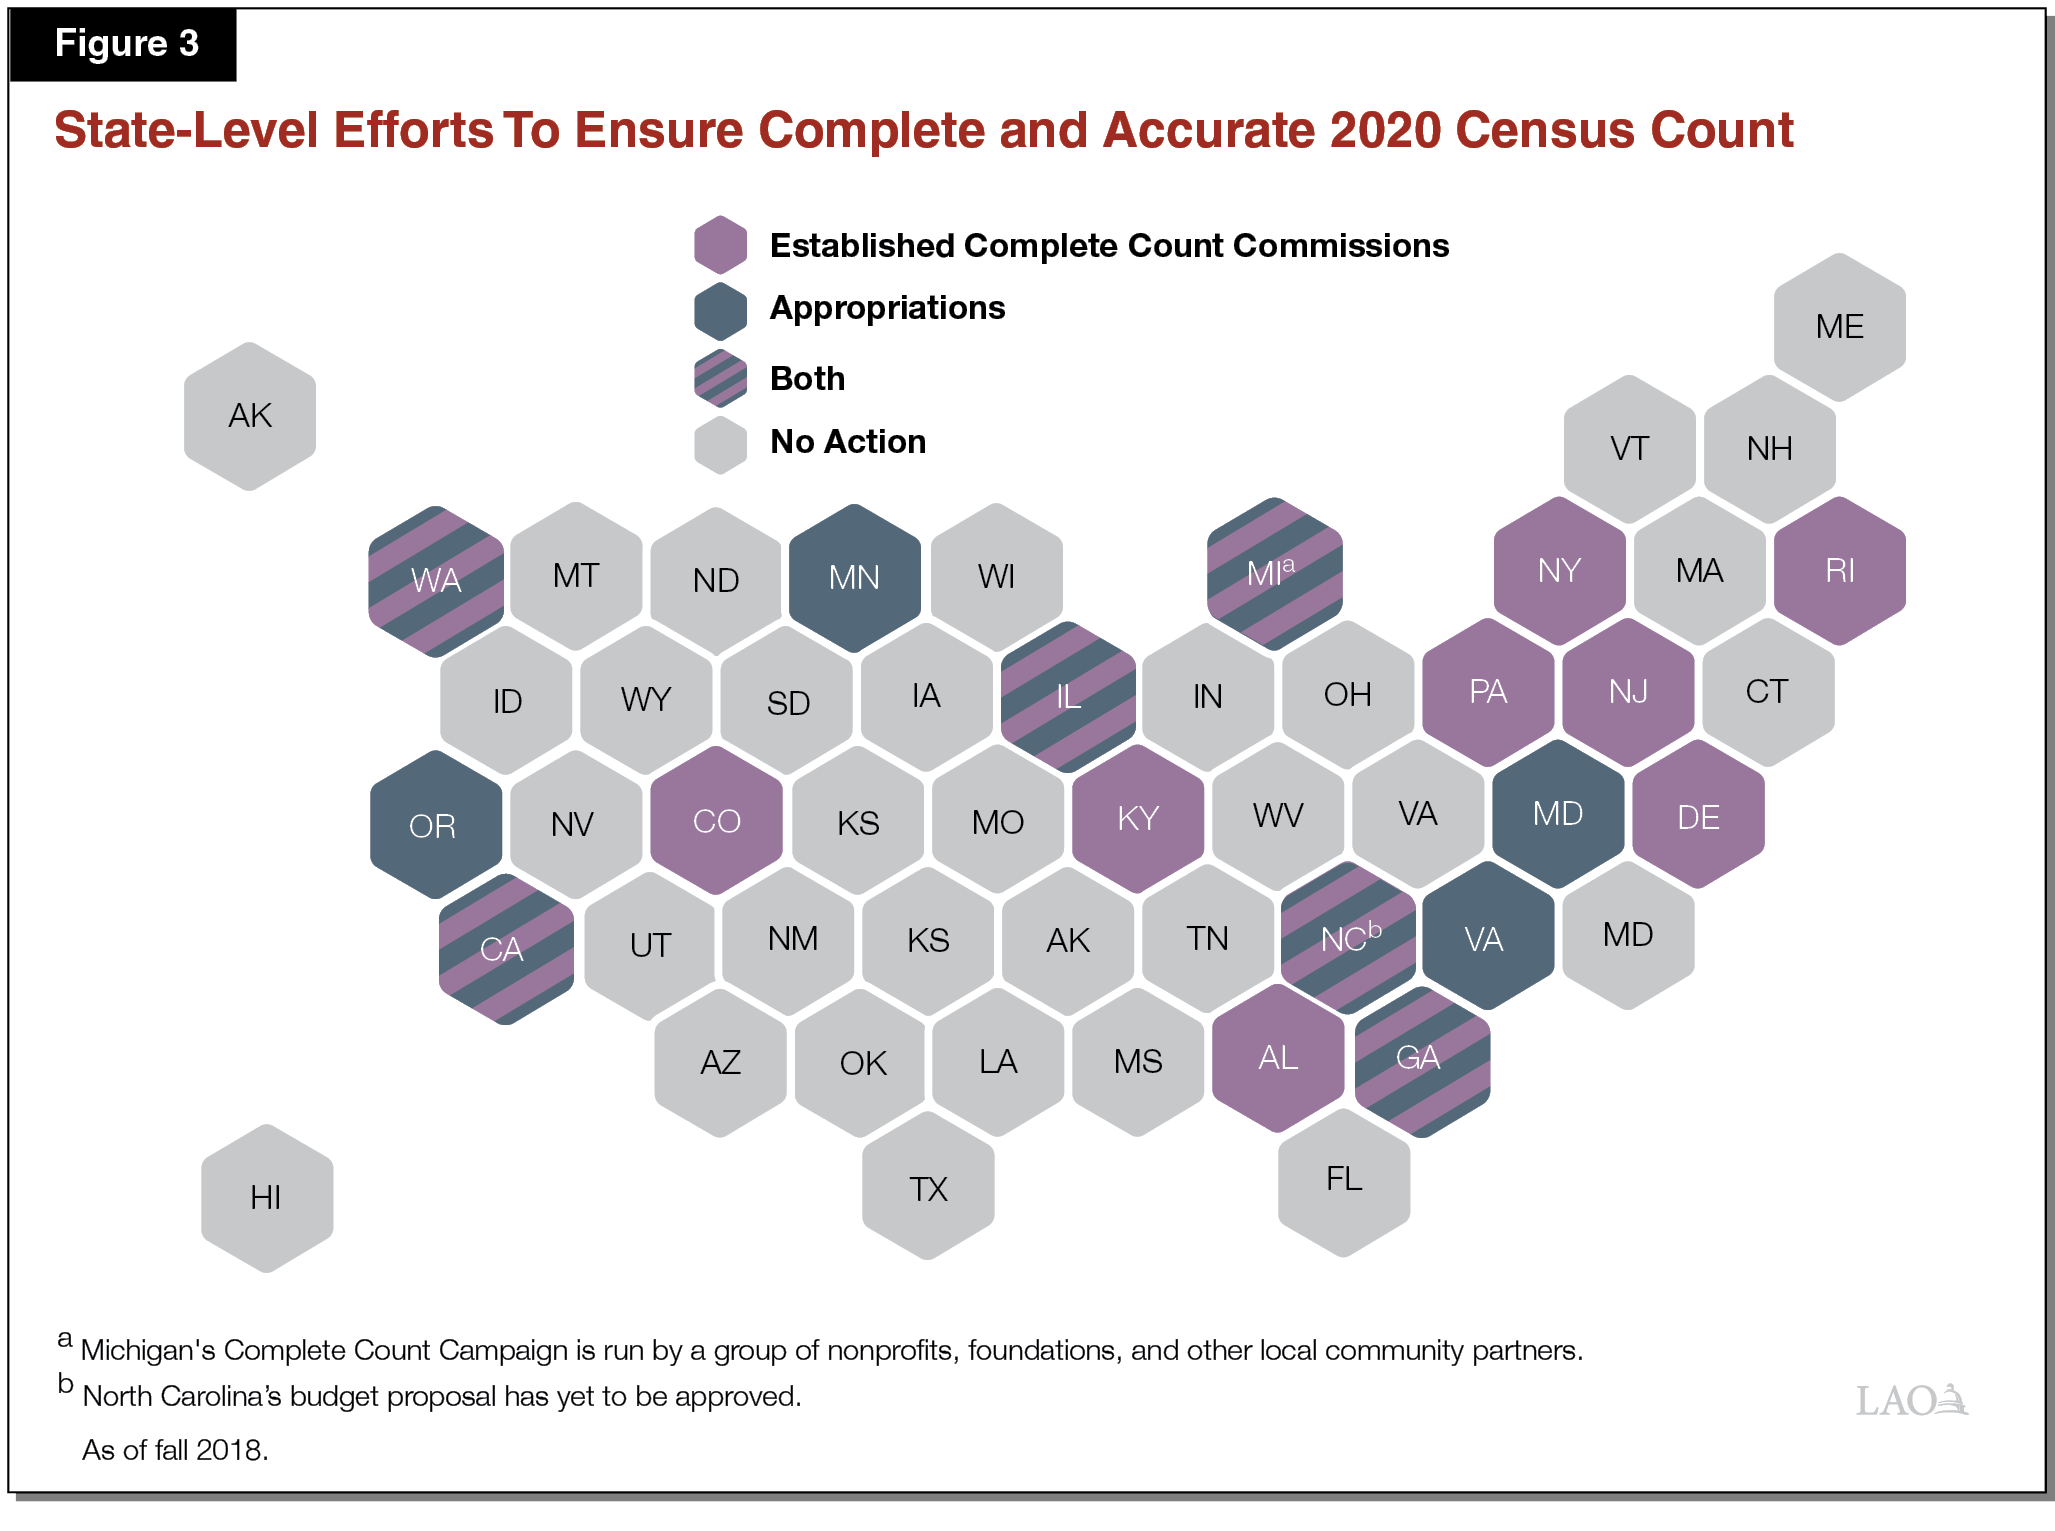
In preparation for the 2020 Census, a number of states, local governments, and nongovernmental entities have launched independent efforts to ensure an accurate and complete count. For this report, we focus on state‑led and funded efforts. Figure 3 shows the 18 states that have (1) allocated state funding for outreach and promotional activities to supplement the Bureau efforts, (2) established Complete Count Committees, or (3) done both. (California has done both.) Complete Count Committees engage state and local community partners to distribute educational materials, educate the public on the importance of the Census, and conduct community outreach. (Some states have discussed—but have not adopted—funding proposals to support the 2020 Census. Additionally, some states have expressed interest in establishing Complete Count Committees but have yet to do so.) Figure 3 includes only state‑level funding for the Census and excludes funding provided by local governments or nonprofits. Below, we discuss past and current support California has provided for the decennial Census.
California Has Provided Some Outreach in the Past. Beginning with the 2000 Census, California provided some level of funding to its Complete Count Committee. Similar to other states, California’s Complete Count Committee is appointed by the Governor and coordinates the state’s outreach efforts (that supplement federal outreach efforts). These outreach efforts focus on the hard‑to‑count population. For the 2000 Census, the state provided $28.8 million to support the Complete Count Committee (in today’s dollars). For the 2010 Census, the state provided $2.3 million in today’s dollars. (The Complete Count Committee also raised roughly $10 million in private funding to augment its efforts for the 2010 Census.)
California Has Set Aside $100 Million for 2020 Census Activities. Initially, as a part of the 2017‑18 Budget Act, the state provided $7 million in incentive grants for local governments to assist the Bureau in updating its address list and $3 million for other state preparation activities. In the 2018‑19 Budget Act, the state provided an additional $90.3 million to support the Complete Count Committee for outreach activities related to the 2020 Census through 2020‑21. On a per‑person basis, the $100 million in funding California has provided for Census outreach is much higher than the funding level provided by any other state so far, as Figure 4 shows.
Figure 4
California Has So Far Spent Much More on 2020 Census Outreach Than Any Other State
(Dollars in Thousands)
|
Total Amount |
2020 Population Projection |
Spending Per Person |
|
|
California |
$100,300 |
40,556,804 |
$2.47 |
|
Georgia |
2,251 |
10,723,849 |
0.21 |
|
Illinois |
1,500 |
12,802,052 |
0.12 |
|
Maryland |
5,000 |
6,163,346 |
0.81 |
|
Michigan |
500 |
10,007,985 |
0.05 |
|
Minnesota |
380 |
5,687,915 |
0.07 |
|
North Carolinaa |
1,500 |
10,560,813 |
0.14 |
|
Oregon |
231 |
4,268,014 |
0.05 |
|
Virginia |
115 |
8,655,193 |
0.01 |
|
Washington |
464 |
7,675,985 |
0.06 |
|
aNorth Carolina’s budget proposal has yet to be approved. As of fall 2018. |
|||
Possibility of Undercount in 2020 Census
The possibility of an undercount occurring in California has been widely discussed by the Legislature, media, and broader public. (An undercount occurs when there are more people living in an area than are counted by the Census.) An undercount could negatively affect the state’s share of certain federal funds and the number of congressional seats the state is apportioned. (An overcount, conversely, occurs when there are fewer people living in an area than are counted by the Census—which primarily occurs when the same people are counted more than once.) The rest of this section discusses the reasons an undercount might or might not occur in 2020. Later in the report, we discuss in detail how an undercount could affect the number of congressional seats the state is apportioned and the amount of money California receives from the federal government.
California Can Experience an Absolute or Relative Undercount in 2020. There are two types of undercounts that California can experience that are relevant. Either of these outcomes could have implications for congressional seats and/or federal funds. In particular, California can experience an:
- Absolute undercount if the Census count of the state’s total population is lower than actual (meaning not everyone in the state is counted).
- Relative undercount if a larger share of California’s population is not counted relative to other states. (This could occur, for example, if all states experience an undercount, but the undercount in California is larger than average. Or, it could occur even if the national count is largely accurate, but California experiences an undercount.)
Past Census Undercounts
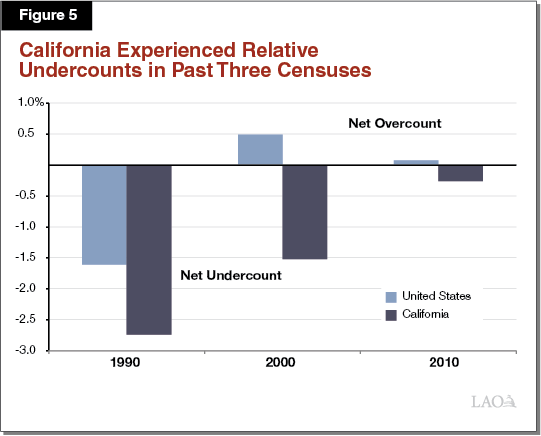
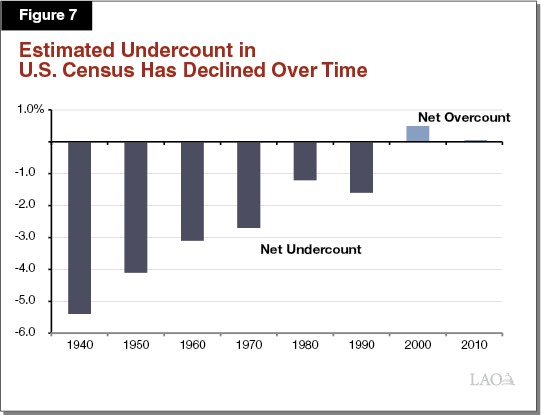
California Experienced Relative Undercounts in 1990, 2000, and 2010. Figure 5 shows the results of the post‑Census surveys from 1990 to 2010 and their level of accuracy. In each of the last three Censuses these surveys showed California experienced both an absolute and relative undercount. In 1990, the U.S. experienced an undercount of 1.59 percent (considered large by Census standards). In that year, however, the undercount of California was even larger at 2.74 percent. In 2000, the U.S. experienced an estimated 0.49 percent overcount, but California’s population was still undercounted by an estimated 1.52 percent. In 2010, the national count was roughly complete, but the count of California’s population was too low by 0.26 percent.
Hard‑to‑Count Groups Have Been Historically Undercounted at Higher Rates. Even when the overall count has been largely accurate, the Census has undercounted particular groups of people. These populations are often called “hard‑to‑count.” The Bureau’s post‑Census analyses have measured the likely undercount of some different groups. In 2010—when there was no national undercount overall—the Bureau found:
- Non‑Hispanic Black residents were undercounted by 2.07 percent.
- American Indian people living on reservations were undercounted by 4.88 percent.
- Renters were undercounted by 1.09 percent.
- Very young children also were undercounted, although to a lesser extent than these other groups. Children ages 0 to 4 were undercounted by an estimated 0.72 percent. (One reason very young children may be undercounted is confusion—people completing the survey may not realize that the form should be completed for infants and toddlers, as well as adults.) That said, in 2010, children ages 10 to 17 were overcounted by 0.97 percent and on net all children (people aged 0‑17) were overcounted by 0.33 percent.
Other Groups Are Also Difficult to Count. There are other groups that are more difficult to count but have not been tracked in undercount surveys specifically. These groups include: people who do not speak English fluently, lower‑income people, people who were born outside of the United States, and LGBTQ+ people. Additionally, people living in complex living situations—such as individuals with ties to multiple residences and multigenerational households—can be particularly difficult to count. People experiencing homelessness are also considered hard to count, although they are generally counted in the group quarter enumeration, not the household enumeration. The nearby box describes this process in more detail.
Group Quarters Enumeration
The Census counts people who live in group quarters differently than people who live in households. Group quarters include jails, prisons, college dormitories, long‑term care facilities (like nursing homes), and military bases. People who are experiencing homelessness at the time of the Census are counted in the group quarter enumeration either at a place they are receiving services or in non‑shelter outdoor locations.
About 1 Million People Counted in Group Quarter Enumeration in California in 2010. In 2010, about 8 million people were counted nationally in the group quarter enumeration—just over 10 percent of them, or nearly 1 million people, lived in California. Of these people, about half lived in institutions (in a correctional facility or nursing home, for example) and about half lived in noninstitutional settings like college dormitories and military bases. This population living in noninstitutional settings included people experiencing homelessness or those living in group homes. According to a separate report by the U.S. Department of Housing and Urban Development, about 133,000 people in California were experiencing homelessness on a single night in 2010.
How the Group Quarter Enumeration Works. Rather than being counted individually, people are counted in group quarters collectively. There are three major ways the U.S. Census Bureau (the Bureau) will count people living in group quarters in 2020: (1) through in‑field visits, (2) using administrative records, and (3) with responses from administrators of facilities. For example, to count some people experiencing homelessness, Census workers visit emergency shelters and non‑shelter outdoor locations and conduct interviews with people staying there.
State‑Level Efforts for the Group Quarter Enumeration. In California, the Department of Finance, not the Complete Count Committee, will work with the Bureau on the group quarter enumeration. (However, the Complete Count Committee’s Housing Working Group is working on strategies for integrating these groups into outreach efforts.) Moreover, while states may coordinate information and assist the Bureau in identifying group quarter facilities, the actual in‑field enumeration is done by federal Census workers.
Potential Reasons for an Undercount in 2020 for California
Below, we discuss key reasons why California could experience a different (likely higher) undercount rate than most other states in 2020.
A Higher Share of California’s Population Is Hard to Count. States with a large hard‑to‑count population face a greater risk of an undercount. Relative to other states, a larger share of California’s population is considered hard to count. Almost two‑thirds (63 percent) of the state’s population is Hispanic or non‑white, which is close to twice the national rate (39 percent). Additionally, a greater share of households in California live in rental units compared to the rest of the nation (45 percent and 36 percent, respectively). Should there be an undercount of these hard‑to‑count populations in 2020, the relative undercount in California could be larger due to the demographics of the state. Moreover, because some areas of the state have larger shares of hard‑to‑count populations, an undercount of certain groups would impact some regions of the state differently.
Administrative Data May Not Be Reliable for Certain Hard‑to‑Count Populations. As previously mentioned, one way the Bureau plans to reduce nonresponse rates is by using administrative data. One challenge, however, is that administrative data is more accurate (and available) for certain populations than others. For example, property tax and deed records can help the Bureau improve its information for homeowners. These records, however, would not capture renters. Additionally, the Bureau acknowledges that while administrative records may accurately capture some hard‑to‑count groups (such as low‑income households receiving government assistance), it may underrepresent others (including noncitizens and recent immigrants who are less likely to be eligible for government assistance programs). With the Bureau’s more extensive use of administrative data in the 2020 Census for nonresponses, the Bureau may end up counting some groups very accurately, but still undercounting others. To the extent that California has more of these populations than other states, there could be a relative undercount in the state.
Immigrant Households May Be Even Harder to Count in 2020. Immigrants are considered a hard‑to‑count group, but in 2020, immigrant households may be even harder to count than they were in the past. In particular, there is concern that households with undocumented immigrants may be less likely to respond to the Census as a result of the added citizenship question and/or due to concerns about confidentiality. These changes could also affect response rates among immigrant households more broadly. Additionally, as mentioned earlier, the Bureau has found that immigrants are less likely to be represented in administrative data. While the Bureau can use statistical imputation to infer characteristics of immigrant households that do not respond to the Census and for which there is no administrative data, to the extent that they are households with more complex living situations than surrounding households (such as larger in size or multigenerational) they may still be undercounted.
The Census Bureau and Complete Count Committee May Face Staffing Issues. Both the federal and state governments will conduct major Census‑related operations and outreach in California in 2020. These efforts require hiring tens of thousands of federal Census workers to help count people, as well as thousands of state and nonprofit staff to conduct outreach and community education. If the economy is still expanding, the low unemployment rate may make it difficult for both federal and state governments to hire enough staff. In fact, a report by the Government Accountability Office released in mid‑2018 noted that the Bureau is already seeing signs it will face staffing challenges in a tighter labor market. The report notes that “in early hiring for 2020, Bureau officials reported smaller than expected applicant pools, declined offers, and turnover.”
Possible Undercount Scenarios for 2020
In October 2018, the Public Policy Institute of California (PPIC) published a report looking at two undercount scenarios for the state in 2020. In the first scenario, based on population projections of different demographic groups, the researchers estimate the effect of an undercount in 2020 similar to the undercount in 1990. (That is, PPIC assumes the groups undercounted in 1990 would be undercounted at similar rates in 2020.) In this scenario, as shown in Figure 6, California would experience an undercount of 1.1 million people (2.8 percent). Under a second scenario, the researchers estimate the size of a potential undercount if households with at least one undocumented immigrant are undercounted by 10 percent across the nation. Under this scenario, California would experience an undercount of about 500,000 people (1.3 percent). PPIC does not draw any conclusions about the relative likelihood of either of these scenarios occurring in 2020.
Figure 6
Estimates on Different Undercount Scenarios
|
Baseline |
Undercount Similar to 1990 |
Immigration‑Related Undercount |
|||||||
|
Projected 2020 Population |
Population |
Number Undercount |
Percent Undercount |
Population |
Number Undercount |
Percent Undercount |
|||
|
California |
40,556,804 |
39,421,783 |
1,135,021 |
2.80% |
40,040,275 |
516,529 |
1.27% |
||
|
United States |
331,928,837 |
324,911,205 |
7,017,632 |
2.11 |
329,672,486 |
2,256,351 |
0.68 |
||
|
Note: Estimates from Public Policy Institute of California. |
|||||||||
Size of 1990 Undercount Unlikely to Occur in 2020. While we think a relative undercount of California in 2020 is plausible, it seems unlikely that it would be as large as the undercount in 1990. First, researchers have estimated that, nationally, the Census has become more accurate over time, as shown in Figure 7. Second, while the Census experienced funding issues that limited some of its planning activities, the Census has now received its requested funding for 2018 and has resumed normal operations. Finally, technology, survey methods, and statistical imputation techniques have progressed substantially since 1990, resulting in far more accuracy in annual population estimates. (The U.S. Supreme Court has ruled that the Bureau can use imputation to complete the count.) The use of administrative records and, potentially, imputation, would allow the Bureau to be aware of, and correct, any serious miscounts. As such, it seems unlikely an undercount of over 1 million Californians would occur. That said, a scenario in which a subset of California’s immigrants and other hard‑to‑count populations are undercounted is plausible.
Implications of the Count for Congressional Representation
In this section, we discuss the potential implications of an undercount for California’s representation in Congress. First, we discuss the implications of an undercount for the total number of congressional representatives from California. Second, we discuss the implications of an undercount for the distribution of congressional representation within the state.
Number of Congressional Representatives From California
Number of Congressional Seats Per State Determined by Formula. The U.S. Constitution requires the use of population counts from each decennial Census to distribute (apportion) House seats among the states. Historically, five different methodologies have been used to determine how to use the Census data to apportion congressional seats. Since 1940, a mathematical formula has been used to determine the priority of awarding an additional seat to each state. This methodology is referred to as the “Method of Equal Proportions.” Essentially, the formula determines which state has the highest priority to receive an additional seat in the House until all seats have been assigned.
A State’s Population Growth Relative to Others Determines Its Priority to Receive a Seat. With a state’s population—determined by the Census—being the only input into the formula, states effectively compete against one another for seats based on their population. A state’s population growth relative to other states determines whether a state gains or loses a seat. Consequently, a state’s population growth in isolation—without considering the growth in other states—cannot predict whether a state will lose, maintain, or gain a seat.
States Can Receive Fewer Seats Than They Should. Because apportionment is based on relative population growth determined by the Census, an undercount in one state relative to other states can result in that state losing or not gaining seats that actually should be allocated to it. For example, if the Census undercounts one state by more than others, it could fail to gain a seat that it should have gained. A state also could inappropriately gain—or fail to lose—a seat if the count is accurate there but undercounted elsewhere. Overall, an accurate population count for all states is the best way for a state to avoid potentially losing or not gaining seats that actually should be allocated to it.
California Has Never Lost a Seat. For most of its history, California’s population has grown faster than other states, which has been reflected in Census population counts. This relative population growth resulted in California’s representation in the House growing from 2 seats (out of 234 total seats) in the 1850s to 53 seats following the 2000 Census. California has never lost a seat. In the case of the past apportionment (following 2010), California’s population had grown, but the state’s population growth was not sufficient relative to the growth in other states for California to gain a seat.
Past Census Undercount Likely Resulted in California Not Gaining a Seat. The 1990 Census was the least accurate of the past three Censuses—it resulted in a net average undercount of 1.59 percent across all the states. The undercount in California—at 2.74 percent—was worse than the national undercount. Although California gained seats following the 1990 Census (increasing from 45 seats to 52 seats), California likely would have received at least one more seat if the state’s count was as accurate as the national count.
California Likely to Maintain 53 Seats if Population Count Is Accurate in 2020. Whether California loses, maintains, or gains a congressional seat depends on two factors: (1) the relative growth of California compared to other states and (2) how accurately that growth is reflected in the Census. Estimates suggest that California’s population has increased since the 2010 Census—although at a lower rate than other states since 2010. In the PPIC’s analysis referred to previously, PPIC concludes that California will likely maintain its current number of seats (53), assuming that current population trends continue and the 2020 Census count is accurate. The states most likely to gain at least one seat include Oregon, Arizona, Colorado, Texas (likely to gain three seats), North Carolina, and Florida (likely to gain two seats).
Scenario in Which California Loses a Congressional Seat Seems Relatively Unlikely. Based on the PPIC’s analysis, California would have to experience a very significant undercount in order to lose a seat. PPIC estimates that California would lose one seat if it both experienced a similar undercount to the 1990 Census and households with at least one undocumented immigrant were undercounted by 10 percent (the scenarios from Figure 6). In each of these scenarios alone, California would maintain its current number of seats. This means that even a significantly large undercount, like the one that occurred in 1990, would be insufficient for California to lose a seat. While certain immigrant households may be undercounted at a higher rate in 2020 relative to past Censuses, whether the undercount rate will be higher or lower than PPIC’s estimate is unknown. However, as discussed earlier, we think an undercount in 2020 similar to the 1990 Census is unlikely. Because both scenarios would be required, we think California losing a seat as a result of an undercount is quite unlikely.
Representation Across Regions Within State
Division of Congressional Seats Within State Important for Representation. In California, the boundary lines for the U.S. House of Representatives districts, along with the state Legislature (Assembly and Senate) and Board of Equalization districts, must be adjusted every ten years following the decennial Census. This process is known as “redistricting.” Because people move between Census years, the primary purpose of redistricting is to reestablish districts to be “reasonably equal” in population. California’s districts traditionally have been established by using population counts from the Census. While it is important that California be apportioned an appropriate number of seats in the House, distributing congressional seats within the state in such a way that Californians have equal representation relative to other Californians also is important.
Citizens Redistricting Commission Establishes Boundaries of Congressional and State Districts. In 2008, the voters passed Proposition 11, establishing the Citizens Redistricting Commission (the Commission). A subsequent measure, Proposition 20 in 2010, expanded the duties of the Commission. The Commission is an independent, bipartisan commission that determines the boundaries for the state’s districts. The Commission has only drawn district boundaries once—following the 2010 Census. The Commission members who will determine district boundaries following the 2020 Census will be new members (the 2020 Commission will be selected by August 15, 2020).
Regional Under/Over Counts Can Skew Congressional Representation Within the State. Whether or not California experiences a net undercount, the accuracy of the Census will vary across regions within the state. Specifically, regions with a larger share of hard‑to‑count populations likely will experience a higher undercount relative to regions with a smaller share of hard‑to‑count populations. (Meanwhile, some regions could experience overcounts.) In its report, PPIC estimates that large undercounts are most likely to occur in portions of Los Angeles, the San Joaquin Valley, and the Bay Area. If these regions are significantly undercounted, they could have less congressional (and state legislative) representation relative to what they should receive.
Commission Not Explicitly Barred From Using Other Population Data for Redistricting. During the last redistricting process in 2010, the Commission relied exclusively on Census population counts to determine population levels in each district, which are intended to be reasonably equal in population. However, the Commission also solicited significant input from the public to gather information to ensure that the district boundaries adhered to other state constitutional requirements (such as ensuring communities of interest were kept together). Although the U.S. Constitution is clear that a state’s total number of House seats can only be based on the Census, there is no explicit requirement for states to use the Census population counts for redistricting. That is, if there were evidence some regions of the state were undercounted, the Commission would not be prohibited from using other population data to inform the redistricting process.
Commission Would Need to Use Very High Quality Data to Replace Census Data. That being said, we are not sure what alternative data would be reliable and comprehensive enough to supplant or supplement the population counts from the Census. (There are no publicly accessible population estimates that are as geographically detailed and more reliable than the decennial Census.) One possible alternative source is the data from the Bureau’s detailed post‑count surveys, some of which are public and some are not. We do not know what internal survey data the Bureau will collect after 2020 beyond those that are planned to be released publically. Ultimately, it will be up to the Bureau to determine what level of detail to release. Once the 2020 Commission is selected (by August 15, 2020), if there were evidence that some regions within the state were undercounted relative to others, the Commission would need to decide how it would address the undercount and what alternative data source, if any, to use to inform the redistricting process.
Implications of the Count for Federal Funding to California
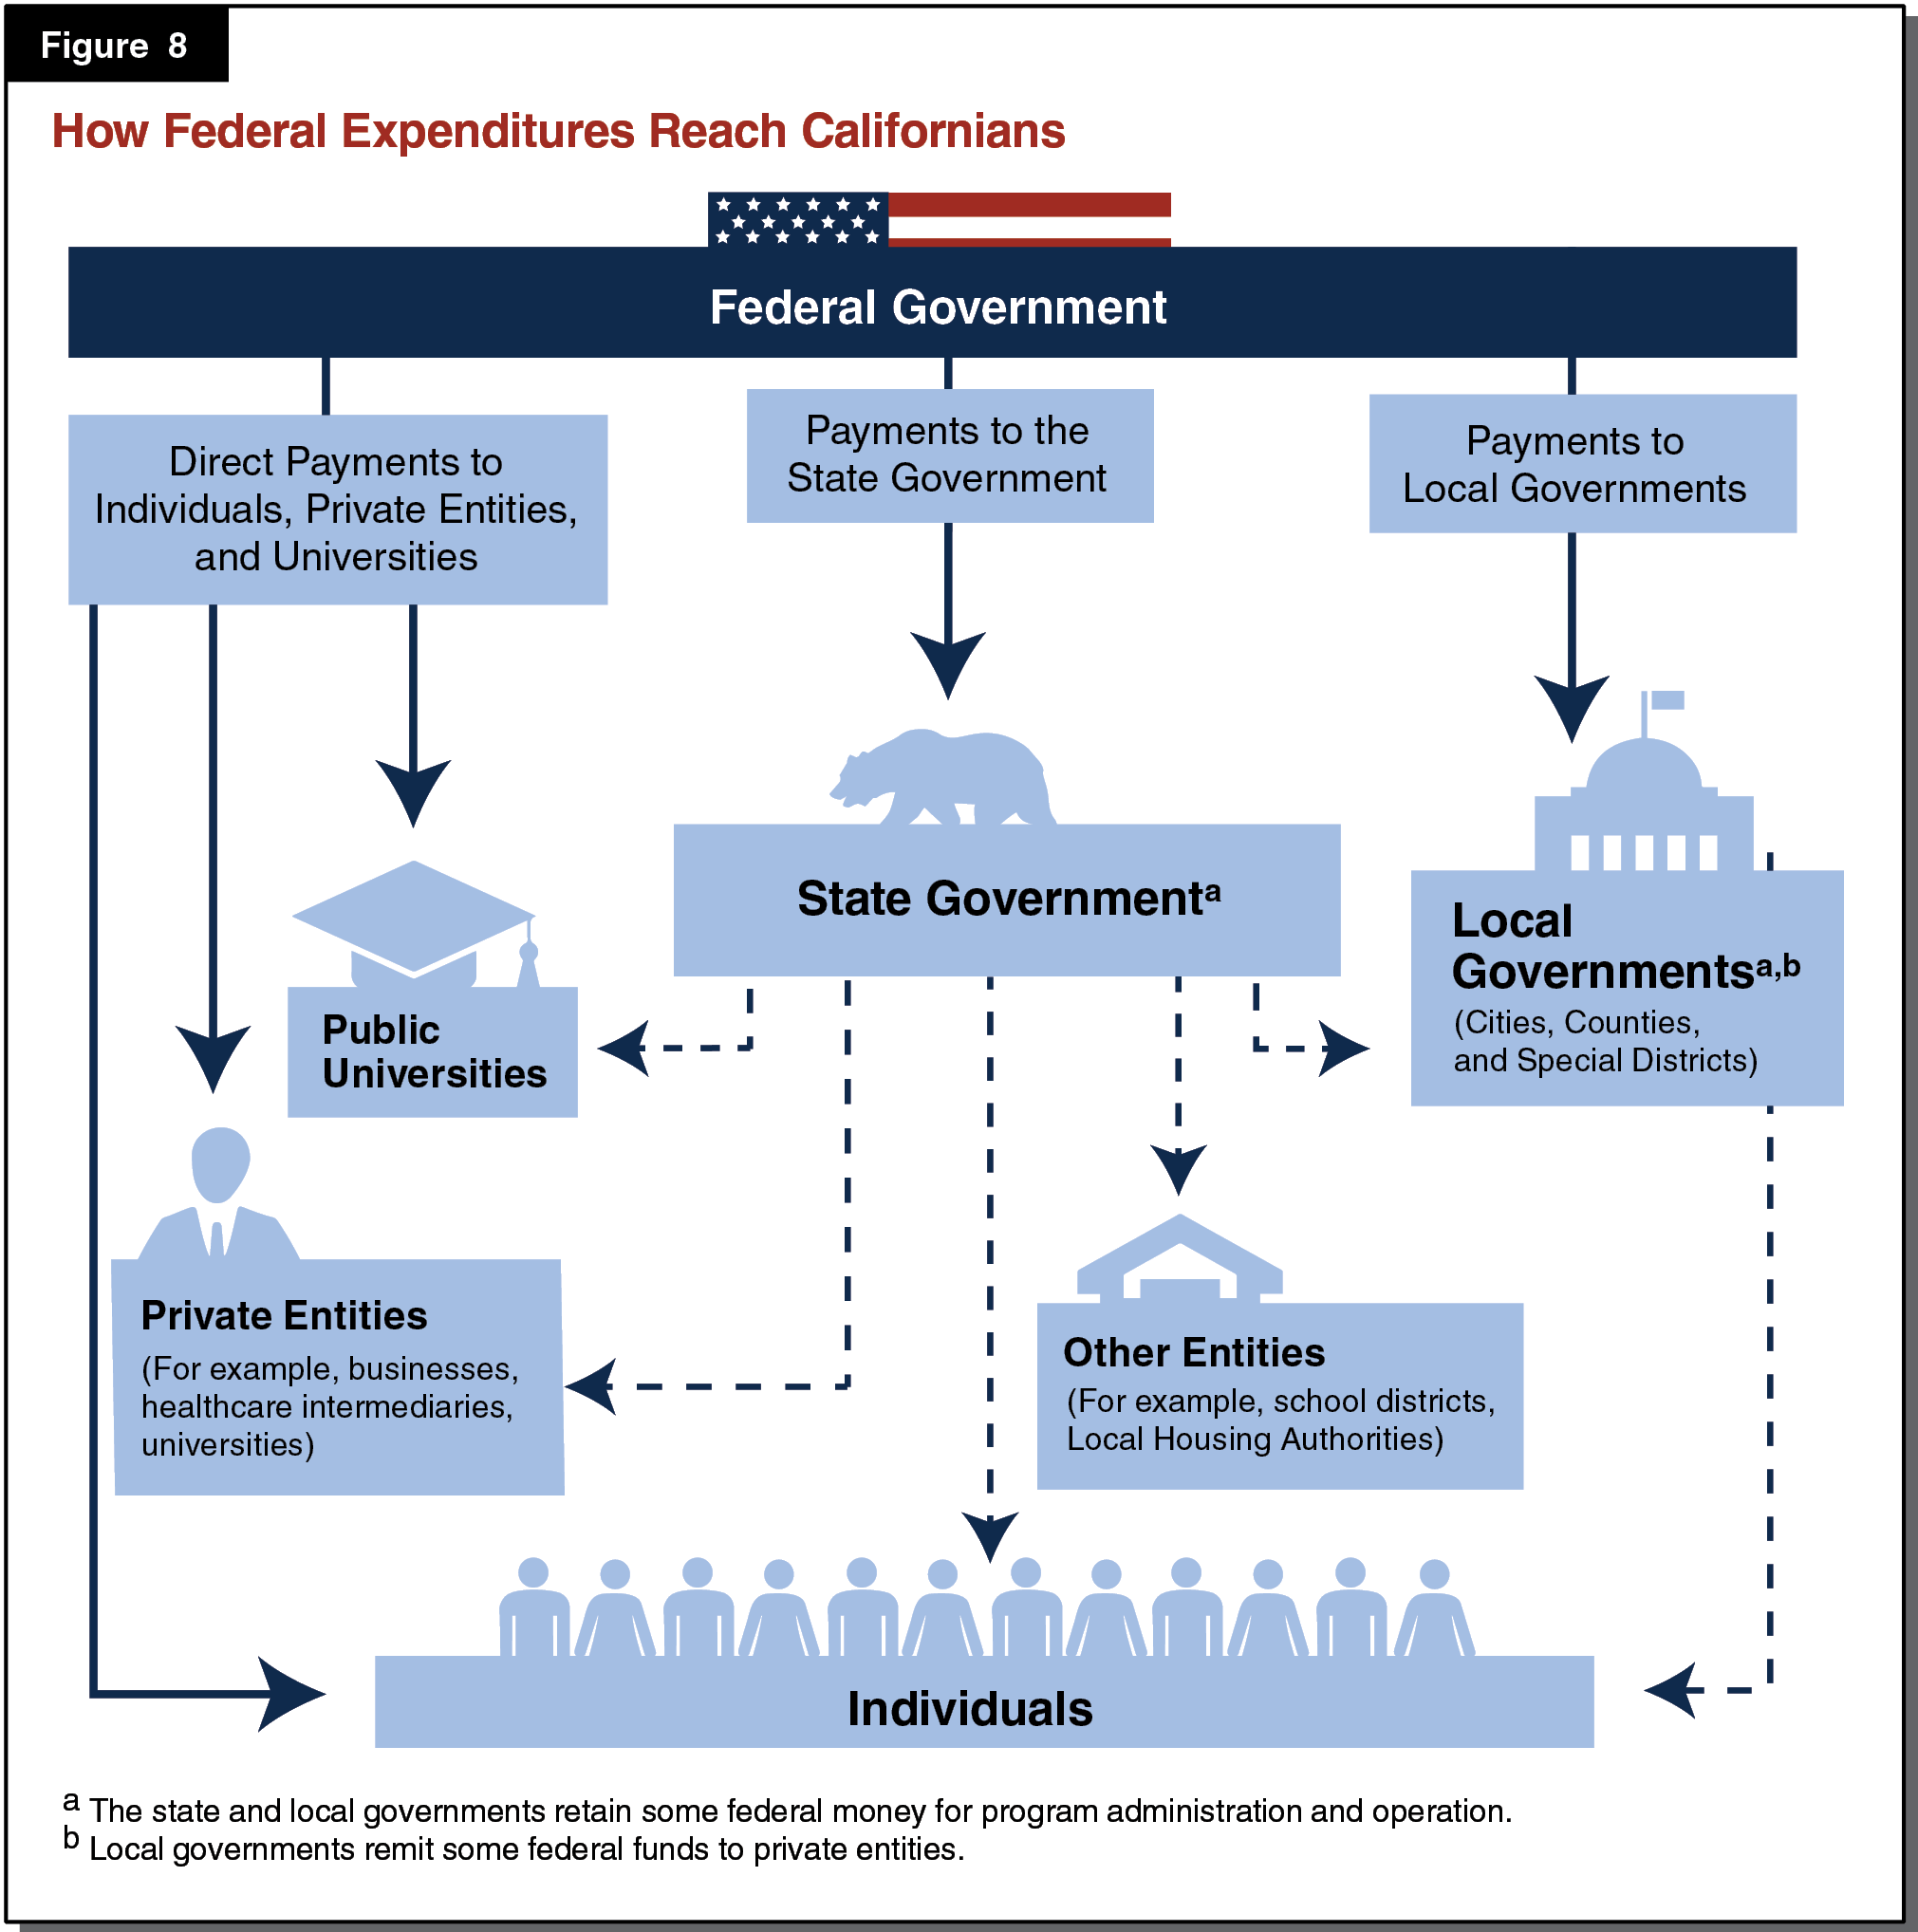
As Figure 8 shows, federal funds reach Californians through a variety of pathways. In 2017, our office estimated that the total amount of federal spending in California several years ago was very roughly $375 billion. Most of this federal spending (nearly 80 percent) is distributed directly to individuals and would therefore be unaffected by population estimates. Some money reaches Californians by passing through state and local governments or other entities—a portion of which could be affected by population estimates. This section of the report focuses only on federal funds that are distributed first to state government (and excludes funding distributed directly to local governments). In particular, we discuss why an undercount in California is not likely to have a large impact on federal funding.
How Federal Formulas Typically Use State Population to Determine Funding Levels. Some programs are distributed to the state based on a formula that considers population, among other factors. (Other program funding is distributed based on a competitive grant process or through performance metrics. For these programs, changes in estimated population would not have a direct effect on federal grants to the state.) Most of these formulas are set in federal statute. Consequently, this means that congressional action would be needed for the federal government to change these funding formulas or allow the use of alternative population estimates.
Some Programs Rely on Counts of Specific Populations. While some federal funding formulas use total state population, others rely on regional or population counts of certain groups to inform funding levels. These funding formulas are typically used for programs that target certain types of areas, such as urban and rural areas, or certain populations, such as low‑income families or children. For example, the Child Abuse Prevention and Treatment Act funding is primarily allocated to each state or territory based on its share of the child population (under age 18) relative to other states and territories. For some programs, these targeted areas or populations are considered hard to count.
Implications of Undercount for Overall Federal Funding
After the undercount in 1990, California lost over $200 million in federal funds in a single fiscal year. (For comparison, the state budget received roughly $25 billion in federal funds in state fiscal year 1990‑91, so this loss would represent slightly less than 1 percent of the total.) However, this loss of funds would be unlikely to occur again in 2020 even if an undercount were as large. Below, we explain why.
Vast Majority of Federal Funding to the State Would Be Unaffected by an Undercount in 2020. In 2016‑17, the state budget received about $93 billion in federal funds for all state programs. Most of this total, about $50 billion, is allocated to the state without reference to population estimates, and would therefore be unaffected by an undercount in 2020. These funds are sometimes allocated to states on a fixed level defined in federal rules or based on performance or cost‑sharing. For example, the federal government provides California with a fixed annual amount of $3.7 billion for the federal Temporary Assistance for Needy Families program regardless of how population changes. Or, when California faces a natural disaster, the federal government provides hundreds of millions or billions of dollars for emergency assistance and remediation efforts based on the costs to respond to the disaster, not the state’s population. The remaining $43 billion in federal funds—for an estimated 51 federal programs—are based on formulas that take population estimates into account, among many other factors. Although these programs have federal funding formulas that factor in population, nearly all of this funding would not be affected by an undercount in the 2020 Census, as we explain below.
Several Reasons Remaining Federal Funding Would Be Almost Entirely Unaffected by an Undercount. An undercount of the state’s population would leave the $43 billion in federal funding almost entirely unaffected. The reasons for this are:
- An Undercount Would Have No Effect on Federal Medicaid Funds Provided to California. The state’s Medicaid program, Medi‑Cal, represents roughly $35 billion—nearly 80 percent—of the total 2016‑17 federal funding potentially affected by an undercount. (This is the estimated amount of federal funding for Medi‑Cal that is informed by the state’s population count—the state receives additional funding for Medi‑Cal that is not informed by the state’s population.) As described in the nearby box, because California already receives the minimum amount under the current statutory formulas, it would be impossible for an undercount of California’s population to result in less federal Medi‑Cal funding.
- Population Is One Factor Among Many in Federal Allocation Formula. For many programs, population is one factor among many in a complicated formula used to determine the amount of federal funding provided to states. In these cases, changes in state population estimates have little effect on the overall funding amount. For example, the second largest federal funding amount based in part on population is Title I education grants (the state received $1.8 billion in these grants in FFY 2016‑17). These grants are distributed in part based on the number of low‑income children that live in various parts of the state. As described in the box below, a significant undercount of children could indirectly affect this funding level, but the magnitude of the effect would likely be very low (perhaps a few millions of dollars).
- Federal Allocation Formula Has Minimum Levels. In other cases, programs have “allocation floors,” usually based on past expenditure levels, and California’s funding level is already at that minimum level. For example, after Medi‑Cal and Title I education grants, the next largest federal funding program based on population is the special education funding through the Individuals With Disabilities Education Act (IDEA). States’ IDEA grants are based, in part, on their respective shares of children ages 3‑21. IDEA also includes minimum thresholds, including a hold harmless provision that prevents a state’s allocation from declining year over year. In FFY 2017‑18, California received $1.3 billion in IDEA grants, already at a minimum allocation floor. As a result of this provision and the hold harmless provision, even a significant undercount of California’s children would be unlikely to result in less IDEA funding for the state.
- Program Is Relatively Small. In other cases, population may be an important determinant of formula‑driven spending, but the programmatic spending total is small. For example, 75 percent of state and community highway safety grants are distributed based on population. California received $23 million for these grants in 2016‑17, meaning a relative undercount of the state of 2 percent could result in a few hundred thousand dollars less in funding—a very small amount in budgetary terms.
- Federal Allocation Formula Uses Annual Population Estimates. Most programs that receive federal funding based on population either use annual population estimates or annual demographic surveys, rather than the decennial Census, as population inputs in their funding formulas. For annual population estimates, the Bureau adjusts the most recent decennial Census counts based on the number of births, deaths, and net migration, as well as some other information. Through these adjustments, the Bureau has some flexibility to adjust its annual population estimates to reflect new information about underlying population counts. So, an undercount could affect federal spending right after the decennial Census, but these effects would not likely persist throughout the decade.
An Undercount Would Not Affect Federal Medi‑Cal Funding
Medi‑Cal Funding Based on the FMAP Formula. Medicaid—or Medi‑Cal, as it is known in California—is a federal match program, meaning that program costs are shared between the state and the federal government. The federal share of costs for Medicaid is commonly referred to as the federal medical assistance percentage (FMAP) and varies by state. The FMAP cannot be less than 50 percent or more than 83 percent. The FMAP is calculated from a formula that takes into account the average personal income divided by the Bureau’s estimate of its total population of each state relative to the national average. States with per capita incomes above the national level receive a lower FMAP rate, while states with per capita incomes below the national level receive a higher FMAP rate. In addition to Medi‑Cal, the FMAP informs the federal share of cost for other social services programs, including foster care and adoption assistance payments.
California’s FMAP Expected to Remain at Federally Required Minimum Level. Using current data projections and the statutory formula, California’s raw federal fiscal year (FFY) 2019‑20 FMAP would be 40.49 percent. Given that the FMAP cannot fall below 50 percent, California’s FMAP in FFY 2019‑20 would remain at the minimum level. As a result, it would be impossible for an undercount to result in less federal Medi‑Cal funding. For the state to receive an increase in its FMAP, it must experience a decline in its average per capita income, meaning either its population increases or total personal income decreases relative to the nation. For California’s FMAP to increase the Census would need to show that the state’s current population (39.8 million residents in 2018) increased by several millions of people in 2020, but personal income remained constant. Based on historic population growth trends (which have averaged in the hundreds of thousands per year) this scenario is nearly impossible.
Title I Education Grants
How the Title I Grants Work. Title I of the Elementary and Secondary Act of 1965 provides four main grants to local education agencies (LEAs). In federal fiscal year 2016‑17, California received $1.8 billion in these four Title I grants—representing nearly 12 percent of the total funds distributed. The formulas that determine the amount of a state’s allocation are complicated, but one important contributing factor is each LEA’s count of children ages 5‑17 who live in families with incomes at or below the poverty level. These grants also include hold harmless provisions that prevent a LEA from losing more than 15 percent of its preceding year’s Title I funds as a result of a drop in these populations.
How an Undercount Could Affect Title I Grant Funding to California. The number of children living below the poverty level is estimated by the U.S. Census Bureau (the Bureau) in an annual survey. The Bureau will eventually use the decennial Census to inform these annual surveys—for example, to know how many people to survey from different areas of the country. As a result, an undercount of children in the decennial Census could indirectly—but probably minimally—affect the estimate of children living under the poverty level in each LEA. A large undercount of children in California relative to the United States could affect the Title I calculation, but from a state perspective, the effects would be very small in dollar terms.
Figure 9 shows the likely effects of an undercount on federal funding for the largest ten programs we identified. Together, these ten programs account for nearly 95 percent of the estimated total federal funds ($43 billion) that are distributed to the state using population estimates. As the figure shows, most funding in these programs would be unaffected—or only very slightly affected—by a significant undercount.
Figure 9
Effect of an Undercount on Largest Ten Programs Distributed Using Population Estimates
|
Program |
Funding at Risk in an Undercount |
Reason(s) |
|
Medi‑Cal |
None |
State is funded at the minimum base FMAP. |
|
Children’s Health Insurance Program (CHIP) |
None |
State is funded at the lowest possible FMAP for CHIP. |
|
Title I Education Grants |
Low millions of dollars |
Population is one factor among many others. |
|
Special Education Grants to States |
Likely none |
Formula has minimum levels and California’s funding level is at one of those minimums. |
|
Child Care and Development Block Grant |
Low millions of dollars |
Population is one factor among many others. |
|
Vocational Rehabilitation State Grants |
Low millions of dollars |
Population is one factor among many others. |
|
Substance Abuse Block Grant |
Low millions of dollars |
Population is one factor among many others. |
|
Improving Teacher Quality State Grants (Title II) |
Low millions of dollars |
Population is one factor among many others. |
|
Social Services Block Grant |
Low millions of dollars |
Total federal funding for the program is relatively low. |
|
Low Income Home Energy Assistance Program |
Less than $1 million |
Population is one factor among many others. |
|
FMAP = federal medical assistance percentage. |
||
The State Could Lose Tens of Millions of Dollars in Federal Funds From a Significant Undercount. Other reports cite the entire amount of federal funding distributed to the state from programs that allocate funds based on population‑related formulas as the amount “at stake” as a result of a Census undercount. Only a very small portion of federal funding, however, would be affected by an undercount. In fact, we find that a significant undercount in the 2020 Census (such as the one that occurred in 1990) could reduce federal funding to the state government by tens of millions, not billions, of dollars. This represents about 0.04 percent of total federal funding to the state government. Given that we view a 1990 undercount as unlikely to occur again in 2020, this is likely a worst case scenario.
Conclusion
California Unlikely to Lose a Seat or Much Federal Funding Due to an Undercount. California could experience an undercount in the 2020 Census. For various reasons, an undercount as large as 1990, however, is unlikely. Past researchers have found that an undercount of this magnitude is insufficient, alone, for California to lose a congressional seat. As a result, the risk of California losing a congressional seat is low. Moreover, in a worst case scenario, an undercount could result in the state losing tens of millions of dollars—not billions of dollars—in federal funding. In budgetary terms, this amount of money is very small.
Complete and Accurate Count in 2020 Still Very Important. There are other reasons to minimize the possibility of an undercount and ensure an accurate count in 2020. As discussed earlier, certain regions in the state run a greater risk of being undercounted than others. As a result, an undercount of these regions could mean:
- A Misallocation of Representation Within the State. If some regions within the state are undercounted relative to others, they could end up with less congressional (and state legislative) representation relative to what they should receive.
- A Misallocation of Funding Within the State. Many local governments directly receive federal and state funds that are based on population counts, which we do not estimate here. As a result, the potential loss of funds due to an undercount may have a greater impact on certain localities and their budgets relative to our state‑level analysis. Although, given that this issue has not been investigated in depth, the potential effect on local governments is unknown.