LAO Contacts
- Kenneth Kapphahn
- Overview of Spending Package
- Minimum Guarantee
- Proposition 98 Budget Planning
- Proposition 98 True‑Ups
- Ryan Anderson
- Local Control Funding Formula
- Special Education
- County Offices of Education
- Amy Li
- Education Mandates
- School Facilities
(2/14/19 -- Adjusted when Proposition 51 funding would be exhausted given proposed pace of bond sales.)

February 13, 2019
The 2019-20 Budget
Proposition 98 Analysis
- Introduction
- Overview of Spending Package
- Minimum Guarantee
- Proposition 98 Budget Planning
- Proposition 98 True‑Ups
- Local Control Funding Formula
- Special Education
- County Offices of Education
- Education Mandates
- School Facilities
- Summary of Recommendations
Executive Summary
In this report, we assess the architecture of the Governor’s overall Proposition 98 budget and analyze his specific proposals for K‑12 education.
Overall Proposition 98 Budget
$2.9 Billion in New Proposition 98 Spending Proposals. These proposals consist of $2.8 billion for K‑12 schools, $367 million for the California Community Colleges, and a $289 million downward adjustment to account for cost shifts. Nearly all new spending is for ongoing commitments, including $2.5 billion to cover an estimated 3.46 percent cost‑of‑living adjustment (COLA) for the Local Control Funding Formula (LCFF) and other K‑14 programs. Total K‑12 funding per student would grow to $12,018 in 2019‑20, an increase of $444 (3.8 percent) over the revised 2018‑19 level.
Prepare for Possibility That Proposition 98 Funding Is Somewhat Lower by May. Economic events occurring after the development of the Governor’s budget suggest that estimates of the guarantee could be revised down somewhat in the coming months. Coupled with our estimate of higher program costs, the Proposition 98 budget could be tighter by May. To prepare, the Legislature may want to begin identifying proposals it would be willing to reject or reduce. We also think the Legislature should consider building a budget cushion by replacing some of the Governor’s new ongoing commitments with one‑time initiatives.
Undoing Proposition 98 True‑Up Process Makes Future Budget Balancing More Difficult. The 2018‑19 budget plan created a Proposition 98 true‑up process to make unexpected changes in the minimum guarantee and the associated funding adjustments somewhat less disruptive for schools and the state. The Governor proposes to undo this true‑up process and prohibit downward adjustments to school funding for the prior year. Though a benefit for schools, the proposal would make balancing the state budget during an economic downturn even more difficult. We recommend rejecting the Governor’s proposal and retaining the true‑up process.
Key Messages on K‑12 Proposals
Recommend Rejecting Automatic LCFF COLA and Proposed COLA Cap. Last year, the state enacted a statutory provision that provided an automatic COLA for LCFF going forward. The administration now proposes another formula capping the LCFF COLA at the growth rate in the Proposition 98 minimum guarantee. The administration’s proposal is an acknowledgement of the state’s experience over the past 30 years—when it has not funded the full K‑12 statutory COLA about one‑third of the time. Rather than budget by layers of self‑imposed formulas, we recommend the Legislature make decisions about the LCFF COLA annually based upon all key budget factors and priorities at that time.
Proposed Special Education Concentration Grants Are Unlikely to Achieve Core Objectives. The administration proposes providing $577 million ($390 million ongoing, $177 million one time) to districts serving large concentrations of students with disabilities, English learners, and low‑income students. The funds would be distributed through a new categorical program, with a special allocation formula and spending rules. Creating a new categorical program works counter to the administration’s stated policy goals of improving coordination between general and special education, reducing complexity, and alleviating administrative burden. Additionally, through prior budget actions, the state already has expanded early intervention programs and established a support system for districts that have poor special education outcomes. For these reasons, we recommend rejecting the proposal and considering better alternatives for augmenting special education funding.
Consider Two Better Options for Addressing Key Special Education Issues. If the Legislature wishes to increase funding for special education, it could equalize funding rates, which currently range from $500 to $900 per student for historical reasons. We estimate equalizing these rates at the 90th percentile of existing rates would cost $333 million. (Equalizing at the 90th percentile has been the state’s most common equalization approach.) The Legislature could spread this cost increase over several years. Alternatively, the Legislature could provide funding for preschool‑aged children with special needs. Depending upon specific implementation decisions, these added costs could range between $150 million and $500 million annually.
Recommend Taking Action to Stop Funding Inequities From Growing Among County Offices of Education (COEs). In 2013‑14, the state introduced a new funding formula for COEs that was intended to eliminate historical funding inequities. Despite this intention, the minimum state aid policy has resulted in increasingly large funding differences among COEs. Due to minimum state aid, 22 COEs currently are receiving more—some substantially more—than generated by the formula. These COEs have seen their funding grow at about twice the rate of COEs funded according to the formula. We recommend repealing the minimum state aid policy. This would produce savings in the low tens of millions each year initially, growing to low hundreds of millions over time. To minimize disruption, the Legislature could adopt a provision ensuring no COE receives less total funding than estimated under the 2018‑19 Budget Act. Though such a provision maintains unjustified funding inequities in the near term, it stops those inequities from growing.
School Facilities
No Concerns With Larger School Facilities Bond Sales. Proposition 51 (2016) authorizes the state to sell $7 billion in general obligation bonds for school facilities. The Governor’s budget proposes to issue $1.5 billion of these bonds in 2019‑20, compared to the $594 million issued in 2018‑19. Were the proposed pace of bond sales to continue moving forward, the state would exhaust Proposition 51 funding by 2022‑23 (over six fiscal years). We have no concerns with this proposal, as the faster pace would allow the state to clear the backlog of facility applications more quickly.
Recommend Rejecting the Associated Staffing Augmentation. The Governor proposes to provide ten new positions for the Office of Public School Construction (OPSC). The OPSC currently dedicates a relatively small share of its staff (less than 20 percent) to processing school facility applications. Given the recent decision to devolve audit responsibilities from OPSC to local auditors, OPSC also is performing fewer audits than it has in the past. As the agency can internally shift positions to reflect current priorities, including addressing the application backlog, we recommend rejecting the staffing increase.
Introduction
In this report, we analyze the Governor’s Proposition 98 budget package. The first four sections of the report focus on the architecture of the Proposition 98 budget, with an overview of the new Proposition 98 spending the Governor proposes, an assessment of the Governor’s estimates of the Proposition 98 minimum guarantee, a discussion of several factors that could affect the Legislature’s Proposition 98 budget planning in the coming months, and an assessment of the Governor’s proposal relating to Proposition 98 true‑ups. We dedicate the five remaining sections of the report to examining the Governor’s major proposals involving K‑12 education. Specifically, we analyze his proposals for (1) the Local Control Funding Formula, (2) special education, (3) county offices of education, (4) education mandates, and (5) school facilities.
Other Education Budget Analyses and Reference Material. Given the similarities with K‑12 education mandates, we cover community college mandates in this report, but we analyze the Governor’s other community college proposals in our forthcoming Higher Education Analysis. We cover the Governor’s proposal to create more full‑day kindergarten programs in our forthcoming Early Education Analysis. On the “EdBudget” portion of our website, we post dozens of tables containing additional detail about the Proposition 98 budget. In our recently released report, California’s Education System: A 2019 Guide, we provide considerable background information on the state’s students, staffing, schools, education programs, funding, and outcomes.
Overview of Spending Package
In this section, we describe the main features of the Governor’s Proposition 98 spending package and the resulting changes in per‑student funding levels.
Governor Proposes $2.9 Billion in New Proposition 98 Spending. This amount accounts for all new Proposition 98 spending across the 2017‑18 through 2019‑20 period. It consists of $2.8 billion for K‑12 education, $367 million for the community colleges, and a net downward adjustment of $289 million to account for cost shifts (Figure 1). The largest cost shift relates to the Governor’s proposal to cover a larger share of State Preschool costs with non‑Proposition 98 General Fund. Nearly all of the new Proposition 98 spending is for ongoing commitments, with only $198 million associated with one‑time initiatives.
Figure 1
Governor Proposes $2.9 Billion in New Proposition 98 Spending
Reflects Ongoing Commitments Unless Otherwise Noted (In Millions)
|
K‑12 Education |
|
|
COLA and attendance adjustments for LCFF |
$2,027 |
|
Special education grants ($187 million one time) |
577 |
|
COLA for select categorical programs |
187 |
|
Full‑year cost of previously approved preschool slots |
27 |
|
COLA and attendance adjustments for COEs |
9 |
|
School district accounting system replacement project (one time) |
3 |
|
Subtotal |
($2,830) |
|
California Community Colleges |
|
|
COLA for apportionments |
$248 |
|
College Promise fee waivers for second‑year students |
40 |
|
COLA for select student support programs |
32 |
|
Enrollment growth for apportionments |
26 |
|
Student Success Completion Grants caseload adjustment |
11 |
|
Legal services for undocumented students |
10 |
|
Subtotal |
($367) |
|
Accounting Shifts |
|
|
Three K‑12 initiatives shifted to Proposition 98 budget (one time) |
$8 |
|
Preschool costs shifted to non‑Proposition 98 budget |
‑297 |
|
Subtotal |
(‑$289) |
|
Total Spending Proposalsa |
$2,908 |
|
aReflects all proposals scored to 2017‑18, 2018‑19, 2019‑20, or prior years. COLA = cost‑of‑living adjustment (3.46 percent); LCFF = Local Control Funding Formula; and COEs = county offices of education. |
|
Covering Cost‑of‑Living Adjustments (COLA) Accounts for $2.5 Billion of New Spending. Most of the new spending in the Governor’s budget is dedicated to covering a 3.46 percent COLA for certain education programs. Specifically, the budget includes an associated $2 billion for the Local Control Funding Formula (LCFF), $248 million for community college apportionments, and a combined $228 million for 14 other school and community college programs (including special education, preschool, and adult education).
Two Notable Policy Proposals Account for Most Other New Spending. The Governor proposes new special education grants totaling $577 million ($390 million ongoing and $187 million one time) for school districts with relatively high numbers of low‑income students, English Learners, and students with disabilities. Districts could use these grants for (1) special education services for students with disabilities or (2) early intervention programs for students not currently receiving special education services. The Governor also proposes a $40 million increase for the College Promise program. Under this program, enrollment fees can be waived for students without demonstrated financial need who attend their first year of community college on a full‑time basis. The Governor’s budget would expand the program to cover a second year of enrollment fees for these students. (For a description and summary assessment of the Governor’s non‑Proposition 98 proposals relating to district pension costs and liabilities, see the box below.)
Governor’s CalSTRS Proposals
District Pension Costs Are Rising. Pension benefits for teachers and other certificated school employees are administered by the California State Teachers’ Retirement System (CalSTRS). These benefits are funded by contributions from school employees, districts, and the state. CalSTRS currently has a large unfunded liability—essentially, an actuarial estimate (based on many assumptions) of the difference between the cost of future pension benefits and the assets available to pay for those benefits. In 2014, the Legislature enacted a funding plan that increased contributions from all three parties. Under the plan, district contribution rates have grown from 8.3 percent of payroll in 2013‑14 to 16.3 percent in 2018‑19. Districts’ associated costs have grown from $2.3 billion to $5.7 billion.
Budget Provides $700 Million for District Rate Relief. The Governor proposes providing an estimated $700 million over the next two years (about $350 million per year) to provide school and community college districts with pension rate relief. Specifically, the payments would reduce districts’ CalSTRS rates in 2019‑20 and 2020‑21—freeing up resources for other parts of districts’ operating budgets. Under current law, district rates are scheduled to grow to 18.1 percent of payroll in 2019‑20 and 19.1 percent in 2020‑21. Under the proposal, district rates would be 1 percentage point lower—growing instead to 17.1 percent of payroll in 2019‑20 and 18.1 percent in 2020‑21.The state would make the $700 million payment from General Fund resources outside of the Proposition 98 minimum guarantee.
Administration Proposes District Rate Relief When School Funding Is at Historically High Level and Growing. Most districts identify rising pension costs as one of their most significant fiscal challenges. School funding, however, has grown by nearly $22 billion (37 percent) over the past six years, significantly outpacing growth in pension costs. Under the Governor’s budget, school and community college funding continues to grow, increasing a projected 3.6 percent and reaching an inflation‑adjusted all‑time high. Though districts view rising pension costs as difficult to manage today, these difficulties would be more pronounced if the state were to enter a recession and Proposition 98 funding were to drop.
Consider Setting Aside Funding for Paying Future Pension Costs. Rather than providing districts with budget relief over the next two years, the state could modify the Governor’s proposal to provide budget relief during the next economic downturn. Under this alternative, the state would set aside funds for future district pension costs. Later, during a downturn, the Legislature could use the additional funds to pay a portion of district pension costs. Such an approach would provide districts budget relief at a time when they would be facing even more difficult budget choices.
Governor Also Has a Proposal Focused on Districts’ Share of the Unfunded Liability. The Governor also proposes a $2.3 billion payment to reduce districts’ share of the CalSTRS unfunded liability (currently about $71 billion). This proposal means the state would pay a larger share of the unfunded liability than assigned to it under the 2014 CalSTRS funding plan. According to estimates produced by CalSTRS’ actuaries, this payment would reduce the district contribution rate by four‑tenths of a percentage point beginning in 2021‑22. The Legislature’s decision about whether to adopt this proposal is likely to revolve around its willingness to assume additional responsibility for district liabilities at a time when the state has many other debts and liabilities. We describe this proposal in our recently released report, Structuring the Budget: Reserves, Debt and Liabilities.
Funding Per Student Grows Moderately Year Over Year. Figure 2 shows the overall distribution of Proposition 98 funding by segment over the budget period. Under the Governor’s budget, K‑12 funding per student increases from the revised 2018‑19 level of $11,574 to $12,018 in 2019‑20, an increase of $444 (3.8 percent). Community college funding per full‑time equivalent (FTE) student increases from $8,099 to $8,306 in 2019‑20, an increase of $207 (2.6 percent).
Figure 2
Proposition 98 Funding by Segment
(Dollars in Millions Except Funding Per Student)
|
2017‑18 |
2018‑19 |
2019‑20 |
Change From 2018‑19 |
||
|
Amount |
Percent |
||||
|
Segment |
|||||
|
K‑12 Educationa |
$66,778 |
$68,693 |
$71,242 |
$2,549 |
3.7% |
|
California Community Colleges |
8,720 |
9,174 |
9,438 |
264 |
2.9 |
|
Totals |
$75,498 |
$77,867 |
$80,680 |
$2,813 |
3.6% |
|
Enrollment Estimates |
|||||
|
K‑12 attendance |
5,954,720 |
5,935,229 |
5,928,175 |
‑7,054 |
‑0.1% |
|
Community college FTE students |
1,125,224 |
1,132,757 |
1,136,214 |
3,457 |
0.3 |
|
Funding Per Student |
|||||
|
K‑12 Education |
$11,214 |
$11,574 |
$12,018 |
$444 |
3.8% |
|
California Community Colleges |
7,749 |
8,099 |
8,306 |
207 |
2.6 |
|
aIncludes funding for instruction provided directly by state agencies and the portion of State Preschool funded through Proposition 98. FTE = full‑time equivalent. |
|||||
Funding Per Student Reaches Historic High. Adjusted for inflation, the per‑pupil funding levels proposed by the Governor would be the highest since the passage of Proposition 98 in 1988. Compared to the previous all‑time high in 2000‑01, K‑12 funding would be up about $500 per student and community college funding would be up about $600 per student. (Both historical comparisons exclude funding associated with the Adult Education Program.)
Minimum Guarantee
In this section, we provide background on the Proposition 98 minimum guarantee. We then analyze the administration’s estimates of the guarantee and the changes that have occurred since June 2018.
Background on Minimum Guarantee
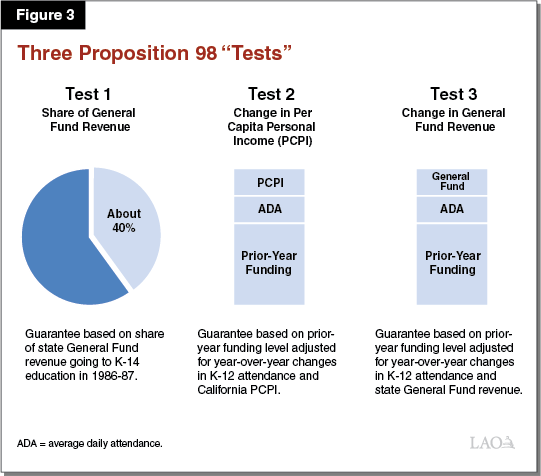
Minimum Guarantee Depends on Various Inputs and Formulas. The California Constitution sets forth three main tests for calculating the minimum guarantee. These tests depend upon several inputs, including K‑12 attendance, per capita personal income, and per capita General Fund revenue (Figure 3). Depending on the values of these inputs, one of the three tests becomes “operative” and determines the minimum guarantee for that year. Historically, Test 2 and Test 3 have been operative more frequently than Test 1. When Test 2 or Test 3 is operative, the minimum guarantee equals the amount of funding provided the previous year adjusted for changes in student attendance and a growth factor tied to per capita personal income (Test 2) or per capita General Fund revenue (Test 3). The state meets the guarantee through a combination of General Fund and local property tax revenue, with increases in property tax revenue usually reducing General Fund costs dollar for dollar. Though the state can fund schools and community colleges at a level higher than required by the formulas, the state typically funds at or near the guarantee. With a two‑thirds vote of each house of the Legislature, the state can suspend the guarantee and provide less funding than the formulas require that year.
Drops in Student Attendance Must Be Sustained to Affect Minimum Guarantee. Although the state adjusts the minimum guarantee for growth in student attendance whenever Test 2 or Test 3 applies, the State Constitution insulates the guarantee from reductions when attendance begins to decline. Specifically, the Constitution has a two‑year hold harmless provision that specifies that the minimum guarantee is not adjusted downward for declines in attendance unless attendance also has declined the two previous years.
“Maintenance Factor” Payments Required in Certain Years. In addition to the three main Proposition 98 tests, the Constitution requires the state to track an obligation known as maintenance factor. The state creates a maintenance factor obligation when Test 3 is operative (that is, General Fund revenue is growing relatively slowly) or when it suspends the guarantee. The obligation equals the difference between the actual level of funding provided and the Test 1 or Test 2 level (whichever is higher). Each year moving forward, the state adjusts any outstanding maintenance factor for changes in K‑12 attendance and per capita personal income. The Constitution requires the state to make maintenance factor payments when General Fund revenue grows relatively quickly. The magnitude of these payments is determined by formula, with stronger revenue growth generally requiring larger payments. These maintenance factor payments become part of the base for calculating the minimum guarantee the following year.
Administration’s Estimates of the Minimum Guarantee
2017‑18 Minimum Guarantee Revised Down $164 Million. Compared with the estimates made in June 2018, the 2017‑18 minimum guarantee has dropped $164 million (Figure 4). About half of this drop is related to lower student attendance. Whereas the June budget plan assumed attendance would increase slightly, the latest available data indicate a slight decline—making 2017‑18 the fourth consecutive year of decline. The state’s 2017‑18 maintenance factor obligation also is revised downward by $124 million to reflect various adjustments to the minimum guarantee for years prior to 2017‑18. The drops associated with attendance and the maintenance factor payment are partially offset by higher General Fund revenue. After updating estimates of LCFF and revising costs downward (largely due to lower‑than‑expected attendance), the Governor’s budget leaves Proposition 98 funding $44 million above the minimum guarantee. (As discussed in a later chapter, the Governor proposes to rescind the true‑up process enacted in June that would have automatically adjusted funding to match the lower guarantee.)
Figure 4
Tracking Changes in Proposition 98 Funding
(In Millions)
|
2017‑18 |
2018‑19 |
||||||
|
June 2018 Estimate |
January 2019 Estimate |
Change |
June 2018 Estimate |
January 2019 Estimate |
Change |
||
|
Minimum Guarantee |
|||||||
|
General Fund |
$53,381 |
$52,843 |
‑$538 |
$54,870 |
$54,028 |
‑$842 |
|
|
Local property tax |
22,236 |
22,610 |
374 |
23,523 |
23,839 |
316 |
|
|
Total Guarantee |
$75,618 |
$75,453 |
‑$164 |
$78,393 |
$77,867 |
‑$526 |
|
|
General Fund above guarantee |
$0 |
$44 |
$44 |
$0 |
$0 |
— |
|
|
Settle‑up payment for LCFF |
0 |
0 |
— |
0 |
475 |
475 |
|
|
Total Funding |
$75,618 |
$75,498 |
‑$120 |
$78,393 |
$78,342 |
‑$50 |
|
|
Operative “Test” |
2 |
1 |
— |
2 |
3 |
— |
|
|
LCFF = Local Control Funding Formula. |
|||||||
2018‑19 Minimum Guarantee Revised Down $526 Million. Compared with the estimates made in June 2018, the 2018‑19 minimum guarantee has dropped $526 million. This drop is mainly due to the downward revision to attendance estimates in 2017‑18 carrying forward and the attendance hold harmless provision not being applicable in 2018‑19. Another factor contributing to the drop is slightly slower year‑to‑year growth in General Fund revenue. The result of these changes, in combination with various smaller adjustments, is that school and community college funding is $475 million higher than the revised estimate of the guarantee. The Governor proposes to reclassify this funding as a settle‑up payment (discussed more in the next section). This action results in $475 million related to LCFF costs being taken “off books” in 2018‑19 and counted instead toward prior years (mainly 2009‑10).
2019‑20 Minimum Guarantee Up $2.8 Billion Over Revised 2018‑19 Level. The administration estimates that the 2019‑20 minimum guarantee is $80.7 billion, an increase of $2.8 billion (3.6 percent) over the revised 2018‑19 level (Figure 5). Test 1 is operative, with the guarantee receiving a fixed share (about 40 percent) of state General Fund revenue. Although the minimum guarantee is not growing as quickly as per capita personal income, the state creates no new maintenance factor (consistent with its recent practice in these situations). Regarding spending, the Governor’s budget dedicates virtually all of the new funding attributable to the 2019‑20 guarantee for ongoing purposes. Of the $2.8 billion total increase in 2019‑20, only $3 million is dedicated to one‑time initiatives. (All other one‑time funding is associated with earlier fiscal years.)
Figure 5
Proposition 98 Key Inputs and Outcomes
Under Governor’s Budget
(Dollars in Millions)
|
2017‑18 |
2018‑19 |
2019‑20 |
|
|
Proposition 98 Funding |
|||
|
General Fund |
$52,887a |
$54,028 |
$55,295 |
|
Local property tax |
22,610 |
23,839 |
25,384 |
|
Totals |
$75,498 |
$77,867 |
$80,680 |
|
Change From Prior Year |
|||
|
General Fund |
$2,648 |
$1,141 |
$1,268 |
|
Percent change |
5.3% |
2.2% |
2.3% |
|
Local property tax |
$1,207 |
$1,229 |
$1,545 |
|
Percent change |
5.6% |
5.4% |
6.5% |
|
Total funding |
$3,855 |
$2,370 |
$2,813 |
|
Percent change |
5.4% |
3.1% |
3.6% |
|
Operative Test |
1 |
3 |
1 |
|
Maintenance Factor |
|||
|
Amount created (+) or paid (‑) |
‑$1,201 |
$143 |
— |
|
Total outstandingb |
— |
143 |
$150 |
|
Growth Rates |
|||
|
K‑12 average daily attendance |
‑0.13% |
‑0.33% |
‑0.12% |
|
Per capita personal income (Test 2) |
3.69 |
3.67 |
5.07 |
|
Per capita General Fund (Test 3)c |
10.20 |
3.48 |
3.33 |
|
K‑14 cost‑of‑living adjustment |
1.56 |
2.71 |
3.46 |
|
aIncludes $44 million provided on top of the minimum guarantee. bOutstanding maintenance factor is adjusted annually for changes in K‑12 attendance and per capita personal income. cAs set forth in the State Constitution, reflects change in per capita General Fund plus 0.5 percent. |
|||
2019‑20 Guarantee Includes Adjustment for Shift of Preschool Funding. The Governor’s budget proposes to shift funding for part‑day State Preschool programs operated by certain entities (nonprofit agencies, county welfare departments, and cities) from the Proposition 98 to non‑Proposition 98 side of the budget. As a result of the shift, all part‑day and full‑day State Preschool funding for these entities would come from the non‑Proposition 98 side of the budget. (Preschool programs operated by school districts, county offices of education, and community colleges would remain funded within Proposition 98.) In tandem with this shift, the Governor proposes to “rebench” the minimum guarantee down by $297 million in 2019‑20 (reflecting the approximate cost of the programs being shifted after adjusting for growth and COLA).
Property Tax Revenue Revised Upward Over the Period. For 2017‑18 and 2018‑19, the administration revises its estimate of property tax revenue upward by $374 million and $316 million, respectively, largely to reflect updated data reported by schools and community colleges. For 2019‑20, the administration estimates that property tax revenue will grow $1.5 billion (6.5 percent) over the revised 2018‑19 level (Figure 5). This increase mainly reflects the administration’s estimate that assessed property values will grow 6.8 percent in 2019‑20, with somewhat slower growth in various smaller property tax components. Overall, we think the administration’s property tax estimates are reasonable given the current strength of the state’s real estate market. Over the three‑year budget period, the administration’s estimates are only $136 million (0.2 percent) below our November 2018 estimates.
Additional Proposition 98‑Related Funding
Budget Includes Settle‑Up Payment. The Governor’s budget provides $687 million as a settle‑up payment related to meeting the minimum guarantee in certain years prior to 2017‑18. Figure 6 shows the years for which the state owes settle‑up and how the proposed settle‑up payment would be used. The largest component of the payment is the $475 million to cover LCFF costs that otherwise would exceed the minimum guarantee in 2018‑19. The budget dedicates the rest of the payment to covering a portion of the proposed one‑time special education grants and a portion of ongoing Community College Strong Workforce Program costs. After making the $687 million settle‑up payment, the state would have paid off all Proposition 98 settle‑up obligations. In contrast to previous years, the settle‑up payment would not be scored as a Proposition 2 debt payment. (Technically, $654 million of the proposed settle‑up payment could be scored as a Proposition 2 debt payment.)
Figure 6
Outstanding Settle‑up Obligation and
Governor’s Payment Proposal
(In Millions)
|
Outstanding Settle‑Up by Year |
|
|
2009‑10 |
$435 |
|
2011‑12 |
48 |
|
2013‑14 |
172 |
|
2014‑15 |
32 |
|
2016‑17 |
1 |
|
Total |
$687 |
|
Settle‑Up Payment Proposal |
|
|
Ongoing 2018‑19 LCFF costs |
$475 |
|
One‑time special education grants |
178 |
|
Ongoing 2019‑20 CCC Strong Workforce Program costs |
34 |
|
Total |
$687 |
|
LCFF = Local Control Funding Formula and CCC = California Community Colleges. |
|
Proposition 98 Budget Planning
In this section, we describe how the Proposition 98 budget picture could change over the coming months. First, we explain how potential reductions in state revenue could lead to a lower minimum guarantee in 2018‑19 and 2019‑20. Next, we identify some additional Proposition 98 costs that are likely to emerge in the coming months. Finally, we discuss how the Legislature might begin preparing for these changes.
State Revenue and the Minimum Guarantee
State Revenue Estimates Could Be Somewhat Lower by May. Although the administration’s revenue estimates are consistent with the economic data that was available when the Governor’s budget was prepared, those estimates do not account for some recent developments. Notably, stock prices fell sharply at the end of 2018. Although financial markets have recovered somewhat, capital gains revenue estimates in May still could be lower than the January estimates. In addition, state tax collections in January—one of the most important months for personal income tax collections—were about $2 billion below the estimates in the Governor’s budget. Income tax collections at the federal level were strong, however, and we think some portion of the shortfall is likely to be made up in April. Finally, some recent data suggest growth in the state economy could be slowing. Home sales and building construction slowed at the end of 2018 and claims for unemployment benefits have ticked up slightly in recent months.
Minimum Guarantee Is Sensitive to Revenue Changes in 2018‑19 and 2019‑20. If revenue were to decrease (or increase) by May, any changes would have corresponding effects on the minimum guarantee. For 2018‑19, the guarantee drops about 55 cents for each dollar of lower revenue. On the upside, the guarantee increases about 55 cents for each dollar of the first $250 million in higher revenue. Revenue increases beyond $250 million would not increase the guarantee, as Test 2 would become the operative test. For 2019‑20, the guarantee drops or increases about 40 cents for each dollar of lower or higher revenue. The guarantee in 2019‑20 is not likely to depend upon the prior‑year level of Proposition 98 funding, as Test 1 is likely to be operative. This means a one‑time revenue drop in 2018‑19 would not have an interactive effect on the 2019‑20 guarantee. (For this revenue sensitivity analysis, we hold all Proposition 98 inputs other than revenue constant. Although the other inputs are less volatile than General Fund revenue, they too are likely to change over the coming months.)
A Few Scenarios Illustrate the Effect of Revenue Changes on the Minimum Guarantee. Figure 7 shows the interaction between state revenue estimates and the minimum guarantee for a few specific scenarios. We intend these scenarios to be illustrative rather than predictive of revenue changes. By May, both our office and the administration will release updated revenue estimates. Many developments over the coming months will affect these estimates, including movements in stock prices and state tax collections in April.
Figure 7
Reductions in General Fund Revenue
Would Reduce the Minimum Guarantee
Changes Relative to Governor’s Budget (In Millions)
|
2018‑19 Scenarios: |
|
|
Revenue Lossa |
Drop in Guarantee |
|
‑$500 |
‑$271 |
|
‑1,000 |
‑549 |
|
‑2,000 |
‑1,106 |
|
2019‑20 Scenarios: |
|
|
Revenue Lossa |
Drop in Guarantee |
|
‑$500 |
‑$192 |
|
‑1,000 |
‑382 |
|
‑2,000 |
‑765 |
|
‑4,000 |
‑1,530 |
|
aAssumes all other Proposition 98 inputs held constant. |
|
K‑14 Spending Changes
Additional Costs Likely to Materialize Over the Coming Months. The Governor’s budget currently does not reflect certain additional costs that are likely to materialize by May. These additional costs—the most significant of which we describe below—are likely to total a few hundred million dollars.
- Property Tax Backfill for San Francisco. Late last fall, the San Francisco Controller reported that it would be reducing the local property tax revenue allocated to the school district and community college district in the county to correct for a previous overallocation. When property tax revenue for a school or community college district drops, the state typically provides a General Fund backfill. The Governor’s budget reflects the lower property tax revenue for the San Francisco school district and community college district over the 2017‑18 through 2019‑20 period but does not account for a likely one‑time adjustment associated with correcting for the overallocation in prior years. Preliminary data suggest this adjustment (resulting in higher state cost) could be in the $100 million to $200 million range.
- Community College Apportionment Shortfall. Based upon preliminary data from the California Community Colleges Chancellor’s Office, the administration projects that costs for the new apportionment formula are higher than the state estimated in June. The Governor’s budget builds these higher costs into its 2019‑20 budget but does not provide a backfill for the cost increase in 2018‑19. We estimate the 2018‑19 shortfall is $69 million.
- Additional Funding for County Offices of Education (COEs). As we discuss in a later chapter, the administration’s spending estimates do not account for growth in the cost of the “minimum state aid” component of the funding formula for COEs. Across 2018‑19 and 2019‑20, we estimate these costs exceed the administration’s estimates by nearly $40 million.
- Additional Funding for Oakland and Inglewood Unified School Districts. Last September, the state enacted legislation indicating it would provide grants to cover part of the operating deficit for these two fiscally distressed school districts. The state will determine the size of the grants based upon an independent fiscal review that is due by March 1. At the time the legislation was enacted, the administration estimated the grants would total $28 million in 2019‑20.
Additional Savings Likely to Offset Some Portion of Additional Costs. Each budget year, the state identifies some unspent Proposition 98 funds from previous years. These funds are available for reallocation to other Proposition 98 programs. The Governor’s budget currently identifies $52 million in unspent prior‑year funds. By May, we think the amount identified is likely to be at least $100 million.
Even Small Changes in the COLA Rate Will Impact the Proposition 98 Budget. Although the Governor’s estimate of the COLA rate seems reasonable at this time, even small changes to the rate have notable effects. For example, a 0.5 percentage point change in the rate would change the total cost of COLA for school and community college programs by about $370 million. Assuming no other changes in the Proposition 98 budget, a COLA cost increase of that size would mean the state could no longer fund many of the Governor’s Proposition 98 proposals other than COLA. Conversely, a COLA cost reduction of that size would almost double the amount of Proposition 98 funding available for augmentations other than COLA. (The federal government is scheduled to release the data the state needs to finalize the COLA rate at the end of April.)
The Bottom Line
Available Proposition 98 Funding Could Be Somewhat Lower by May. Based on the potential for a lower minimum guarantee coupled with higher costs for programs within the guarantee, the Proposition 98 budget is likely to be tighter by May. In a relatively favorable budget scenario (one with both modest revenue drops and modest cost increases), the reduction in available Proposition 98 funding might be addressed by adjusting some of the Proposition 98 increases beyond COLA. In a less favorable budget scenario, the reduction in available Proposition 98 funding could necessitate revisiting the COLA rate. In outlining these possibilities, we assume the Legislature funds at the minimum guarantee in 2018‑19 and 2019‑20. The Legislature could decide to fund at a higher level as long as the overall budget remains balanced.
Proposition 98 Budget Contains No Cushion Against Potential Downturns. One way the state has mitigated potential drops in the guarantee in previous years has been to set aside some funding inside the guarantee for one‑time purposes. Over the past six years, this one‑time funding has averaged about $700 million per year. (This amount excludes one‑time funds associated with prior‑year true‑ups and settle‑up payments.) Having one‑time funds in the budget gives the Legislature a way to address drops in the minimum guarantee without making reductions to ongoing programs. The Governor’s proposed budget, however, dedicates just $3 million inside the 2019‑20 guarantee for one‑time purposes. Moreover, the Governor’s budget uses $77 million in one‑time funds to pay for a portion of the ongoing Strong Workforce Program. Using one‑time funds for ongoing costs builds a shortfall into the Proposition 98 budget the following year, effectively reducing the augmentations schools could expect in 2020‑21 and making future budget balancing more difficult.
Recommend Legislature Begin Identifying Its Highest Priorities and Focusing on One‑Time Initiatives. Over the next several months, the Legislature will have more opportunity to evaluate the Governor’s proposals, prioritize among those proposals, and weigh those proposals against its own interests. Given the developments noted above, the Legislature may want to begin identifying proposals it would be willing to reject or reduce in response to a smaller Proposition 98 budget. We also think the Legislature should consider replacing some of the Governor’s ongoing funding with one‑time initiatives. For instance, the Legislature might plan to cover the cost of COLA but designate other available funds for one‑time purposes. These steps would better position the Legislature to respond to lower revenue estimates in May or a potential downturn next year while minimizing any associated ongoing disruption for schools, community colleges, and the rest of the state budget.
Proposition 98 True‑Ups
In this section, we provide background on how the state makes adjustments to school funding when the minimum guarantee changes after a fiscal year has ended. We then describe the Governor’s proposal to repeal the automatic true‑up process the state enacted last year. We conclude with our assessment and recommendation.
Background
Minimum Guarantee Is Not Finalized Until After Year Is Over. Unlike most other programs in the state budget, the calculation of the minimum guarantee is not finalized until at least nine months after the close of the fiscal year. Given most of the Proposition 98 inputs change from the time of budget enactment through the end of this period, the final estimate of the guarantee almost always differs from the initial estimate. Swings in the guarantee after the end of the fiscal year typically are in the range of tens of millions to hundreds of millions of dollars.
State Practice Is to True Up K‑14 Funding When the Minimum Guarantee Changes. When the final guarantee is higher than the initial estimate, the state makes a one‑time payment to “settle up” to the higher guarantee. When the final guarantee is lower than the initial estimate, the state often adjusts K‑14 funding down to the lower guarantee. If an outstanding settle‑up obligation exists, the state typically scores the difference as a settle‑up payment, thereby not reducing school funding for that year but recognizing a lower base for calculating the guarantee moving forward. If no settle‑up obligation exists, the state typically reduces funding through other accounting adjustments, such as fund swaps. The state typically decides what type of adjustments to make as part of its regular budget process.
2018‑19 Budget Plan Established an Automatic True‑Up Process. Chapter 39 of 2018 (AB 1825, Committee on the Budget) created a Proposition 98 true‑up account to automatically adjust school funding when estimates of the prior‑year guarantee change. For years in which the guarantee drops, the state is to credit the funding above the guarantee to the true‑up account. For those years in which the guarantee increases, the state is to apply any credits in the true‑up account toward meeting the higher guarantee. If the credits are insufficient to meet the higher guarantee, the state is to make a settle‑up payment for the remaining difference. The true‑up account is intended to make unexpected changes in the guarantee and associated funding adjustments somewhat less disruptive for schools, community colleges, and the state.
Governor’s Proposal
Eliminates Automatic True‑Up Process. The Governor proposes to repeal the true‑up account. The Governor also proposes to prohibit the state from making any downward adjustment to school funding once a fiscal year is over, while still requiring the state to make upward adjustments.
Assessment and Recommendation
Changes to True‑Up Process Increase Risk to State Budget, Recommend Rejecting. The state historically has adjusted school funding both upward and downward in response to changes in the minimum guarantee occurring after enactment of the budget. The Proposition 98 true‑up account automated these adjustments but kept the same basic approach of making both upward and downward adjustments. By contrast, the Governor’s proposal would have the rest of the state budget assume the risk of any changes to the minimum guarantee occurring after the end of the year. The state would continue to be required to make settle‑up payments if the guarantee increased, but it would be prohibited from taking any action to align school funding with a lower guarantee. Not aligning school funding with the guarantee in one year can have ongoing implications for both sides of the state budget, as the guarantee typically builds upon the prior‑year funding level. Though the Governor’s proposal clearly offers a benefit for schools, it would make balancing the rest of the state budget during an economic downturn all the more difficult. For all these reasons, we recommend rejecting the Governor’s proposed changes.
Local Control Funding Formula
In this section, we provide background on LCFF, describe the Governor’s proposals relating to the LCFF COLA, assess those proposals, and offer associated recommendations.
Background
State Enacted New School Funding Formula in 2013‑14. Prior to LCFF, the state distributed school funding through a combination of general purpose grants (called “revenue limits”) and more than 40 state categorical programs. Districts could use general purpose grants for any educational purpose but had to spend categorical funding on state‑prescribed activities. In the years leading up to LCFF, policy makers were concerned this system had adverse effects. Notably, the system was characterized by a lack of coordination across programs, a compliance‑based rather than student‑based mindset, a disconnect between funding and student costs, historic funding inequities, and limited local control. In response, the state eliminated most categorical programs in 2013‑14, replacing the previous general purpose grants and program‑specific funding formulas with one new formula.
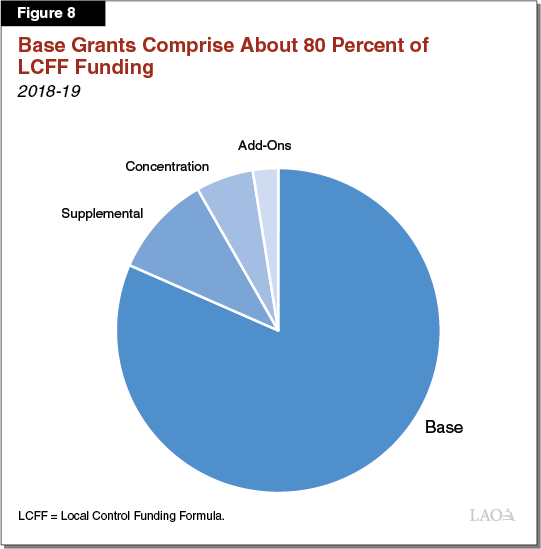
LCFF Has Three Main Components Plus “Add Ons.” LCFF consists of base, supplemental, and concentration grants, as well as several small add ons. Figure 8 shows the share of total LCFF funding attributable to each of these components. We describe each component below.
- Base Grants. The largest component of LCFF is a base grant generated by each student. Base funding rates differ by grade span, with students in higher grade spans generally generating more funding than those in lower grade spans. The state set per‑student base LCFF funding targets about $500 higher than pre‑recession funding levels adjusted for inflation. Districts may use base funding for any educational purpose.
- Supplemental Grants. For each English learner and low‑income (EL/LI) student, a district receives a supplemental grant equal to 20 percent of the base grant. A student who is both EL and LI generates the same funding rate as a student who belongs to only one of these groups. Districts must use this funding for the benefit of EL/LI students.
- Concentration Grants. Districts serving a student population more than 55 percent EL/LI also receive a concentration grant equal to 50 percent of the base grant for each EL/LI student above the 55 percent threshold. Districts also must use this funding for the benefit of EL/LI students.
- Add Ons. The largest add ons are associated with two historical categorical programs—one supporting targeted instructional support and the other supporting home‑to‑school transportation. Though the state no longer requires districts to operate these specific programs, districts continue to receive their 2012‑13 allocations for them.
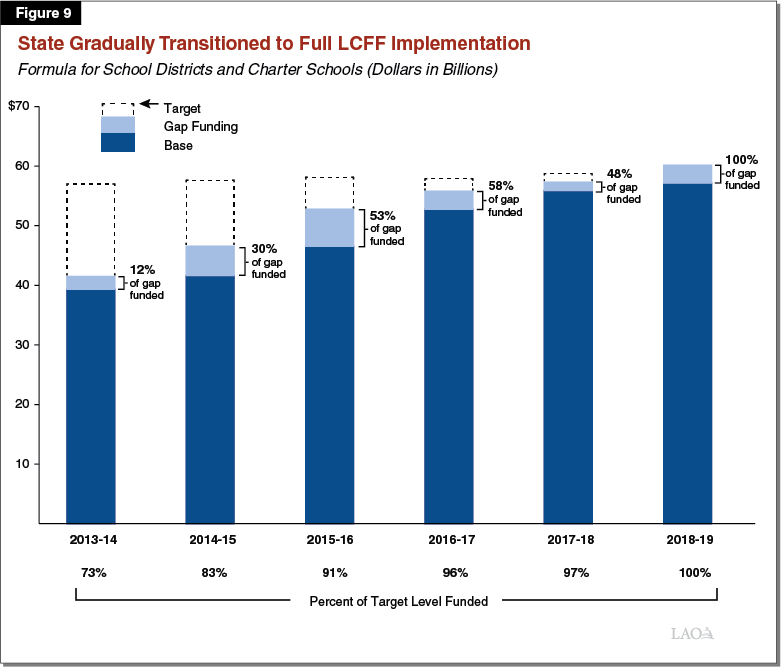
State Reached LCFF Funding Targets in 2018‑19—Two Years Ahead of Schedule. In 2013‑14, the state estimated LCFF would cost $18 billion more than the previous system due to its higher per‑student funding targets. Given the size of this additional cost, the state anticipated taking eight years to phase in the rate increases. As Figure 9 shows, the state ended up increasing LCFF funding rates over the course of six years. In 2018‑19, the state not only reached the funding targets but slightly surpassed them.
During Transition, Some Districts Received Especially Rapid Funding Increases. By design, the transition to full LCFF implementation resulted in larger funding increases for districts with large proportions of EL/LI students and/or historically low funding levels. Over the past six years, districts receiving the largest LCFF funding increases have seen their funding grow more than 70 percent per student. By comparison, districts receiving the smallest LCFF funding increases have experienced growth closer to 20 percent per student.
State Policy Is to Adjust LCFF Funding Rates for COLA Moving Forward. Whereas LCFF was intended to have big distributional impacts on districts during the transition years, it is intended to have a uniform impact on districts over the coming years. Having reached full LCFF implementation, the state decided last year to adopt a policy moving forward of automatically adjusting LCFF per‑student rates for COLA. The specific COLA rate is linked to a national price index designed to reflect the cost of goods and services purchased by state and local governments across the country. This index is developed by the federal Bureau of Economic Analysis (a division of the U.S. Department of Commerce).
In 2018‑19, State Is Estimated to Be Spending $61 Billion for LCFF. LCFF is by far the state’s largest education program. With $42.5 billion supported by the state General Fund (and $18.5 billion supported by local property tax revenue), LCFF also is the largest component of the state’s General Fund budget.
Governor’s Proposal
Signals Commitment to LCFF and Includes Funding for COLA. Although LCFF was closely associated with the previous administration, the new administration indicates it is “committed to funding public schools through the LCFF.” Consistent with that intent, the Governor’s budget includes $2 billion for a projected 3.46 percent LCFF COLA. The augmentation brings total LCFF funding in 2019‑20 to $63 billion.
Proposes COLA Cap. The Governor proposes to modify the COLA policy the state adopted last year. Based upon our conversations with the Department of Finance, the Governor intends to link the LCFF COLA rate to growth in the Proposition 98 minimum guarantee. In years in which the minimum guarantee grows too slowly to fund the full LCFF COLA, a formula would automatically reduce the LCFF COLA to a lower corresponding growth rate. The intent of the policy is to align the COLA rate automatically with anticipated growth in the minimum guarantee. The LCFF COLA rate would be finalized upon initial enactment of the state budget for that year. (As of this writing, the administration had not yet released associated trailer bill language.)
Assessment and Recommendations
LCFF Improved on Categorical Funding System in Several Respects. In discussions with various education groups throughout the state, we have heard widespread support for LCFF. Districts report their business officers and program experts now work hand‑in‑hand to develop education programs. Legislators also have steered away from a one‑size‑fits‑all approach in favor of allowing districts and their communities to develop locally tailored solutions. In tandem with the increased local flexibility, the state has tried to strengthen accountability through richer data collection and reporting as well as enhanced support for districts with poor outcomes. For all these reasons, we encourage the Legislature to continue providing most school funding through LCFF. Introducing new categorical programs could work counter to the LCFF objectives, such that developing and meeting district performance goals in a concerted way could become increasingly difficult.
Projected COLA Rate and Associated Cost Increase for 2019‑20 in Line With Our Estimates. Using the latest data available, we estimate the COLA rate is 3.26 percent—roughly tracking with the administration’s earlier estimate of 3.46 percent. The estimated rate will change based upon the release of further data updates over the coming months, with the state locking down the rate in late April. At this point, we do not expect a notable swing in the rate.
Recommend Budgeting Annually Rather Than Adopting Automated Formulas. By proposing a COLA cap, the administration acknowledges the impracticality of providing an automatic LCFF COLA in every budget situation. Since 1990‑91, the state has not funded the full K‑12 statutory COLA ten years—about one‑third of the time. Although automating reductions in the LCFF COLA rate would make balancing the budget easier, the Legislature might want to balance the budget in other ways those years. Moreover, adding a formula on top of a formula seems an unnecessary, complicated, and opaque way to budget. We think the Legislature should take a different approach and revisit the decision to provide an automatic COLA to LCFF. Rather than budget by layers of self‑imposed formulas, we believe a better approach would be to consider all key budget factors in any given year and decide priorities within that current context. Under this approach, the Legislature would make decisions about the LCFF COLA based upon the best information available at that time and in the context of all the other objectives it wanted to achieve that year. Such an approach is more transparent and thoughtful. For these reasons, we recommend the Legislature reject the proposed automated cap, as well as the automated COLA.
Special Education
In this section, we (1) provide background on special education and early intervention programs, (2) describe the Governor’s proposal to provide $577 million to support such programs, (3) assess the proposal, and (4) make associated recommendations.
Special Education
Federal Law Requires Schools to Provide Students With Disabilities Individualized Education Programs (IEPs). Special education is instruction designed to meet the unique needs of each child with a disability. As a condition of receiving federal funding, the Individuals with Disabilities Education Act (IDEA) requires schools to identify all students with disabilities and provide them individualized support. The specific support provided to each student is detailed in his or her IEP, a legal document developed by the student’s teachers, parents, and school administrators.
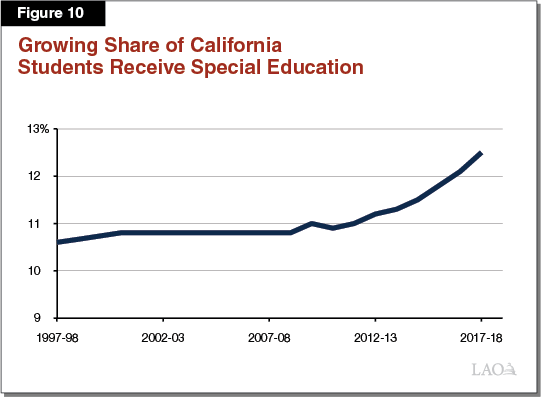
Share of California Students Receiving Special Education Has Increased in Recent Years. In 2017‑18, about 12.5 percent of California students received special education. As Figure 10 shows, the share of California students receiving special education was virtually flat from 1997‑98 through 2007‑08, then grew notably over the last ten years. The share of students diagnosed with autism has increased at an especially fast rate, more than doubling over the past ten years—rising from 0.7 percent of all students in 2007‑08 to 1.8 percent in 2017‑18.
Schools Offer a Range of Special Education Services. About 60 percent of students receiving special education have either speech impairments, such as stuttering, or specific learning disabilities, such as dyslexia. Students with these conditions typically require less intensive special education services, such as weekly pull‑out sessions with specialized teachers. An increasing number of California students require relatively intensive support, such as one‑on‑one assistance throughout the school day with an instructional aide coupled with regular sessions with a therapist. Students with autism sometimes require particularly intensive services from a range of specialists.
Special Education Often Operates in a Silo, Separate From General Education. In 2015, a statewide task force of education experts issued a report detailing poor coordination between special education and other educational services. The report found districts often do not include special education in broader strategic planning and special education administrators rarely collaborate with their general education counterparts. In its report, the task force echoed longstanding complaints from teachers, administrators, and parents.
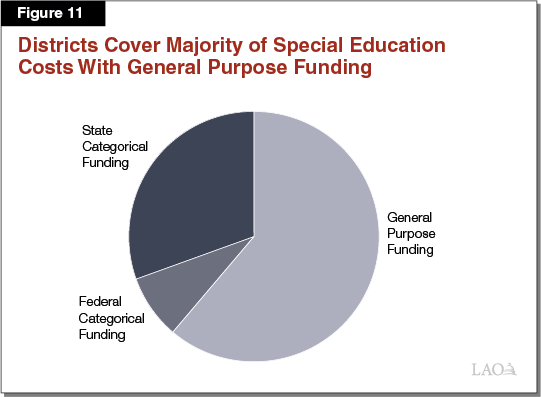
Special Education Supported by Combination of General Purpose and Categorical Funds. Schools receive billions of dollars each year (mostly from LCFF) to educate all students, including students with disabilities. These funds can be used for any educational purpose but primarily cover general education costs such as teacher compensation. Beyond these general education costs, schools incur additional costs to serve students with disabilities (for example, to provide specialized support and adaptive equipment). To help cover these additional costs, both the state and federal governments provide categorical funding specifically for special education (Figure 11). These fund sources together cover about 40 percent of the additional cost of special education services. Schools cover remaining special education costs with general purpose funding (mostly from LCFF).
Most Categorical Funding Is Allocated to Special Education Local Planning Areas (SELPAs). Most state and federal special education funding is allocated directly to SELPAs, which are typically either a regional consortium of smaller districts or a single large district. Each SELPA decides how to allocate its special education categorical funding among its member districts.
State Funds Variety of Special Education Programs. Figure 12 summarizes the state’s special education programs. About 80 percent of state special education funding is allocated by a formula commonly called AB 602 (after its enacting legislation). The formula distributes funding based on total student attendance rather than a direct measure of special education costs (for example, the number of students identified for special education or the services provided). The AB 602 approach ensures schools have little incentive to over‑identify students for special education or serve these students in unnecessarily expensive ways or settings. The federal government also allocates most of its special education funding based on overall student attendance.
Figure 12
California Has Several Special Education Categorical Programs
(In Millions)
|
Program |
Description |
2018‑19 |
|
AB 602 |
Per‑student funding for any special education expense. |
$3,163 |
|
Mental Health Services |
Per‑student funding for mental health services to students with disabilities. |
$374 |
|
Out‑of‑Home Care |
Additional funding for schools located near Licensed Children’s Institutions. |
$140 |
|
SELPA Administration |
Per‑student funding to support data collection, reporting, and other basic administrative tasks. |
$97 |
|
Workability |
Funding for employment training and job placement for older students with disabilities. |
$40 |
|
Low Incidence Disabilities |
Additional funding for students who are deaf, hard of hearing, visually impaired, or orthopedically impaired. |
$18 |
|
Technical Assistance Leads |
Funding for up to ten SELPAs to assist schools statewide in improving outcomes for students with disabilities. |
$10 |
|
Extraordinary Cost Pools |
Partial reimbursements for certain exceptionally costly services provided to students with severe disabilities. |
$6 |
|
Necessary Small SELPAs |
Formula providing additional special education funding to counties with fewer than 15,000 students overall. |
$3 |
|
Total |
$3,851 |
State Dedicates No Funding for Preschool‑Aged Children Requiring Special Education Services. Although the federal government requires schools to begin providing special education to children with disabilities at their third birthdays, the state provides no categorical funding specifically for this purpose. Schools cover related costs with a combination of federal funding and general purpose funding. In 2016‑17, federal funding for preschool special education was about $150 million and schools contributed about $500 million in general purpose funding.
Special Education Expenditures Have Increased Faster Than Associated Funding. Over the last ten years, total state and federal special education funding declined (in inflation‑adjusted terms) due to the drop in overall student attendance. During this period, total special education expenditures increased, largely driven by the growing number of students receiving special education coupled with some students requiring more intensive services. As a result, local general purpose funding has been covering an increasing share of special education expenditures, rising from about 45 percent ten years ago to about 60 percent today.
Students With Disabilities Tend to Have Poorer Outcomes Than Other Students. Students with disabilities perform worse than students without disabilities across several measures. Based upon the most recent data, students with disabilities had low scores on standardized tests of reading and math (scoring as a group at the 18th percentile of all test takers). Compared to the overall student population, students with disabilities also had higher suspension rates (6.8 percent compared to 3.5 percent) and lower graduation rates (65 percent compared to 83 percent).
Serving Students With Disabilities Is Districts’ Most Common Performance Problem. The state currently measures district performance in four key areas for 13 student groups. If a district has poor performance of at least one student group in two or more areas, it is identified for assistance. In fall 2018, 374 districts were identified for assistance. Of these districts, 243 (65 percent) were identified solely because of poor outcomes for their students with disabilities. Starting in 2018‑19, the state is providing $10 million ongoing for a network of SELPA leads to offer technical assistance to these districts.
K‑12 Early Intervention
In Recent Years, Schools Report Relying More on Early Intervention Programs. In recent conversations with school administrators, many tell us they have begun implementing early intervention programs for students who exhibit behavioral and academic challenges yet do not have IEPs. Early intervention programs typically consist of a range of support strategies, with levels of support increasing as students’ challenges increase. For example, a student diagnosed with a relatively minor academic challenge might receive extra assistance from an instructional aide during certain types of class lessons whereas a student diagnosed with a greater academic challenge might receive help both from an aide during class and a tutor after class. Early intervention programs also tend to provide certain support services to all students. For example, some schools now screen all students for symptoms of trauma and offer counseling to those exhibiting such symptoms.
State Dedicated One‑Time Funding for Expanding Early Intervention Programs. In 2015‑16 and 2016‑17, California provided a total of $30 million to support a partnership between the Orange and Butte COEs to expand Multi‑Tiered Systems of Support (MTSS). These COEs developed trainings for school administrators and provided other forms of technical assistance for schools. Of the $30 million, $21 million was allocated as subgrants to help 51 other COEs, 490 districts (49 percent of all districts), and 134 charter schools cover the cost of implementing MTSS. MTSS entails three tiers of support. The first tier is intended to help teachers adopt new instructional styles that are designed to reach students with a variety of learning styles. The second tier consists of targeted support, such as counseling, offered specifically to students with identified academic or behavioral challenges. The third tier consists of traditional special education services for students with IEPs.
Districts Cover Ongoing MTSS Costs With General Purpose Funding. Through LCFF, the state provides about $10 billion annually in supplemental and concentration funding to benefit English learners and low‑income students. Because MTSS disproportionately benefits such students, many districts report using supplemental and concentration funding to implement MTSS. (Data are not available on exactly how much districts spend annually on MTSS.)
Governor’s Proposal
Cites Key Concerns With Special Education. In The Governor’s Budget Summary, the administration characterizes special education in California as “complex, state‑driven, and administratively costly.” In detailing its concerns with special education, the administration specifically references the state’s patchwork of special education categorical programs and poor coordination between special education and other educational services.
Provides $577 Million in Special Education Concentration Grants. Of the total amount, $390 million is ongoing and $187 million is one time. These funds would be allocated according to a formula. All school districts and charter schools serving more than the statewide average share of students with disabilities and having an overall student population that is more than 55 percent English learners and low‑income students would receive funding. The administration estimates about 425 entities meet these criteria. These districts and charter schools would receive funding for every student receiving special education above the statewide average identification rate. For example, if a district identifies 13.5 percent of its students in special education and the statewide average identification rate for districts and charter schools is 12 percent, that district would receive additional funding for 1.5 percent of its student population.
Districts Could Use Funds for Array of Purposes. The administration intends for the funds to improve the outcomes of students with disabilities and other students with academic and behavioral challenges. Districts could use the funds to provide more support for students with disabilities, provide services to preschool‑aged children with disabilities, or expand early intervention programs such as MTSS. Districts would be encouraged to use the one‑time funding for purposes such as acquiring new equipment or providing professional development.
Assessment
Creating New Categorical Program Works Counter to Many of the Governor’s Stated Goals. Although The Governor’s Budget Summary cites the patchwork of state special education programs as a notable drawback, the administration’s proposal adds to that patchwork of programs. School administrators would be asked to master one more special education program, including understanding its program‑specific allocation formula and spending conditions. In addition, the administration expresses concern about the poor coordination between special education and other educational services, but its proposal might exacerbate these coordination challenges. Districts increasingly support MTSS with LCFF and consider early intervention services integral parts of their overall strategic plans. By providing categorical funding specifically to support such services, the state may end up relegating these early intervention programs to a new silo, increasingly distant from general education programs.
Some of the Governor’s Objectives Have Been Already Addressed Through Existing State Policies. In recent years, the state already has taken steps to address some of the Governor’s key concerns. In response to concerns about special education performance, the state last year created the new network of SELPA leads to provide districts additional support. In response to concerns about the lack of early intervention programs, the state funded the expansion of MTSS. Stemming from this latter effort, almost half of districts have received an MTSS subgrant and other districts have taken steps to initiate these programs. Districts also are more commonly incorporating K‑12 early intervention programs into their overall strategic plans. The administration has not provided a compelling rationale for establishing a new categorical program with these same points of focus.
Proposed Allocation Formula Is Also Misaligned With Governor’s Policy Goals. The Governor expresses interest in supporting early intervention programs because they could reduce the number of students identified for special education. Under his proposal, however, districts that reduced their number of students receiving special education would experience a decrease in associated categorical funding. We estimate the per‑student rate under the Governor’s proposal would be about $8,000 in ongoing funds. Losing such a large amount per student likely would discourage districts from reducing their identification of students for special education.
Schools Likely to Use Funding on Existing Special Education Services. Under the Governor’s proposal, schools would be able to choose whether to use their new categorical program allotments for special education or early intervention. Because special education costs have far outpaced special education funding in recent years, most schools receiving funding under the Governor’s proposal very likely would use the funds to help them cover existing special education costs.
State Has Better Options for Increasing Special Education Funding. If it is interested in increasing special education funding, we believe the state has better options than introducing a new categorical program. In particular, we have long recommended equalizing AB 602 per‑student funding rates, which vary from less than $500 to more than $900 for historical reasons. Another option is to modify AB 602 to allocate some funding specifically for preschool special education.
Recommendations
Reject Governor’s Proposal, Set Priorities for Any New Special Education Spending. For all these reasons, we recommend the Legislature reject the Governor’s proposal and begin to identify its highest special education priorities. If the Legislature chooses to make special education a priority, it could consider two specific special education augmentations, described below.
Equalization. One option is to provide funding for equalizing AB 602 per‑student funding rates. We estimate equalizing these rates at the 90th percentile of existing rates would cost $333 million. (Equalizing at the 90th percentile has been the state’s most common equalization approach.) The Legislature could spread this cost increase over several years.
Preschool Special Education. The Legislature also could consider providing state funding for preschool special education. In recent years, various bills in this area have taken different approaches, with state costs ranging from $150 million to $500 million. In evaluating its options, we encourage the Legislature to:
- Avoid creating incentives to over‑ or under‑identify three‑ and four‑year olds for special education.
- Keep in mind that three‑ and four‑year olds currently are identified for special education at about half the rate of K‑12 students.
- Consider the shares of cost to be covered by federal funds, state categorical funds, and local general purpose funds. Currently, preschool special education is estimated to cost about $700 million, with federal funds covering a higher share of cost (20 percent) compared to K‑12 special education costs (for which federal funds cover slightly less than 10 percent of the cost).
- Avoid adding unnecessary complexity by creating new programs while considering ways to modify existing programs to meet identified objective(s).
County Offices of Education
In this section, we provide background on state funding for county offices of education (COEs), describe the Governor’s proposal to provide COEs with a COLA, assess the proposal, and offer associated recommendations.
Background
State Created New COE Funding Formula in 2013‑14. At the same time it introduced LCFF for school districts, the state introduced a new funding approach for COEs. As with school districts, COEs were previously supported by a mix of general purpose grants and categorical grants. In 2013‑14, the state replaced most of these grants with a two‑part funding formula. Figure 13 shows how the formula works. The first part of the formula funds COEs to support school districts, with COEs having broad discretion in deciding what types of support services to offer. The second part of the formula funds COEs to directly educate students in specific settings, including juvenile court schools. The formula is funded using state General Fund and local property tax revenue, with the proportion of each funding source varying by county.
Figure 13
COE Funding Formula Has Two Parts
2018‑19 Rates
|
District Support Servicesa |
|
|
Base funding |
$697,058 |
|
Funding per district in county |
$116,177 |
|
Funding per student in county |
$43‑$74b |
|
Alternative Educationc |
|
|
Base funding |
$11,921 |
|
Supplemental funding |
$4,172 per EL/LI student |
|
Concentration funding |
$4,172 per EL/LI student above 50 percent EL/LI enrollment |
|
aEach COE recieves a base allotment plus funding for each district and student in the county. bRates are graduated with less populous counties receiving higher per‑student rates. cCOEs receive funding for each student who is (1) under the authority of the juvenile justice system, (2) probation referred, (3) on probation, or (4) mandatorily expelled. State assumes 100 percent of students at juvenile court schools are EL/LI. COE = county offices of education. EL/LI = English learner/low income. |
|
State Phased In Target Funding Rates Over Two Years. In developing the new COE funding formula, the state set target funding rates, with the formula estimated to cost about $60 million more than the previous funding system. The state phased in the higher funding targets over 2013‑14 and 2014‑15. Every year since 2014‑15, the state has applied a COLA to the formula rates.
Some COEs Still Funded at Their 2012‑13 Levels. Both LCFF for school districts and the new COE formula were intended in part to eliminate historical funding inequities. To this end, some COEs with very high 2012‑13 funding levels have remained at those levels ever since, as other COEs effectively catch up. In 2018‑19, 16 COEs continue to be funded at their 2012‑13 levels (Figure 14). The lowest funded of this set receives about 10 percent more than it would otherwise generate under the formula. The highest funded of this set receives more than double what it would otherwise generate under the formula.
Figure 14
Two‑Thirds of COEs Receive
More Than Formula Level
2018‑19, Based on LAO Estimates
|
COEs Funded According to Formula |
|
|
Alpine |
San Francisco |
|
Colusa |
San Joaquin |
|
El Dorado |
Shasta |
|
Humboldt |
Sierra |
|
Imperial |
Siskiyou |
|
Kern |
Trinity |
|
Kings |
Tulare |
|
Madera |
Tuolumne |
|
Nevada |
Yolo |
|
San Benito |
Yuba |
|
COEs Still Funded at Higher 2012‑13 Level |
|
|
Amador |
Merced |
|
Butte |
Mono |
|
Calaveras |
Plumas |
|
Del Norte |
Sacramento |
|
Glenn |
San Bernadino |
|
Lassen |
Santa Cruz |
|
Los Angeles |
Sutter |
|
Mariposa |
Tehama |
|
COEs Benefiting From Minimum State Aid Policy |
|
|
Alameda |
Placer |
|
Contra Costa |
Riverside |
|
Fresno |
San Diego |
|
Inyo |
San Luis Obispo |
|
Lake |
San Mateo |
|
Marin |
Santa Barbara |
|
Mendocino |
Santa Clara |
|
Modoc |
Solana |
|
Monterey |
Sonoma |
|
Napa |
Stanislaus |
|
Orange |
Ventura |
|
COEs = county offices of education. |
|
Some COEs Have Funding Levels Increasingly Divergent From Formula. Despite being intended to eliminate existing funding inequities, the formula was paired with a new policy allowing COEs for the first time to benefit from increases in local property tax revenue. Prior to 2013‑14, any COE receiving additional property tax revenue had its state funding reduced dollar for dollar. This practice ensured no COE received greater per‑student funding based solely on its property tax collections. Starting in 2013‑14, the state introduced a “minimum state aid” policy that effectively upended the previous policy. The result of the new policy is that many COEs experiencing particularly large property tax revenue growth now receive notably more per‑student funding than COEs with slower property tax growth. Figure 14 shows that 22 COEs in 2018‑19 are funded above their formula rates due to this policy. (Some of these COEs also benefit from the 2012‑13 hold harmless policy.) The lowest funded of this set receives 3 percent more than it would otherwise generate under the formula. The highest funded of this set receives more than double what it would otherwise generate under the formula. The number of COEs benefiting in this way is up from 14 in 2014‑15.
In 2018‑19, COEs Receiving an Estimated $1.1 Billion in Formula Funding. Of this total amount, $466 million is generated by the district services part of the formula, $244 million is for alternative education, $233 million is for supporting COEs still funded at their 2012‑13 levels, and $113 million is for minimum state aid. (These amounts reflect the administration’s January estimates.)
Governor’s Proposal
Funds COLA for COE Formula. As with LCFF for school districts, the administration appears supportive of the current COE funding formula. The Governor’s budget includes $9 million for a 3.46 percent COLA to the formula rates.
Assessment
COLA Helps Mitigate Growing Funding Inequities. Providing a COLA for the 20 COEs funded according to the formula somewhat reduces the funding disparities between these COEs and the higher‑funded COEs.
As Property Tax Revenues Increase, COE Funding Becomes Increasingly Inequitable. COEs benefiting from the minimum state aid policy have reaped the benefits of rapidly increasing property tax revenues. Whereas COEs funded according to the formula have seen their per‑pupil funding grow in line with inflation (about 2 percent per year), those benefiting from the minimum state aid policy have seen their funding grow at nearly double that rate. Such results run counter to the original intent of eliminating historical funding inequities.
Cost of Minimum State Aid Increasing Over Time. Figure 15 tracks the growth in the cost of minimum state aid since 2013‑14. Minimum state aid costs grew from $30 million in 2013‑14 to $113 million in 2017‑18. We project it will increase to $134 million in 2019‑20, with costs continuing to grow as assessed property values (and associated property tax revenue) continue to grow.

Administration Underestimates Cost of Minimum State Aid. The Governor assumes the cost of minimum state aid in 2018‑19 and 2019‑20 will remain at the same level as in 2017‑18 ($113 million). Though the Governor assumes no increase in the cost of minimum state aid, the administration does project growth in local property tax revenue for the purposes of making its other Proposition 98 calculations. Consistent with both our office’s and the administration’s overall local property tax outlooks, we assume local property tax revenue for COEs continue to grow. Based upon our local property tax revenue projections, we estimate the cost of minimum state aid will grow by $16 million in 2018‑19 (to $129 million) and by an additional $5 million in 2019‑20 (to $134 million). Not recognizing these higher costs now makes the Governor’s budget appear to have more available Proposition 98 funding than is the case. Whether acknowledged now or later, the higher cost comes at the expense of something else in the Proposition 98 spending package.
Recommendations
Adopt COLA to Mitigate Funding Inequities. We recommend the Legislature adopt the proposed COLA, which would at least slightly reduce the gap between the 20 formula‑funded COEs and the higher‑funded COEs.
Replace Minimum State Aid With New Hold Harmless Policy. We recommend the Legislature repeal the minimum state aid provision for COEs. Repealing the policy would produce savings in the low tens of millions each year initially, growing to low hundreds of millions over time. To ensure a smooth transition for COEs currently benefiting from the provision, the Legislature could adopt a new hold harmless policy ensuring no COE receives less total funding than estimated under the 2018‑19 Budget Act. Such a provision maintains unjustified funding inequities in the near term but stops those inequities from growing. The state sometimes uses this type of hold harmless approach when implementing a new policy.
Education Mandates
In this section, we provide background on state education mandates, then describe and assess the Governor’s proposal to provide a COLA to the education mandates block grants. Unlike other sections of this report, this section covers both schools and community colleges, as their mandates block grants work very similarly.
Background
Constitution Requires the State to Reimburse Local Governments for Mandated Activities. Proposition 4, a constitutional measure approved in 1979, requires the state to reimburse local governments for the cost of new programs and higher levels of service imposed by the state. The Commission on State Mandates (CSM) is statutorily responsible for determining if a new state law, regulation, or executive action constitutes a reimbursable mandate for local governments. For education mandates, a local government is defined as a school district, COE, or community college district. (Prior to 2006, charter schools received mandate reimbursements. In 2006, CSM concluded that charter schools constitute voluntary educational programs, rather than local governments, and deemed them ineligible for reimbursements. Charter schools must still undertake some state‑mandated activities.)
State Budget Currently Recognizes 57 Education Mandates. As Figure 16 shows, the state currently recognizes 44 mandates that apply to K‑12 education and 13 that apply to community colleges. (Of these mandates, six apply to both K‑12 education and community colleges.) The state has suspended many other education mandates (five that apply only to K‑12 education, five that apply only to community colleges, and seven that apply to both). Local education agencies (LEAs) are not required to perform the activities associated with suspended mandates and, consequently, the state is not required to reimburse them.
Figure 16
Various State Requirements Are Deemed Mandatesa
2018‑19
|
K‑12 Education (44 Mandates) |
|
|
Academic Performance Index |
Juvenile Court Notices II |
|
Agency Fee Arrangements |
Law Enforcement Agency Notificationc |
|
AIDS Prevention / Instruction I and II |
Mandatory Reporters Training |
|
Annual Parent Notificationb |
Notification of Truancy |
|
California Assessment of Student Performance and Progress |
Parental Involvement Programs |
|
California State Teachers’ Retirement System Service Credit |
Physical Performance Tests |
|
Caregiver Affidavits |
Prevailing Wage Rate |
|
Charter Schools I, II, III, and IV |
Public Contracts |
|
Child Abuse and Neglect Reporting |
Pupil Suspensions and Expulsions I and II |
|
County Office of Education Fiscal Accountability Reporting |
Pupil Health Screenings |
|
Collective Bargaining |
Pupil Promotion and Retention |
|
Comprehensive School Safety Plans I and II |
Pupil Safety Notices |
|
Criminal Background Checks I and II |
Race to the Top |
|
Developer Fees |
School Accountability Report Cards I, II, III, and IV |
|
Differential Pay and Reemployment |
School District Fiscal Accountability Reporting |
|
Expulsion of Pupil: Transcript Cost for Appeals |
School District Reorganization |
|
Financial and Compliance Audits |
Student Records |
|
Graduation Requirements |
Teacher Notification: Pupil Suspensions/Expulsionsd |
|
Habitual Truants |
The Stull Act |
|
Immunization Records (includes Pertussis & Hepatitis B) |
Threats Against Peace Officers |
|
Intradistrict Attendance |
Uniform Complaint Procedures |
|
Interdistrict Attendance Permits |
Williams Case Implementation I, II, and III |
|
California Community Colleges (13 Mandates) |
|
|
Agency Fee Arrangements |
Minimum Conditions for State Aid |
|
Cal Grants |
Prevailing Wage Rate |
|
California State Teachers’ Retirement System Service Credit |
Public Contracts |
|
Collective Bargaining |
Reporting Improper Governmental Activities |
|
Discrimination Complaint Procedures |
Threats Against Peace Officers |
|
Enrollment Fee Collection and Waivers |
Tuition Fee Waivers |
|
Health Fee Elimination |
|
|
aMandates typically include only very specific activities associated with their name. The figure shows active mandates. Currently, 12 K‑12 mandates and 12 community college mandates are suspended. bAlso includes Schoolsite Discipline Rules and Alternative Schools. cAlso includes Missing Children Reports. dAlso includes Pupil Discipline Records. |
|
CSM Recently Found One New State Requirement to Be a Mandate. In January 2018, CSM determined a law requiring school districts to undertake certain activities related to Cal Grants was a reimbursable education mandate. This mandate requires school districts to (1) electronically submit grade point averages to the California Student Aid Commission to determine Cal Grant eligibility and (2) provide written notification to students in grades 11 and 12 and their parents/guardians explaining that they can opt‑out of this process. The CSM expects to complete its statewide cost estimate of this mandate in March. Shortly after CSM releases a statewide cost estimate, our office is statutorily responsible for assessing the mandate and making associated recommendations.
State Traditionally Paid Mandates Through Claims Process. Under the state’s traditional mandate reimbursement process, LEAs submit claims for the actual cost of performing each mandated activity. The State Controller’s Office (SCO) pays claims from funds appropriated in the state budget. The SCO audits some claims and reduces payments accordingly.
Widespread Agreement Claims Process Has Serious Shortcomings. The traditional reimbursement method results in large variation in per‑student claims across LEAs. Total school district claims currently range from $1 to slightly over $9,000 per student (with some small districts not submitting any claims), while community college claims range from $1 to $3,600 per student. The traditional reimbursement process also has a high administrative burden, requiring LEAs to document specific costs and submit reimbursement forms. Despite such efforts, LEAs can subsequently be audited by the SCO and have a substantial share of their claims disallowed. In addition, the traditional reimbursement process provides no incentives for LEAs to perform activities efficiently or effectively.
State Created Mandates Block Grants as Alternative to Claims Process. To address these concerns, the state in 2012‑13 created two mandates block grants—a K‑12 block grant (for school districts, charter schools, and COEs) and a community college block grant. The block grants provide upfront per‑student funding in lieu of submitting claims.
Block Grant Participation Is Very High. Figure 17 shows the percentage of school districts and COEs participating in the K‑12 block grant over time. In 2018‑19, almost all school districts and COEs participated, with only 51 (out of 1,002) not participating. These nonparticipating agencies represent less than 5 percent of all districts and COEs in the state and around 1 percent of statewide student attendance. Of the 51 nonparticipating agencies, 34 continue to submit claims through the traditional reimbursement process. The other 17 have not submitted any claims in recent years, foregoing any reimbursement for mandated activities. All community college districts currently participate in the block grant, having done so since 2012‑13.
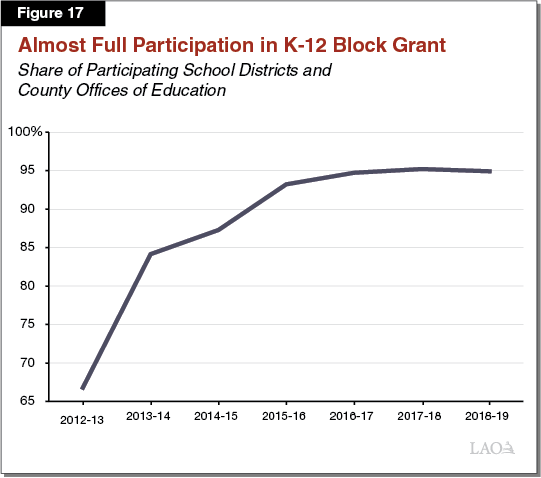
State Has Added and Removed Mandates From the Block Grants Over Time. Currently, all active mandates are included in the block grants. As Figure 18 shows, certain mandates have been added and others removed from the block grants since 2012‑13. For the K‑12 block grant, the state has added 12 mandates and removed 5 mandates. For the community college block grant, the state has added one mandate and removed six mandates. The Graduation Requirements mandate pre‑dated the creation of the K‑12 block grant, but virtually all of the other mandates added to the block grants are newly recognized mandates since the creation of the block grants. The mandates removed from the block grants generally reflect suspended or repealed mandates.
Figure 18
State Has Added and Removed Mandates From the Block Grants
|
Block Grant |
Mandate |
|
|
Added: |
||
|
2013‑14 |
K‑12 |
Graduation Requirements |
|
K‑12 |
Pupil Expulsion II |
|
|
2014‑15 |
K‑12 |
Parental Involvement Programs |
|
K‑12 |
Williams Case Implementation I, II, III |
|
|
K‑12 |
Uniform Complaint Procedures |
|
|
K‑12 |
Developer Fees |
|
|
K‑12 |
Charter School Oversight IV |
|
|
K‑12/CCC |
Public Contracts |
|
|
2015‑16 |
K‑12 |
Immunization Records for Pertussis |
|
K‑12 |
Race to the Top |
|
|
2017‑18 |
K‑12 |
Mandatory Reporters Training |
|
K‑12 |
California Assessment of Student Performance and Progress |
|
|
Removed: |
||
|
2013‑14 |
K‑12/CCC |
Absentee Ballots (suspended) |
|
K‑12/CCC |
Brendon Maguire Act (suspended) |
|
|
K‑12/CCC |
Mandate Reimbursement Process (suspended) |
|
|
K‑12/CCC |
Open Meetings/Brown Act (deemed not reimbursable) |
|
|
CCC |
Sex Offenders: Disclosures by Law Enforcement (suspended) |
|
|
2014‑15 |
CCC |
Community College Construction (made permissive) |
|
2017‑18 |
K‑12 |
High School Exit Exam (repealed) |
State Has Adjusted the Block Grants for a Few Added Mandates. In adding and removing mandates from the block grants, the state has tended not to make corresponding adjustments to block grant funding. It has adjusted block grant funding in response to adding three mandates to the K‑12 block grant. Specifically, the state increased the K‑12 block grant when it added the mandates for (1) Graduation Requirements (adding $50 million and increasing the high school rate), (2) Immunization Records for Pertussis (adding $1.7 million and increasing the K‑8 rate), and (3) Mandatory Reporters Training (adding $8.5 million and increasing all K‑12 rates). The state has not made downward adjustments to either the K‑12 or community college block grant rates to account for the mandates it has removed since 2012‑13.
Legislature Has Provided COLA the Past Two Years. The state provided the first COLA to the mandates block grants in 2017‑18 and provided a COLA again in 2018‑19. The COLAs provided these two years were 1.56 percent and 2.71 percent, respectively.
Governor’s Proposal
Governor Proposes COLA for Mandates Block Grants. The Governor’s budget provides a 3.46 percent COLA for the K‑12 and community college mandates block grants. The associated costs are $8.1 million for the K‑12 block grant and $1.1 million for the community college block grant. Figure 19 shows per‑student block grant funding rates from 2017‑18 (actual) to 2019‑20 (proposed). Under the Governor’s budget, the total cost of the two block grants in 2019‑20 is $277 million ($243 million for the K‑12 block grant and $34 million for the community college block grant).
Figure 19
Governor’s Budget Provides COLA for Mandates Block Grants
|
Grade Span |
Per‑Student Ratesa |
||||
|
2017‑18 |
2018‑19 |
2019‑20 |
|||
|
School Districts |
K‑8 |
$30.34 |
$31.16 |
$32.24 |
|
|
9‑12 |
58.25 |
59.83 |
61.90 |
||
|
Charter Schools |
K‑8 |
$15.90 |
$16.33 |
$16.90 |
|
|
9‑12 |
44.04 |
45.23 |
46.79 |
||
|
COEs |
K‑8 |
$30.34 |
$31.16 |
$32.24 |
|
|
9‑12 |
58.25 |
59.83 |
61.90 |
||
|
Countywide K‑12 |
1.02 |
1.05 |
1.09 |
||
|
Community Colleges |
— |
$28.44 |
$29.21 |
$30.22 |
|
|
aBased on average daily attendance for K‑12 education and full‑time equivalent enrollment for community colleges. From 2017‑18 to 2018‑19, all rates grew by 2.71 percent. From 2018‑19 to 2019‑20, the Governor proposes to increase all rates by 3.46 percent. COLA = cost‑of‑living adjustment and COEs = county offices of education. |
|||||
Assessment and Recommendation
Providing Annual COLA for Block Grants Has Benefits, Recommend Adopting. A COLA is a simple way to recognize cost increases over time. For most mandates, the largest underlying costs are for staff salaries and benefits as well as materials. Similarly, the primary input affecting the COLA rate is the change in wages and salaries for local governments, with some weight also given to equipment and supply costs. By helping to keep funding in line with cost increases, an annual COLA also serves to promote high block grant participation—reducing any incentive an LEA might have for returning to the traditional claims process, with all its drawbacks for both the state and LEAs. For these reasons, we recommend the Legislature adopt the Governor’s proposal to provide COLA for the mandates block grants.
School Facilities
In this section, we begin by providing background on the School Facilities Program (SFP) and the Office of Public School Construction (OPSC), which plays an integral role in reviewing facility projects. We then discuss the Governor’s proposals to accelerate the sale of school bonds and increase staffing at OPSC. We conclude with our assessment and recommendation.
Background on School Facilities Funding
School Facility Costs Generally Are Shared Between the State and Schools. Chapter 407 of 1998 (SB 50, Greene) created the SFP. The underlying tenet of the program is that the state and school districts share the cost of building new school facilities and modernizing old ones. The state generally covers 50 percent of the cost of new construction, including the purchase of land, working drawings, and construction of new facilities. The state typically covers 60 percent of the cost of renovating facilities that are at least 25 years old. For both types of projects, the state can contribute up to 100 percent of project costs if districts face challenges in raising their local shares. The state covers its share of the cost using state general obligation bonds whereas school districts typically cover their share using local general obligation bonds.
Voters Approved New State Bond in 2016. Between 1998 and 2006, voters approved four state general obligation bonds generating a total of $35 billion for the SFP. After ten years without a new state school bond, voters approved Proposition 51 in November 2016. The measure authorizes the state to sell $7 billion in general obligation bonds for school facilities. Of the $7 billion, the measure dedicates $3 billion to new construction projects, $3 billion for renovation projects, $500 million for charter school facilities, and $500 million for career technical education (CTE) facilities. In contrast to state infrastructure projects, the state does not list all approved school facility projects in the annual budget act.
Under Brown Administration, State Was on 12‑Year Track to Expend All Proposition 51 Funding. The state sells school bonds incrementally as it approves specific SFP projects. The Department of Finance, in consultation with the State Treasurer, determines the exact timing of these bond sales. The state sold a total of $565 million in Proposition 51 bonds for 2017‑18 and intends to sell $594 million in 2018‑19. At this pace, the state would have taken 12 years to finish selling Proposition 51 bonds. This slow pace of sales was despite a growing backlog of school facility applications.
Considerable Local Bond Funding Is Available. School districts typically raise their share of facility funding through the sale of local general obligation bonds, which require local voter approval and are repaid through local property taxes. From November 2002 through January 2018, voters approved $134 billion in local general obligation bonds for schools, of which $53 billion remains unspent. In addition to generating funding through local bonds, schools have raised more than $11 billion from fees charged on residential and commercial development since 1998. Schools also can raise facility funding from various other sources, including parcel taxes, but they raise relatively small amounts from these other sources.
Background on the Office of Public School Construction
OPSC Is One of Several State Agencies Involved in Project Approval Process. To qualify for SFP funding, schools must receive approval from at least three state agencies—(1) the California Department of Education (CDE), which ensures school plans meet state educational standards; (2) the Division of the State Architect (DSA), which ensures that buildings meet state safety standards; and (3) OPSC, which determines eligibility and funding for each project. To ensure that projects comply with an agency’s requirements, agency staff conduct desk reviews of submitted documents and, in some cases, visit facility sites. The SFP requires CDE and DSA to approve a project before OPSC may make a final funding determination.
OPSC Undertakes Several Activities When Reviewing Project Proposals. OPSC staff first review facility applications to ensure that all required components are included. If materials are missing, OPSC staff will send letters to a district requesting the additional documents within a certain timeframe. Once an application is considered complete, OPSC staff: analyze whether the project qualifies for funding (per state regulations), ensure that the scope of the project is aligned with the funding request, evaluate whether the project qualifies for special SFP grants (such as land acquisition or multi‑story building grants), and check that the project plans submitted to OPSC are the same as those submitted to CDE and DSA. In addition to processing applications, OPSC staff conduct outreach activities, process district appeals of facility determinations, and prepare materials for OPSC’s governing board.
2017‑18 Budget Package Shifted Responsibility for Audits From OPSC to Local Auditors. Historically, OPSC staff also conducted audits of school projects. Two years ago the state devolved the responsibility for these audits from OPSC to local independent auditors contracted by districts. (OPSC is still responsible for auditing projects funded prior to April 2017.) Although the state shifted this responsibility away from OPSC, it did not make a corresponding reduction in OPSC’s staffing level.
Governor’s Proposal
Proposes to Sell $1.5 Billion in Proposition 51 School Bonds in 2019‑20. Most of the funding would be allocated for new construction and modernization projects, with $125 million likely designated for CTE projects. (By the end of 2017‑18, the state had committed nearly all of the $500 million designated for charter schools under Proposition 51.)
Provides $1.2 Million for OPSC to Hire Additional Staff. The Governor proposes to provide OPSC an ongoing augmentation of $1.2 million (Proposition 51 funds) to hire ten additional staff to process SFP funding applications. Of these new positions, eight would be analysts and two would be managers. Currently, OPSC has ten full‑time equivalent (FTE) employees processing applications, not including several managers who spend a portion of their time supervising those employees.
Assessment
Proposal to Accelerate Proposition 51 School Bond Sales Is Reasonable. Given a growing facility application backlog and the historically slow pace of Proposition 51 bond sales, we believe the Governor’s proposal to accelerate sales is reasonable. By the end of 2018, the backlog of facility applications was $4.7 billion, compared to $3.3 billion 12 months earlier (a 44 percent increase). Releasing Proposition 51 funding faster would allow the state to clear more of the backlog and fund projects sooner. Assuming the proposed pace of bond sales were to continue moving forward, the state would exhaust Proposition 51 funding by 2022‑23 (over six fiscal years).
OPSC Dedicates Small Share of Staff to Application Processing. The 10 FTE employees OPSC currently dedicates to processing SFP applications account for 19 percent of its 52 authorized positions. OPSC claims that if it were to transition additional staff to processing facility applications, it would divert them from other important activities, such as processing application appeals or conducting outreach on how to apply for SFP funding. We are concerned, however, with OPSC dedicating such a small share of its staff to its core function of processing applications.
Proposed Staffing Augmentation Seems High. To allocate $1.5 billion in SFP funding, OPSC would need to process approximately 380 funding applications per year. Using OPSC’s assumptions for hours spent per application, we estimate the workload associated with processing that many applications could be accomplished by 12 FTE staff. This represents an increase of two positions relative to the positions currently dedicated to application processing. In response to our questions, OPSC indicated that its request for ten additional positions was also based on an anticipated increase in other activities, such as updating eligibility for SFP, handling appeals, and answering applicant questions. We are concerned that these additional tasks were not itemized in the Governor’s proposal and seem high relative to the time spent processing applications.
Staffing Proposal Assumes No Workload Reduction From Shifting Audit Responsibilities. The OPSC currently has 24 positions (46 percent of all positions) associated with its audit division. Two of these positions currently are vacant. Despite shifting core auditing responsibilities to local auditors two years ago, the Governor’s proposal does not assume any reduction in staffing for the audit division. In 2016‑17 (the year prior to the shift of responsibilities), OPSC indicates it completed 265 audits. The OPSC expects to complete less than half as many audits in 2019‑20, with additional declines moving forward as projects funded prior to April 2017 are closed out. We understand OPSC has assumed some new workload with the transition of its audit responsibilities, such as providing technical support for local auditors and assisting in the development of local audit procedures. Nevertheless, we are concerned that the Governor’s proposal assumes no associated staffing reduction when auditing is no longer a core function and a need for additional application processing exists.
Recommendation
Recommend Rejecting Proposal to Increase OPSC Staffing. Although we have no concerns with the Governor’s proposal to accelerate Proposition 51 bond sales, we believe OPSC can manage the workload associated with processing additional SFP applications using existing resources. The OPSC currently dedicates a relatively small share of its FTE employees to processing applications, and the reduction in its audit responsibilities should free up additional staff time. As a first step in aligning its staffing with the proposed bond sales, OPSC could shift the two currently vacant positions in its audit division to application processing.
Summary of Recommendations
Proposition 98 Budget Planning
- Prepare for possible drops in Proposition 98 funding based upon (1) recent economic developments suggesting state revenues and the minimum guarantee could be somewhat lower than the Governor’s budget assumes, and (2) the likelihood of higher costs for certain programs within the guarantee. Even a small drop in the guarantee could mean the state has little ability to increase Proposition 98 programs beyond covering cost‑of living adjustments (COLAs).
- Expect the 2018‑19 minimum guarantee to decrease about 55 cents for each dollar of lower state revenue.
- Expect the 2019‑20 minimum guarantee to decrease about 40 cents for each dollar of lower state revenue.
- Begin evaluating the Governor’s specific proposals and identify those the Legislature might be willing to reject or reduce in response to a smaller Proposition 98 budget.
- Consider replacing some of the Governor’s ongoing funding with one‑time initiatives to provide a cushion if the minimum guarantee declines now or in the future.
Proposition 98 True‑Ups
- Reject the Governor’s proposal to eliminate the automatic true‑up process and prohibit downward Proposition 98 funding adjustments in the prior year. The proposal would make balancing the state budget more difficult.
Local Control Funding Formula
- Continue providing most K‑12 funding through the Local Control Funding Formula (LCFF), which has eliminated many of the complexities and inequities associated with the state’s previous school funding model.
- Reject the Governor’s proposal to cap the LCFF COLA. Also, repeal the action taken last year to provide an automatic LCFF COLA. Rather than budget by layers of self‑imposed formulas, make decisions about the LCFF COLA annually based upon all key budget factors and priorities at that time.
- Expect the 2019‑20 COLA rate, as finalized in April, not to vary substantially from the rate estimated in January (3.46 percent). Even small swings, however, affect the overall Proposition 98 budget package. A 0.5 percentage point change in the COLA rate would change LCFF costs in 2019‑20 by about $300 million.
Special Education
- Reject the Governor’s proposal to provide new special education concentration grants. The design of the proposal works counter to the administration’s stated policy goals of improving coordination, reducing complexity, and alleviating administrative burden.
- Consider equalizing per‑student special education funding rates or providing state funding for preschool special education.
County Offices of Education
- Adopt the Governor’s proposal to provide a COLA to the funding formula for county offices of education (COEs). Providing the COLA would somewhat mitigate current inequities in COE funding.
- Repeal the COE minimum state aid policy, which is producing increasingly large inequities in COE funding and diverting millions annually from other K‑12 priorities. Associated state savings would be in the low tens of millions each year initially, growing to low hundreds of millions over time.
- To minimize disruption, consider adopting a provision ensuring no COE receives less total funding than estimated under the 2018‑19 Budget Act. Through such a provision maintains funding inequities in the near term, it stops those inequities from growing.
Education Mandates
- Adopt the Governor’s proposal to provide a COLA to the K‑12 and community college mandates block grants. Providing a COLA recognizes cost increases over time and promotes high participation in the block grants.
School Facilities
- Adopt the Governor’s proposal to sell $1.5 billion in Proposition 51 school facilities bonds in 2019‑20. The faster pace would help clear the application backlog and fund projects sooner.
- Reject the Governor’s proposal to increase staffing at the Office of Public School Construction by ten positions, as the agency can manage additional workload within its existing resources.