The 2020-21 Budget:
California's Fiscal Outlook
See a list of this year's fiscal outlook material, including the core California's Fiscal Outlook report, on our fiscal outlook budget page.
LAO Contact

November 21, 2019
The 2020-21 Budget
California’s Fiscal Outlook
CalWORKs Child Care Outlook
Introduction
This post is part of our November Outlook series intended to help the Legislature plan for the budget year ahead. In this post, we provide background on the California Work Opportunity and Responsibility to Kids (CalWORKs) child care program, discuss our projections of future CalWORKs child care costs, and identify various risks and uncertainties that could affect these future costs.
Background
State Provides Subsidized Child Care for CalWORKs Participants. CalWORKs provides cash aid and employment services to low-income families with children. Under the program, parents who work or are participating in other county-approved activities (such as taking college classes) qualify for subsidized child care benefits. Parents may progress through three stages of CalWORKs child care. Families are eligible to be in Stage 1 when they first enter CalWORKs. Once CalWORKs families become stable (as determined by the county welfare department), they move into Stage 2. Families are eligible to stay in Stage 2 for two years after they stop receiving cash aid. Upon Stage 2 eligibility expiring, families move into Stage 3. They can continue receiving Stage 3 subsidized care until their income exceeds 85 percent of the state median income (SMI) or their child ages out of the program (turns 13 years old). In 2019‑20, California expects to serve an estimated 153,000 children across all three stages on an average monthly basis. Nearly 60 percent of children served in CalWORKs child care are under age six.
State and Federal Funding Support the Program. The 2019‑20 Budget Act included a total of $1.4 billion for the three stages of CalWORKs child care. CalWORKs child care is funded with a combination of state and federal funding. Of total CalWORKs child care funding, 56 percent is from the state General Fund and 44 percent is from federal fund sources (Temporary Assistance for Needy Families and the Child Care and Development Fund).
State Budgets for Stage 1 Differently Than Stages 2 and 3. The funding provided for all three stages of CalWORKs child care is determined annually in the state budget process. For Stage 1 child care, the state provides the Department of Social Services an appropriation for the county single allocation block grant. This block grant is intended to cover counties’ costs for determining families’ CalWORKs eligibility, providing employment services, covering Stage 1 child care costs, and undertaking various other related administrative functions. County welfare departments can, and do, spend their block grant funds flexibly across these categories. The state adjusts the block grant amount annually based primarily on CalWORKs caseload projections. By comparison, for Stages 2 and 3 child care, the state provides the California Department of Education an appropriation that can only be used for child care services and associated administration of those services.
Providers Are Reimbursed Based on Regional Market Rates (RMR). Reimbursement rates for CalWORKs child care providers vary by county. The rates are based on a regional market survey of a sample of licensed child care providers. The state conducts the survey every two years. Currently, the state links the RMR to the 75th percentile of rates reported on the 2016 survey. Linking reimbursement rates to the 75th percentile is intended to give families access to at least three-quarters of their local child care providers. (Families may access higher-cost providers if they are willing to pay more out of pocket.) Chapter 29 of 2016 (SB 828, Committee on Budget and Fiscal Review) included intent language to reimburse child care providers at the 85th percentile of rates reported on the most recent survey. To date, the state has not funded at the higher reimbursement level or begun using the more recent 2018 survey results.
In 2017‑18, State Made Three Changes That Notably Affected Stages 2 and 3. The first change was to allow families to continue receiving child care if their income is at or below 85 percent of the SMI. Prior to this change, families’ income had to be at or below 70 percent of the SMI to be eligible for care. The second change was to annually update the data used to calculate the SMI. Prior to this change, the state was using an SMI based on 2007 data. The effect of these two changes is that families currently are eligible to receive subsidized child care if their income is at or below 85 percent of the 2017 SMI—$69,620 for a family of three (compared to $42,216 under the previous policies). The third change was to require families to report information necessary for determining eligibility only once per year, unless changes in income make them ineligible. Previously, families were required to report any change in income or work hours within five days. These changes significantly increased Stages 2 and 3 caseload (as discussed in the next section).
In 2019‑20, State Made Two Changes Affecting Stage 1. The first change was to allow Stage 1 families to receive child care on a full-time basis. Prior to this change, families would receive child care only for the hours they attended allowable CalWORKs activities, such as mandatory welfare-to-work activities, job interviews, employment activities, or education classes. The second change was to verify eligibility for care only once each year rather than continually throughout the year. Both changes recently went into effect (October 1, 2019). These changes are expected to increase Stage 1 caseload significantly (as discussed in the “Fiscal Outlook” section).
Effect of Stages 2 and 3 Eligibility Changes
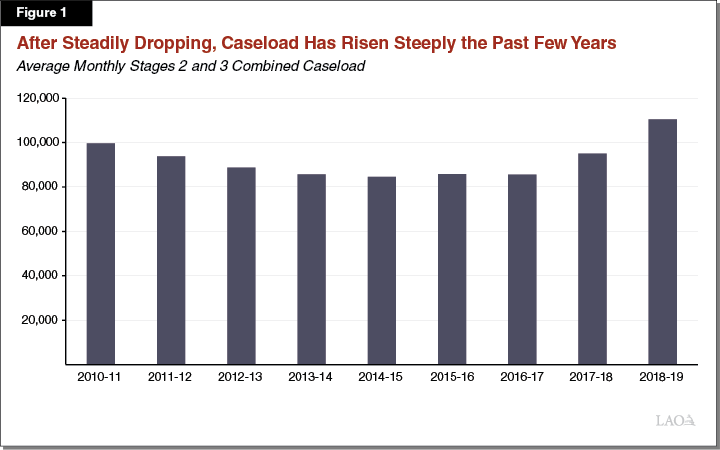
CalWORKs Stages 2 and 3 Caseload Began Increasing Notably in 2017‑18. Figure 1 shows Stages 2 and 3 caseload from 2010‑11 to 2018‑19. Consistent with overall CalWORKs enrollment, CalWORKs child care caseload declined from 2010‑11 through 2016‑17, as the state’s economic recovery reduced the number of families seeking welfare-to-work support. In 2017‑18, however, CalWORKs Stages 2 and 3 caseload began increasing. In 2018‑19, nearly 25,000 more children were served in Stages 2 and 3 compared to 2016‑17—a 29 percent increase. Most of this caseload increase likely is attributed to the policy changes noted above, with the change in the family reporting requirement likely having the greatest effect. (Increasing the income threshold likely had a much smaller effect, as the income of most CalWORKs families is significantly below the threshold.)
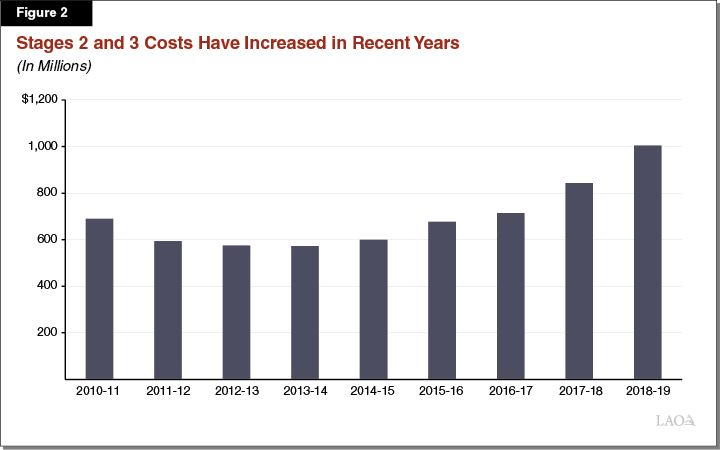
Costs for Stages 2 and 3 Have Increased Over the Past Five Years. Figure 2 shows Stages 2 and 3 costs from 2010‑11 to 2018‑19. Costs for Stages 2 and 3 declined in the first four years of the period, then began rising in 2014‑15 due to a combination of rate and caseload increases. The most significant increases during the period were the last two years. In 2018‑19, Stages 2 and 3 costs were $290 million higher than 2016‑17 costs—nearly three times greater than the amount that the state initially budgeted for the rate and eligibility changes.
Fiscal Outlook
In this section, we first describe the assumptions and methodology we use to produce our CalWORKs child care cost estimates. We then provide our estimates of costs in the current year and throughout the subsequent four years.
Assumptions and Methodology
Projections Are Based on Caseload and Cost Per Case in Each Stage. Caseload refers to the average number of children served in each stage on a monthly basis during the fiscal year. Cost per case reflects the average annual cost to provide subsidized child care to one child. Individual child care costs can vary significantly depending on the child’s age, the number of hours of care a child receives, whether a child is receiving care in a center-based facility or home, and the geographic region. Using the average cost per case captures these factors. Below, we explain our caseload and cost per case assumptions and methodology.
Calculating Caseload. To project caseload, we use the most recent caseload data and estimate how many children will enter and exit each stage of CalWORKs child care during each year of the outlook period. We make several assumptions in developing these estimates. This year, the following two assumptions changed significantly from our previous forecasts.
Attrition Rate in Stages 2 and 3 Down From Prior Years. The eligibility changes enacted in 2017‑18 resulted in families exiting Stages 2 and 3 at much lower rates compared to previous years. In 2018‑19, the attrition rates were 2.4 percent in Stage 2 and 1.4 percent in Stage 3. This compares with 2016‑17 attrition rates of 4.5 percent in Stage 2 and 3.1 percent in Stage 3. Our forecast assumes attrition in Stages 2 and 3 stays at the lower 2018‑19 rates through 2023‑24.
Stage 1 Caseload Up From Prior Years. We estimate Stage 1 caseload will increase by 9 percent in 2019‑20, an additional 9 percent in 2020‑21, and level off through the rest of the period. This caseload trend is intended to capture the effect of the recent policy changes that make accessing Stage 1 child care easier. (As larger cohorts of Stage 1 families move through the subsequent stages of care, we expect Stages 2 and 3 caseload to increase too.) The assumed Stage 1 caseload effect is based upon initial caseload changes experienced in San Francisco County, which launched a pilot in May 2017 that contained similar changes as enacted at the state level in 2019‑20. The effect at the state level, however, is uncertain and could differ notably from the San Francisco pilot and therefore from our estimate.
Calculating Cost Per Case. For Stages 2 and 3, we assume no change in cost per case over the period, as current state law sets reimbursement rates at the 75th percentile of the 2016 survey. (We assume legislative intent to increase rates to the 85th percentile of the most recent survey is not implemented over the period.) For Stage 1, we adjust the 2018‑19 cost per case to account for the recent policy change that allows all Stage 1 families to receive child care on a full-time basis. Specifically, we assume more families will receive full-time care and be served in licensed settings—both of which increase the Stage 1 cost per case. (We think the full-time provision will make accessing licensed care easier.)
Cost Estimates
Current-Year CalWORKs Child Care Costs Are Down From Budgeted Levels. We estimate that CalWORKs child care costs for 2019‑20 will be $25 million lower than estimated in the June 2019 budget plan (Figure 3). This amount is the net effect of changes across the three stages of CalWORKs child care, with Stage 1 costs estimated to be $20 million higher, Stage 2 costs $58 million lower, and Stage 3 costs $14 million higher. Compared to estimates included in the June budget plan, our November estimates assume a higher cost per case and caseload in Stage 1, a lower cost per case and caseload in Stage 2, and a lower cost per case but higher caseload in Stage 3.
Figure 3
Overall Program Costs in 2019‑20
Likely Lower Than Budgeted
(In Millions)
|
June |
November |
Difference |
|
|
Stage 1 |
$326 |
$345 |
$20 |
|
Stage 2 |
615 |
557 |
‑58 |
|
Stage 3 |
503 |
516 |
14 |
|
Totals |
$1,443 |
$1,418 |
‑$25 |
CalWORKs Child Care Costs Are Projected to Continue Growing. We estimate CalWORKs child care costs will continue to grow through 2023‑24 (Figure 4). We estimate budget-year costs will be 12 percent higher than current-year costs, with costs growing at an average annual rate of 4 percent the subsequent three years. Under these estimates, the cost of the program in 2023‑24 is 27 percent higher compared to 2019‑20. Of the three stages, we estimate Stage 3 will grow at the highest rate through 2023‑24—growing 14 percent in the budget year and continuing to grow at an average annual rate of 10 percent thereafter. Our outlook assumes higher program costs would be covered from the state General Fund, with the program assumed to receive the same level of annual federal funding in 2019‑20 through 2022‑23.
Figure 4
CalWORKs Child Care Costs Increase Over Outlook Period
LAO Estimates (In Millions)
|
|
2019‑20 |
2020‑21 |
2021‑22 |
2022‑23 |
2023‑24 |
|
Stage 1 |
$345 |
$401 |
$404 |
$397 |
$385 |
|
Stage 2 |
557 |
598 |
629 |
638 |
636 |
|
Stage 3 |
516 |
588 |
662 |
728 |
785 |
|
Total |
$1,418 |
$1,587 |
$1,694 |
$1,763 |
$1,807 |
Risks and Uncertainties
Below we describe a few key factors not captured in our cost estimates. These factors may impact the overall costs of CalWORKs child care, but we are uncertain of the magnitude at this time. We will continue to monitor the effect of these policies and incorporate them into our future cost estimates as better data becomes available.
Legislative Action to Increase Reimbursement Rates Would Result in Higher Costs. Costs would be higher than we estimate if the Legislature were to use the more recent RMR survey or fund at a higher reimbursement percentile. We estimate it would cost $230 million above our initial November estimates if the state funded at the 75th percentile of the 2018 survey. We estimate it would cost $565 million above our initial November estimates if the state funded at the 85th percentile of the 2018 survey. (These estimates include the cost to increase rates for CalWORKs child care and the Alternative Payment program.)
Likely Higher Costs Due to Recently Enacted Collective Bargaining Legislation. Chapter 385 of 2019 (AB 378, Limon) allows family child care home and license-exempt providers to collectively bargain with the state. Providers may negotiate on a number of work-related issues, including their reimbursement rates. The cost estimates reflected above do not include the effect of this legislation. We think the legislation likely will not affect program costs in the budget year, as some time will be needed for providers to organize and undertake required procedural steps. We think the legislation could begin affecting program costs in 2021‑22. The magnitude of the effect likely will depend upon implementation decisions and any program changes. (The state is currently developing the Master Plan for Early Learning and Care that is to include recommendations for changes to the state’s child care system.) For example, the effect of Chapter 385 could vary notably were the state to retain its current child care reimbursement rate system or overhaul it.
State Set to Remove Stage 1 From Single Allocation Block Grant in 2020‑21. Effective July 1, 2020, the state will separate Stage 1 child care from the county single allocation block grant. Moving forward, the state will estimate Stage 1 costs separately from other CalWORKs employment services and administrative costs. Counties will only be able to use budgeted Stage 1 funds for child care services (similar to how the state budgets for Stages 2 and 3). The fiscal effect of this budgetary change also will depend upon its implementation. Costs could potentially decrease since counties would not be able to use unspent child care funds for other purposes. Rather than providing more flexibility to counties, the unspent funds could be used for other legislative priorities. Alternatively, costs could increase if more families receive child care or stay on Stage 1 for longer than they do today.
Program Costs Could Change Under Recession Scenario. CalWORKs child care caseload and costs could differ from our estimates were a recession to occur during the outlook period. In a recession, overall caseload in the CalWORKs program would tend to increase as more families qualify for welfare services. Families might have a more difficult time, however, meeting required work activities, such that the number of families qualifying for CalWORKs child care services might not increase notably. During past recessions, the state also changed certain CalWORKs policies that affected child care caseload and cost. If a recession were to occur during the next year or two, the effect on caseload and cost is even more uncertain given the state does not yet know the precise impact of its new Stage 1 policies.