LAO Contacts

November 18, 2020
The 2021-22 Budget
California's Fiscal Outlook
- Introduction
- What Has Happened Since the Budget Passed?
- Does the State Have Enough Resources to Pay for Its Current Commitments?
- Comments and Recommendations
- Appendix 1
- Appendix 2
Executive Summary
State Economy Has Undergone Rapid but Uneven Recovery. Although the state economy abruptly ground to a halt in the spring with the emergence of coronavirus disease 2019, it has experienced a quicker rebound than expected. While negative economic consequences of the pandemic have been severe, they do not appear to have been as catastrophic from a fiscal standpoint as the budget anticipated. But, the recovery has been uneven. Many low‑income Californians remain out of work, while most high‑income workers have been spared.
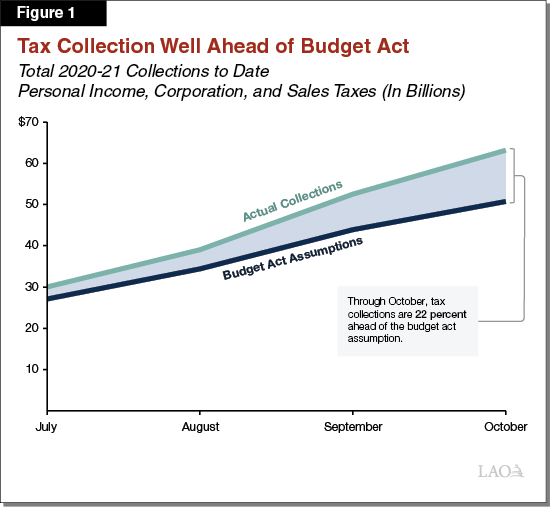
Recent Data on Tax Collections and Expenditures Consistent With Economic Picture. Recent data on actual tax collections and program caseloads have been consistent with a more positive economic picture, especially among high‑income Californians. For example, between August and October, collections from the state’s three largest taxes so far in 2020‑21 have been 22 percent ($11 billion) ahead of budget act assumptions. Simultaneously, data on new applications for safety net programs, like Medi‑Cal and CalFresh, in the first few months of 2020‑21 show that new applications for these programs have been below 2019‑20 levels.
Estimated Windfall of $26 Billion in 2021‑22… Under our main forecast, we estimate the Legislature has a windfall of $26 billion to allocate in the upcoming budget process. This windfall—or one‑time surplus—results from revisions in prior‑ and current‑year budget estimates and is entirely one time. Current unknowns about the economic outlook create an unprecedented amount of uncertainty about this fiscal picture. Our analysis suggests revenues easily could end up $10 billion or more above or below our main forecast in 2021‑22. Over the budget window, the cumulative effect of these revenue differences means the windfall is more likely than not to lie between $12 billion and $40 billion.
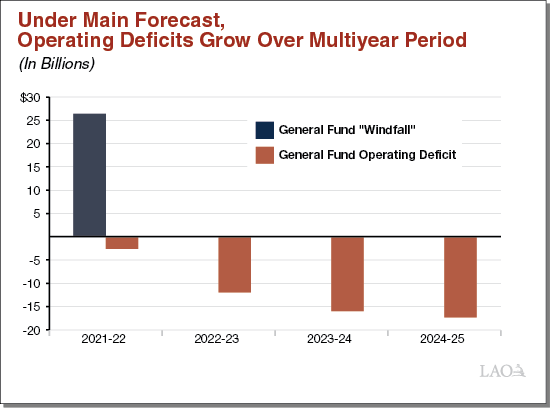
…But State Also Faces an Operating Deficit Beginning in 2021‑22. Under our main forecast, General Fund revenues from the state’s three largest sources would grow at an average annual rate of less than 1 percent. Meanwhile, General Fund expenditures under current law and policy grow at an average 4.4 percent per year. The net result is that the state faces an operating deficit, which is relatively small in 2021‑22, but grows to around $17 billion by 2024‑25 (see figure).
Budget for Schools and Community Colleges Is More Positive. The budget picture for schools and community colleges is more positive—the minimum funding level required by Proposition 98 (1988) is projected to grow more quickly than school and community college programs. A new statutory requirement to provide supplemental payments on top of the minimum level makes even more funding available for schools and community colleges but contributes to the state’s operating deficit.
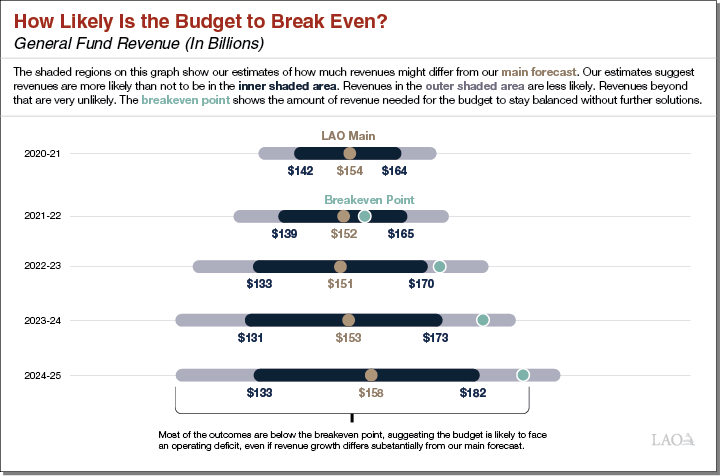
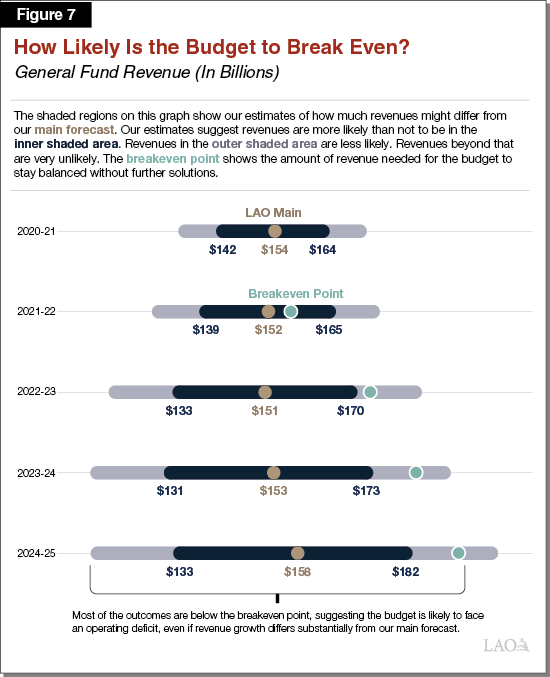
What Revenue Level Would Balance the Budget? We also estimate how much faster revenues would need to grow in order to erase the operating deficit. Revenues would need to beat our expectations by $5 billion in 2021‑22 and $35 billion in 2024‑25 for the budget to break even. The figure below shows where the breakeven point falls in our likely range of revenue outcomes. The bulk of likely outcomes are below the breakeven point, suggesting the budget is quite likely to face an operating deficit under current law and policy.
Comments and Recommendations. We conclude the report with our comments and we recommend the Legislature:
- Restore Budget Resilience. We recommend the Legislature use half of the windfall—about $13 billion—to restore the budget’s fiscal resilience. For example, the Legislature could make an optional deposit into a state reserve, like the Safety Net Reserve, to help maintain services when demands on the state’s safety net programs increase.
- Address One‑Time Pandemic Needs. The significant windfall provides the Legislature with an opportunity to develop a robust COVID‑19 response that was not feasible when facing a $54 billion budget problem in the spring. We recommend the Legislature use the other half of the windfall—about $13 billion—on one‑time purposes, focusing on activities that mitigate the adverse economic and health consequences of the public health emergency.
- Begin Multiyear Effort to Address Ongoing Deficit Now. The budget cannot afford any new ongoing augmentations. Moreover, we recommend the Legislature use the 2021‑22 budget process to begin to address the state’s ongoing deficit through spending reductions or revenue increases. The significant budget windfall in 2021‑22 buys the Legislature time to enact or phase‑in changes over the longer term.
Introduction
Each year, our office publishes the Fiscal Outlook in anticipation of the upcoming state budget process. In this report, we provide our assessment of the state’s fiscal situation for the budget year and over a multiyear period.
The fiscal situation has continued to rapidly evolve since the beginning of the coronavirus disease 2019 (COVID‑19) pandemic earlier this year. As such, the first section of this report describes how the budget situation has changed since lawmakers passed the 2020‑21 Budget Act in June.
In the second section of this report, we aim to help lawmakers understand whether—and to what extent—the budget has sufficient resources to fund government services authorized under current law (at both the state and federal levels). We address this issue both for the upcoming fiscal year and over the longer term.
We conclude the report with our comments on the state’s fiscal condition and our recommendations for the Legislature as it begins constructing the 2021‑22 budget. Throughout this report, our analysis depends on assumptions about the future of the state economy, its revenues, and its expenditures. Consequently, our analysis and conclusions are not definitive, but rather reflect our best guidance to the Legislature based on our current professional assessment.
What Has Happened Since the Budget Passed?
Economy
Rapid Rebound Results in Incomplete, Uneven Economic Recovery. The COVID‑19 pandemic has been an unprecedented disruption to California’s economy. In the spring, the economy abruptly ground to a halt: millions of Californians lost their jobs, businesses closed, and consumers deeply curtailed spending. Almost as quickly, Californians began to adjust to the realities of the pandemic. With this adjustment, and accompanying major federal actions to support the economy, came a rapid rebound in economic activity over the summer. This recovery, however, has been incomplete and uneven. Many low‑wage, less‑educated workers remain out of work, while few high‑wage, highly educated workers have faced job losses. Certain sectors—such as leisure and hospitality—remain severely depressed, while others—such as technology—remain strong. Reaching full recovery will be a slow process that will depend heavily on continued progress on management and treatment of the virus. Below, we highlight a few key economic developments with particular importance to the state’s fiscal situation.
Spike in Unemployment Was Historic, but Less Than Feared. This spring, the state’s unemployment rate peaked at 16 percent—the highest since the Great Depression. Despite this surge, unemployment fortunately did not reach the 25 percent rate assumed by the 2020‑21 Budget Act. The unemployment rate has since improved, but remains at 11 percent as of September—a level comparable to the Great Recession. Low‑wage workers have borne most of the job losses during the pandemic, as workers earning less than $20 per hour (slightly below the state average) make up the vast majority of job losses as of September. In contrast, employment among workers earning over $60 per hour remains at pre‑pandemic levels.
Drop in Consumer Spending Was Very Large, but Short‑Lived. The spring job losses coincided with a dramatic drop in consumer spending. One measure of consumer spending in California was roughly one‑third lower in April than immediately before the pandemic. Spending has since rebounded, improving consistently in each month between May and October. As of October, spending had risen to within roughly 10 percent of pre‑pandemic levels.
Stock Market and Technology Sector Doing Particularly Well. Like other parts of the economy, stock markets experienced a rapid decline and recovery earlier this year. Unlike most areas of economic activity, however, stock prices have seen such a dramatic rebound that they have reached historic highs. A key driver of rising stock prices has been the continued success of many companies in the technology sector—including several headquartered in California—throughout the pandemic.
Revenues
Tax Collections Have Been Much Better Than Anticipated. The budget act assumed the state would face a historic revenue decline in 2020‑21. In particular, it anticipated total collections from the state’s three largest taxes—personal income, corporation, and sales taxes—would fall 15 percent from the prior year. Actual collections in recent months, however, have been much better than anticipated. Between August and October, collections from the three largest taxes were 9 percent higher than the prior year. As a result, actual collections so far in 2020‑21 are 22 percent ($11 billion) ahead of budget act assumptions, as can be seen in Figure 1.
Higher‑Than‑Expected Collections Consistent With Economic Picture. At first blush, strong tax collections may seem at odds with widespread unemployment and the continued struggles of many businesses. These strong collections, however, are consistent with the relatively good economic outcomes experienced by high‑income Californians, who account for a large share of state tax payments. Stable employment among high‑income earners and a rebound in investments held by wealthy Californians has led to continued growth in tax payments from these taxpayers.
Program Caseload
Safety Net Caseload Increases Have Not Materialized as Anticipated. The budget anticipated the state’s safety net programs—in particular, Medi‑Cal, CalFresh, and California Work Opportunity and Responsibility to Kids (CalWORKs)—would experience significant caseload increases at the end of 2019‑20 and into 2020‑21. For each of these programs, our data lags by a few months, meaning we currently only have data on actual caseloads through June or July of 2020 (and the most recent months are preliminary estimates). To date, actual caseload figures through the end of 2019‑20 have come in significantly below budget act projections. In addition, preliminary data from safety‑net program applications in 2020‑21 do not suggest a major upturn. In particular:
- Medi‑Cal. The budget act assumed average monthly caseload of about 13 million in 2019‑20, but preliminary data reveal this number is closer to 12.6 million. Moreover, initial data from 2020‑21 shows new applications for the program have been below 2019‑20 levels. For example, for July through October 2020, new applications have been down 15.6 percent relative to the same period in 2019. Without an upturn in new applications, 2020‑21 Medi‑Cal caseload is unlikely to reach the levels assumed in the budget act.
- CalFresh. The budget act assumed average monthly caseload of about 2.3 million in 2019‑20, but preliminary data show a number closer to 2.2 million. Also, initial data on total applications for CalFresh from July through October 2020 shows new applications have been below the corresponding period in 2019 by 13.3 percent.
- CalWORKs. Although the budget act assumed average monthly caseload of about 412,000 participating families, preliminary data show a number closer to 365,000. Also, initial data on total applications for CalWORKs from July through October 2020 shows new applications have been below the corresponding period in 2019 by 24.7 percent.
As we will discuss later, we anticipate caseloads for Medi‑Cal and CalWORKs to rise in the future given the severe economic impact of the pandemic on lower‑income workers. To date, however, other economic mitigation interventions—like expanded unemployment insurance and federal stimulus payments—likely have delayed enrollment in these programs.
Does the State Have Enough Resources to Pay for Its Current Commitments?
Economic Uncertainty Clouds Outlook
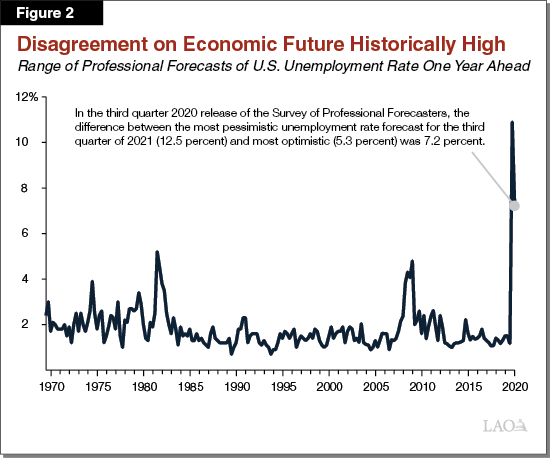
Unprecedented Amount of Uncertainty About Economic Future. A host of unknowns cloud the state’s economic outlook. Will virus cases worsen further over the fall and winter? How soon will effective treatments or vaccines be widely available? Can businesses continue to withstand diminished revenues in the face of rising debts? Will the federal government take additional actions to support the economy? Could the pandemic create a permanent shift toward remote work and, if so, will this shift change people’s and businesses’ decisions about locating in California? These unknowns create an unprecedented degree of uncertainty about the economic outlook. This uncertainty is evidenced by the wide range of opinions among economists about where the economy is heading. For example, as Figure 2 shows, divergence among economists’ forecasts of what the unemployment rate will be a year from now is at a 50‑year high. This uncertain environment presents a significant challenge for the Legislature as it enters the 2021‑22 budget process.
Main Forecast Is Our Best Assessment... Despite an uncertain future, the Legislature will need to select a revenue assumption around which to build the 2021‑22 budget. Given this reality, our Fiscal Outlook presents a main revenue forecast, which is our office’s best assessment of the most likely outcome. The economic assumptions underlying our main revenue forecast reflect the average of forecasts from various professional economists (collected in October). Our main forecast is the gold line in Figure 3.
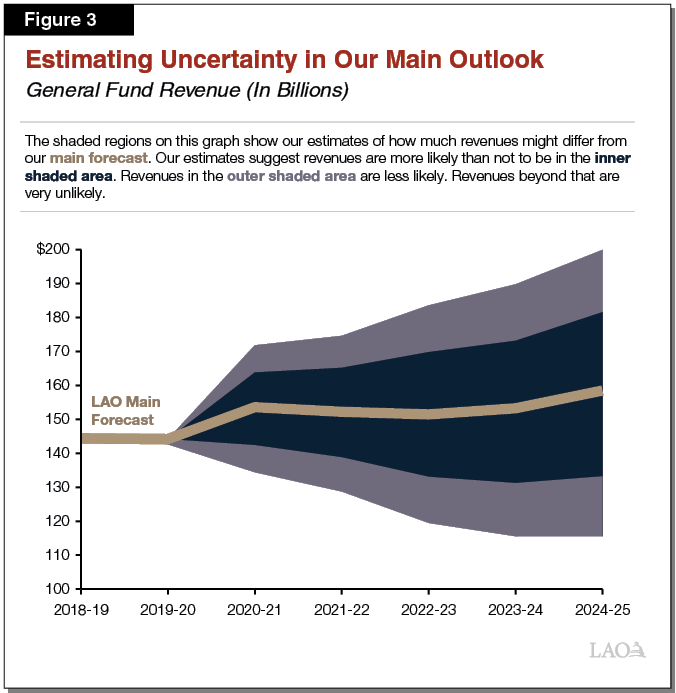
…But Revenues Will Deviate From Our Main Forecast. Despite being our best assessment, our main forecast will be wrong to some extent. A wide range of outcomes is possible. Because of this, in addition to our main forecast, we also estimated how much actual revenues might end up above or below our main forecast. To do so, we looked at how much forecasts tended to differ from actual revenues over the last 50 years. We then estimated the relationship between these past forecast errors and the range of disagreement among professional economic forecasts at the time. Finally, we used this relationship to estimate the likely forecast errors for our current forecast.
Our analysis groups alternative revenue outcomes into three categories based on the chances that they might occur. These three categories, illustrated with the shaded areas in Figure 3, are:
- Most Likely (Darker Shaded Area). These outcomes are most similar to our main forecast. Within this category, unforeseen developments could alter the economic trajectory somewhat, but would not lead to a major departure or paradigm shift. We estimate that revenues are more likely than not to be within this category. For example, we estimate it is more likely than not that 2021‑22 General Fund revenues will be somewhere between $139 billion and $165 billion.
- Less Likely (Lighter Shaded Area). These outcomes represent more significant departures from our main forecast. For example, a combination of negative developments (such as delayed vaccine deployment, widespread business failures, or instability in housing markets) could push revenues into the lower part of this category. Similarly, a combination of positive developments (such as a surge in consumer spending from pent‑up demand, a smooth transition of unemployed workers back to their jobs, or substantial new federal fiscal stimulus) could push revenues into the upper part of this category.
- Very Unlikely (Outside of Lighter Shaded Area). These outcomes are associated with major unforeseen events that dramatically shift the state’s economic situation—such as the COVID‑19 pandemic from the vantage point of 2019 or the housing crisis from the vantage point of 2005.
Likely Significant One‑Time Budget Windfall in the Upcoming Year
Estimated Windfall of $26 Billion in 2021‑22. Figure 4 shows our estimate of the General Fund condition under our main forecast. As the figure shows, the state would have a windfall of $26 billion to allocate in the upcoming budget process. In Figure 4, the windfall is shown as the balance of the Special Fund for Economic Uncertainties (SFEU) in 2021‑22. The windfall is the net effect of three main factors driven by prior‑ and current‑year trends:
- Higher Revenues. Revenue collections to date have been much better than anticipated and are consistent with the economic picture. As such, under our main forecast, we estimate tax revenues are higher by $38.5 billion across 2019‑20 and 2020‑21 compared to budget act estimates.
- Higher Spending on Schools and Community Colleges. General Fund spending on schools and community colleges is determined by a set of constitutional formulas under Proposition 98 (1988), as well as recently enacted statute that creates a new supplemental payment obligation beginning in 2021‑22. Under our outlook, the state allocates about 40 percent of General Fund revenue to K‑14 education each year of the budget window. As such, with General Fund tax revenue increases, our estimate of required General Fund spending on schools and community colleges for 2019‑20 and 2020‑21 correspondingly increases by $14.4 billion.
- Lower Caseload Related Costs. The budget anticipated caseload‑related costs, for example in Medi‑Cal and CalWORKs, would increase substantially. However, as discussed above, these substantial increases have not materialized yet. For those two programs, caseload‑related costs are lower in 2020‑21 (compared to budget estimates) by $2.9 billion.
Figure 4
General Fund Condition Under Fiscal Outlook
(In Millions)
|
2019‑20 |
2020‑21 |
2021‑22 |
|
|
Prior‑year fund balances |
$11,280 |
$5,550 |
$32,159 |
|
Revenues and transfers |
141,851 |
173,464 |
151,725 |
|
Expenditures |
147,581 |
146,855 |
154,360 |
|
Ending fund balances |
5,550 |
32,159 |
29,523 |
|
Encumbrances |
3,175 |
3,175 |
3,175 |
|
SFEU Balances |
$2,375 |
$28,984 |
$26,348 |
|
Reserves |
|||
|
BSA balances |
$16,489 |
$8,683 |
$10,871 |
|
Safety Net Reserves |
450 |
450 |
450 |
|
Total Reserves |
$16,939 |
$9,133 |
$11,321 |
|
SFEU = Special Fund for Economic Uncertainty and BSA = Budget Stabilization Account. |
|||
Despite Windfall, Budget Also Faces an Operating Deficit in 2021‑22. Despite the windfall, the SFEU balance declines from 2020‑21 to 2021‑22 under our estimates (also shown in Figure 4). This has two important implications. First, it means the state faces an operating deficit in 2021‑22. That is, the projected revenue collections in 2021‑22 are less than the projected expenditures in that year. Second, it means the windfall is one time because it is entirely attributable to current‑ and prior‑year revisions, not budget‑year conditions. (We estimate the multiyear operating deficit in the next section. In the nearby box we discuss how it is possible for the state to have a windfall and an operating deficit simultaneously.)
Windfall and Operating Deficit
What Do We Mean by “Windfall”? The main goal of our Fiscal Outlook is to assess how much capacity the budget has to pay for existing and—potentially—new commitments. To answer this question, we compare our projections of revenues to spending under current law and policy. When projected revenues exceed those expenditures, we ordinarily use the term “surplus” to describe the difference. This year, we are using a different term to describe this dynamic: windfall. We use this term for two reasons. First, because the estimated resources available in 2021‑22 are only the result of revisions in prior‑ and current‑year budget estimates. And second, because the available resources are entirely one time under our main forecast.
What Do We Mean by “Operating Deficit”? The windfall is the amount available to allocate in the budget year (2021‑22), whereas an operating deficit occurs over a multiyear period. An operating deficit results when annual revenues are lower than expenditures under current law and policy, causing a year‑over‑year decrease in the Special Fund for Economic Uncertainties. An operating surplus occurs when the reverse is true.
How Can There Be an Operating Deficit and Windfall in 2021‑22? When the Legislature passed the 2020‑21 budget, the state faced a sudden and unknown budget problem. The Legislature took $54 billion in actions to address that problem (for example, it withdrew funds from reserves, shifted costs, reduced spending, and increased revenues). Based on new information learned since the budget was passed, the actual budget problem that needed to be solved in 2020‑21 will be much lower than initially estimated. In short, the Legislature took more actions—predominantly one‑time actions—than were needed to balance the budget this year. However, we continue to project that expenditure growth outpaces revenue growth. This means that, on an ongoing basis, the budget does not have sufficient revenues in each year to cover the cost of current commitments. That is, the state has an operating deficit. (Notably, the multiyear estimates by the Department of Finance at the time of the budget act also showed an operating deficit.)
Approach Assumes Current Policy and Maintains Current Service Levels. The estimates throughout this report rely on a number of important assumptions. For example, we assume: (1) the state makes a constitutional deposit into the Budget Stabilization Account in 2021‑22, bringing the balance of that account to $10.9 billion; (2) state employee compensation reductions are not in effect in 2021‑22; (3) possible program expenditure suspensions included in recent budgets are not operative; and (4) the state maintains spending on COVID‑19 response efforts in 2020‑21 and 2021‑22. Under our current law assumption, we do not assume the state receives any new federal funding and the budget solutions passed subject to receipt of additional federal funding are not reauthorized (the “trigger reductions”). These expenditure assumptions, and others, are described in more detail in “Appendix 1.”
Windfall Could Be Higher or Lower Depending on Revenue and Economic Conditions. The state has a $26 billion windfall under our main forecast. However, as discussed earlier, revenues easily could end up $10 billion or more above or below our main forecast. If revenues in 2020‑21 and 2021‑22 are at the lower end of our most likely alternative outcomes, the windfall would be about $12 billion in 2021‑22. If revenues are at the higher end, the windfall would be closer to $40 billion.
Costs Very Likely to Quickly Exceed Revenues in Future Years
In this section, we describe the budget’s condition over the multiyear period in our outlook—until 2024‑25. First we address trends in revenues and expenditures over this multiyear period and then give our assessment of the budget’s condition under a range of possible outcomes for state revenue collections.
Tax Revenue Growth Is Projected to Grow Slowly Over the Period. Under our main forecast, General Fund revenues from the state’s three major tax revenues would grow from $148 billion in 2021‑22 to $152 billion in 2024‑25. This represents average annual growth of less than 1 percent. While this growth is still positive, it is much slower than our projections for revenue growth before the onset of COVID‑19. For example, in our Fiscal Outlook released in November 2019, we estimated annual revenue growth from these taxes would average 3.7 percent over a similar period. Slower revenue growth puts significant pressure on the budget’s bottom line.
Ongoing General Fund Expenditure Growth of 4.4 Percent. Expenditures, conversely, are expected to grow faster over the next four years compared to our forecasts before COVID‑19. This outlook anticipates overall General Fund expenditures would grow at an average annual rate of 4.4 percent between 2020‑21 and 2024‑25, representing total cost growth of $27.9 billion. In the following paragraphs, we discuss some notable areas of spending growth, which also are shown in Figure 5.
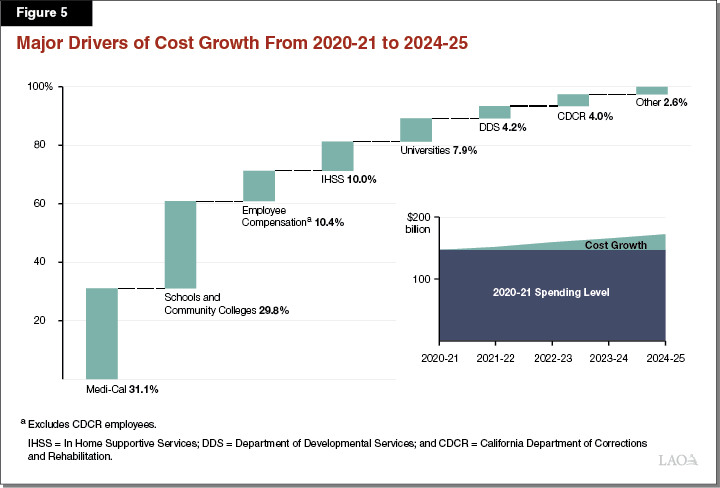
Medi‑Cal. Under our estimates, General Fund spending on Medi‑Cal would increase by $8.6 billion over the period, representing 31 percent of the total cost increase. There are several major drivers of this increase including: (1) lower federal funding for Medi‑Cal when the enhanced federal match for Medicaid programs expires (which we assume occurs the end of 2021); (2) the expiration (without reauthorization) of the managed care organization tax, which occurs midway through 2022‑23 under current law; and (3) underlying cost growth from caseload changes and per capita cost increases.
K‑14 Education. Annual growth in Proposition 98 General Fund spending on K‑14 averages 3.4 percent over the period. Although schools and community colleges represent nearly 40 percent of the General Fund budget, they represent only 30 percent of the total growth in state expenditures. The largest single factor in the increase is the new ongoing statutory supplemental payment for schools, created as part of the 2020‑21 budget. Over the multiyear period, General Fund spending on schools and community colleges grows 3.4 percent per year on average, but absent the supplemental payments, would average 0.8 percent per year (the rate of growth of General Fund revenues). As discussed in the nearby box, growth in school and community college funding exceeds statutory program cost growth through the outlook period both with and without the supplemental payment.
Outlook for Schools and Community Colleges
Funding Changes
Dramatic Upward Revision to Current‑Year Funding Estimates. The state meets the Proposition 98 guarantee through a combination of General Fund and local property tax revenue. Our estimate of the guarantee in 2020‑21 is $84 billion, an increase of $13.1 billion (18.5 percent) over the June 2020 estimate. This increase is the largest change relative to the enacted budget since the passage of Proposition 98 in 1988. Nearly all of the increase is due to our higher General Fund revenue estimates, though a small portion reflects higher property tax estimates.
Growth in 2021‑22 Mainly Attributable to New Supplemental Payments. Under our outlook, the 2021‑22 guarantee grows $595 million (0.7 percent) over our revised 2020‑21 estimates. In addition, the state makes its first supplemental payment ($2.3 billion) on top of the guarantee. The state created the supplemental payments in the June 2020 budget plan to accelerate growth in funding following the anticipated drop in the guarantee.
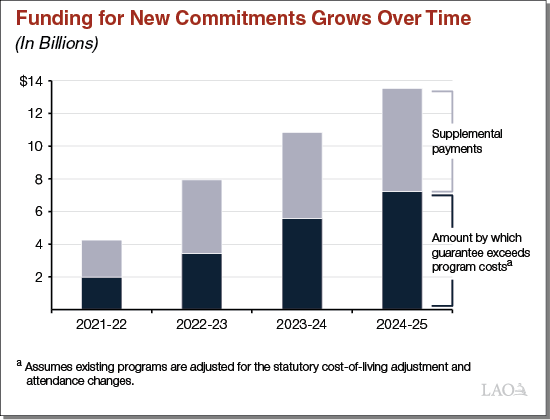
Significant Ongoing and One‑Time Funds Available. After accounting for a 1.14 percent statutory cost‑of‑living adjustment (COLA) and various other adjustments, we estimate the Legislature has $4.2 billion in ongoing funds available for new commitments. In addition, after accounting for the higher 2020‑21 guarantee and various prior‑year adjustments, we estimate the Legislature has $13.7 billion in one‑time funds available.
Guarantee Growing Faster Than Program Costs. Under our outlook, the statutory COLA hovers around 1.5 percent per year after 2021‑22. We also project declines in student attendance. Due to these factors, school and community college programs grow relatively slowly compared with the Proposition 98 guarantee. As shown in the figure, under our main forecast the state has a growing amount of funds available for new commitments. The supplemental payments, which grow to $6.3 billion by 2024‑25, make the difference even larger.
Comments
Legislature Could Pay Down All Existing Deferrals. The 2020‑21 budget deferred $12.5 billion in payments to schools and community colleges. Using one‑time funds to eliminate these deferrals would improve local cash flow and remove pressure on future Proposition 98 funding. Since the deferrals are scheduled to begin in February 2021, the Legislature would need to take early budget action if it wanted to rescind them this year. (If the Legislature does not take early action, it could eliminate the deferrals starting in 2021‑22.)
Rebound in Funding Warrants a Reassessment of the Supplemental Payments. Under our outlook, the Proposition 98 guarantee no longer experiences declines and instead grows more quickly than the COLA over the next several years. Based on these developments, we think the Legislature should reassess the supplemental payments after reviewing all of its budget priorities. The supplemental payments involve long‑term trade‑offs with other parts of the state budget and increase the size of the operating deficit over the multiyear period. To the extent the Legislature remains interested in providing funding on top of the guarantee, it has many options—such as providing a larger one‑time payment without committing to long‑term increases.
Corrections. General Fund spending on the California Department of Corrections and Rehabilitation (CDCR) increases by about $1 billion over the period. This represents only 4 percent of total cost increases, although CDCR is nearly 8 percent of the General Fund budget. Low cost growth for CDCR is primarily the net result of two opposing factors. On the one hand, declines in the inmate population due to several policy changes that will reduce prison terms are expected to lower state costs by allowing the state to reduce the number of prisons it operates. On the other hand, we assume employee compensation costs continue to grow, which offsets these declines. (We discuss our assumptions about employee compensation and CDCR spending in more detail in “Appendix 1.”)
Growth in Safety Net Program Costs Expected Through 2022‑23. While anticipated safety net program caseload growth has not materialized thus far, we do anticipate it to do so in the coming years. For the state’s two major safety net programs described earlier—Medi‑Cal and CalWORKs—we anticipate there will be notable caseload‑related cost growth in 2021‑22 and 2022‑23. For example, in Medi‑Cal, caseload‑related costs result in increased General Fund expenditures of $1.2 billion in 2021‑22 (compared to our estimates in 2020‑21). In CalWORKs caseload‑related costs would increase by nearly $400 million in 2022‑23 (compared to our estimates in 2020‑21).
Operating Deficits Begin in 2021‑22 and Persist Over Multiyear Period. The result of these two trends—faster growth in costs and slower growth in revenues—is that the state faces large and growing operating deficits over our outlook period. As Figure 6 shows, although the budget is expected to have a windfall in 2021‑22, it is also expected to have an operating deficit in that year. The operating deficit is relatively small in 2021‑22, but would grow to around $17 billion by 2024‑25.
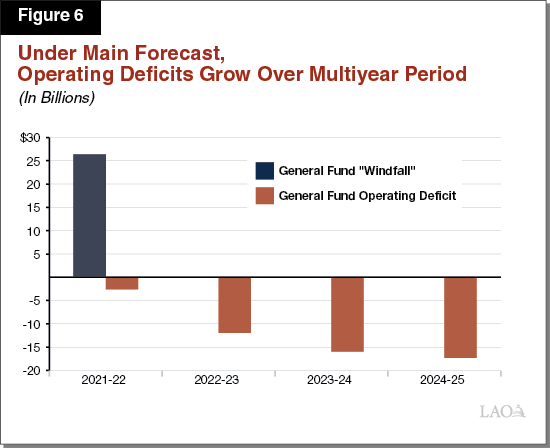
What Revenue Level Would Balance the Budget? While our main forecast suggests the state faces an operating deficit, revenues could differ substantially from our main forecast. What are the chances that revenues could beat our main forecast by enough to erase the operating deficit? For this to happen, revenues would need to be nearly $5 billion higher in 2021‑22. Further, revenues would need to be $35 billion higher in 2024‑25. (These figures exceed the size of the operating deficit due to the requirements of Proposition 2 and Proposition 98, which require increased reserve deposits and school and community college spending with higher revenues.) Our analysis suggests this level of revenue growth is unlikely. Figure 7 shows where the budget “breakeven point” (the point at which revenues are enough for a balanced budget under current law and policy) falls in our range of revenue outcomes (first shown in Figure 3 on page 6). As the graphic shows, the bulk of likely outcomes are below the breakeven point. This suggests that it is unlikely the budget will break even under current law and policy.
Comments and Recommendations
Near‑Term Considerations
Budget “Overcorrected” in 2020‑21 in Response to Unprecedented Uncertainty. Compared to Governor’s budget estimates in early 2020, revenue estimates in June were lower by $42 billion—a historic decline. In light of the unprecedented uncertainty around the state budget, those estimates were reasonable at the time. However, in hindsight, they were too pessimistic. This means the state took a number of almost entirely one‑time and temporary actions to balance the budget—like making withdrawals from reserves, shifting costs, increasing revenues, and reducing spending—that were larger than ultimately necessary. These overcorrections are the reason the state has a significant windfall in 2021‑22.
In Light of Coming Budget Problems and Safety Net Needs, Recommend Restoring Budget Resilience. Just over one‑third of the solutions used to balance last year’s budget (excluding Proposition 98‑related solutions) were tools—like reserves, internal borrowing, and other cost shifts—that the state will need in the coming years. Consequently, we recommend the Legislature use half of the windfall—about $13 billion—for restoring the budget’s fiscal resilience. For example, the Legislature could: make an optional deposit into a state reserve, like the Safety Net Reserve; make a supplemental pension payment; or repay special fund loans made to the General Fund. Each of these actions would allow the state to maintain services in future years when the Legislature is likely to face a budget problem as a result of the projected operating deficits. Making a deposit into the Safety Net Reserve, in particular, would help the state maintain services when demands on the state’s safety net programs increase.
Recommend Using Other Half of Windfall to Address One‑Time Pandemic‑Related Needs. As noted earlier, the COVID‑19 pandemic has had severe health and economic consequences for many Californians. The upcoming budget process provides the Legislature an opportunity to determine how the state could further mitigate those adverse effects. Moreover, the significant windfall provides the Legislature with an opportunity to develop a robust COVID‑19 response that was not feasible when facing a $54 billion budget problem in the spring. As such, we recommend the Legislature use the other half of the windfall—about $13 billion—on one‑time purposes, focusing on activities that mitigate the adverse economic and health consequences of the public health emergency.
Some Early Actions Would Be Reasonable. There is some uncertainty about the size of the windfall that will ultimately materialize. However, given its size, we think it would be reasonable for the Legislature to take early action to use several billion dollars to address some of the state’s immediate needs. Similarly, we think taking early action to undo most of the school‑related deferrals would be reasonable.
Long‑Term Challenges
State Faces Sizeable and Growing Operating Deficits. The state should expect to face an operating deficit during a recession and the years that follow. The existence of an operating deficit during an economic downturn is not inherently a cause for concern, especially if the state also has enough resources (like reserves) to cover the ensuing budget deficits. However, some features of the operating deficits estimated here make them concerning. First, even if the state saved the entire $26 billion windfall in 2021‑22, the savings would be insufficient to cover the operating deficits over the multiyear period. Second, our estimates of the operating deficits grow with each year of the outlook, suggesting they will continue past the multiyear period shown here. Third, our breakeven analysis found it is quite unlikely revenues will end up growing fast enough to cover the growth in costs necessary to maintain current levels of government services.
Recommend Legislature Begin Multiyear Effort to Address Ongoing Deficit Now. Given the multiyear deficits, the budget cannot afford any new ongoing augmentations. In fact, in light of the concerning nature of these operating deficits, we recommend the Legislature use the 2021‑22 budget process to begin to address the state’s ongoing deficit. This could mean, for example, identifying ways to reduce spending or increase revenues in future years. However, the Legislature need not necessarily take these actions this year. Rather, the significant budget windfall in 2021‑22 buys the Legislature time to enact or phase‑in longer‑term changes. For example, reductions to the state’s workforce and some revenue increases can take years before their fiscal effects are fully captured. The Legislature also could consider permanently reauthorizing the MCO tax, which would reduce the budget problem in both 2023‑24 and 2024‑25 by about $2 billion. Lastly, in light of improved Proposition 98 estimates, the Legislature could reassess the planned supplemental payments to schools. (We discuss this in more detail in our report, The 2021‑22 Budget: The Fiscal Outlook for Schools and Community Colleges) Overall, we strongly encourage the Legislature to engage in long‑term planning and consider what needs to be done today to address the budget problem over the multiyear period.
Appendix 1
This section describes the major expenditure‑related assumptions made in our outlook.
State Makes 2021‑22 BSA Deposit. The state is required to make annual deposits into the Budget Stabilization Account (BSA) unless the withdrawal is reduced or suspended under a budget emergency. In 2020‑21, the state suspended the required BSA deposit and withdrew $7.8 billion from the BSA. (We assume the state does not make a “true up” deposit related to 2020‑21.) Because of the anticipated windfall, we assume the state makes its constitutionally required deposit for 2021‑22, which is $2.2 billion under our revenue estimates, and each subsequent year of the outlook period.
Suspensions Are Not Operative. Similar to action taken in 2019‑20, the 2020‑21 spending plan made some spending subject to suspension in 2021‑22. In these cases, statute directs the Department of Finance (DOF) to calculate whether General Fund revenues will exceed General Fund expenditures—without suspensions—in 2021‑22 and 2022‑23. If DOF determines revenues will exceed expenditures, then the programs’ ongoing spending amounts will continue and not be suspended. Otherwise, the expenditures are automatically suspended. Because the state has substantial resources available in 2021‑22 and 2022‑23 under current law and policy, we assume these suspensions are not operative in 2021‑22 and subsequent years.
State Does Not Receive New Federal Funding. Our outlook assumes no major changes in federal policy over the outlook period. Various decisions by the federal government, however, could influence future state General Fund costs, for example, if the federal government provided the state with broad‑based budgetary assistance, resulting in lower General Fund costs. We also assume the state does not reinstate any spending reductions included in the budget act that were subject to federal “trigger” legislation.
Enhanced Federal Match for Medicaid Ends Midway Through 2021‑22. Medicaid is an entitlement program whose costs generally are shared between the federal government and states. Earlier this year, Congress approved a temporary 6.2 percentage point increase in the federal government’s share of cost for state Medicaid programs until the end of the national public health emergency declaration. We assume the declaration expires at the end of calendar year 2021, resulting in an increase in General Fund costs of Medicaid programs midway through 2021‑22. If the federal executive branch allowed the declaration to expire earlier, costs would be higher, and vice versa.
Spending on Disasters Continues Through 2021‑22. The state has been spending money to respond to coronavirus disease 2019 (COVID‑19) mainly through the Governor’s disaster and emergency authorities, for example, under the Disaster Response and Emergency Operations Account. We assume COVID‑19 response efforts continue on their current trajectory in 2020‑21 and that there is additional spending, but it is roughly half as large, in 2021‑22. The state also is likely to incur additional disaster‑related costs, for example, for debris removal and other remediation activities as a result of the fires that began this summer. We have adjusted state expenditures for these efforts and assume the state receives 75 percent reimbursement from the federal government for these disaster‑related activities.
Managed Care Organization (MCO) Tax Expires. For a number of years, the state has imposed a tax on MCOs’ Medi‑Cal and commercial lines of business. We assume the state’s MCO tax expires midway through 2022‑23, consistent with current law. The MCO tax leverages significant federal funding. Annually, revenues from the MCO tax offset almost $2 billion in General Fund Medi‑Cal spending, which means our estimate of the General Fund cost of Medi‑Cal increases by this amount in 2023‑24.
General Fund Salary Increases for State Employees. As part of the 2020‑21 spending plan, the Legislature ratified labor agreements that reduce state employee compensation costs by up to 10 percent. The predominant cost saving policy implemented by these labor agreements is the Personal Leave Program (PLP) whereby employees accept reduced salaries in exchange for time off. For a majority of state employees, labor agreements establish PLP in 2020‑21 and allow PLP in 2021‑22 in the event that the state withdraws funds from the BSA in 2021‑22. We assume that PLP is in effect for all of 2020‑21 but is not in effect in 2021‑22 because our outlook does not assume that the state will need to withdraw funds from the BSA in 2021‑22. Beginning in 2021‑22, we assume that state employees receive General Salary Increases based on our compensation index.
General Fund Costs for the Universities Increase. General Fund spending for the California State University and University of California is more discretionary than many other areas of the budget, with no major federal or state spending requirements. Our university outlook assumes the state maintains existing services at the universities by funding certain expected cost increases. Specifically, we assume cost increases for salaries, benefits, scheduled debt service, and demographically driven enrollment growth. We assume the state bears the full cost of these increases, with tuition held flat. (Tuition has not been raised in the past nine years, and the governing boards of the universities have not signaled potential tuition increases in 2021‑22.) Because General Fund spending for the university is discretionary, different assumptions reasonably could be made.
State Closes Five Prisons Due to Decline in Inmate Population. We estimate that—due to the effects of the COVID‑19 pandemic and several policy changes that will reduce prison terms—the inmate population will remain around 100,000 throughout the forecast period. This is about 20,000 inmates below the 2019‑20 level. Our forecast assumes that the state will accommodate a portion of this decline by closing one prison in 2021‑22 and a second prison in 2022‑23, consistent with the administration’s current plans. However, our forecast also reflects the closure of three additional prisons—for a total of five closures—by 2024‑25, given the size of decline in the population.
Appendix 2, Figure 1
LAO Fiscal Outlook Main Revenue Forecast
(In Billions)
|
2019‑20 |
2020‑21 |
2021‑22 |
2022‑23 |
2023‑24 |
2024‑25 |
|
|
Personal income tax |
$99.5 |
$106.6 |
$104.0 |
$104.6 |
$106.6 |
$109.9 |
|
Sales and use tax |
25.7 |
25.4 |
25.2 |
25.9 |
26.9 |
28.0 |
|
Corporation tax |
13.6 |
16.1 |
17.4 |
15.3 |
13.8 |
14.4 |
|
Subtotals, Big Three Revenues |
($138.8) |
($148.0) |
($146.7) |
($145.7) |
($147.3) |
($152.3) |
|
BSA transfer |
‑$2.5 |
$7.8 |
‑$2.2 |
‑$1.6 |
‑$1.3 |
‑$1.3 |
|
Federal cost recovery |
2.1 |
7.6 |
1.6 |
0.4 |
0.1 |
0.1 |
|
All other revenues |
5.3 |
5.5 |
5.6 |
5.7 |
6.0 |
6.2 |
|
All other transfers |
‑1.9 |
4.5 |
0.1 |
‑0.6 |
‑0.3 |
— |
|
Total Revenues and Transfers |
$141.9 |
$173.5 |
$151.7 |
$149.6 |
$151.7 |
$157.2 |
|
BSA = Budget Stabilization Account. |
||||||
Appendix 2, Figure 2
Spending Through 2021‑22
LAO Baseline Expenditure Estimates (In Millions)
|
Estimates |
Outlook |
||||
|
2019‑20 |
2020‑21 |
2021‑22 |
Change From |
||
|
Major Education Programs |
|||||
|
Schools and community collegesa |
$54,310 |
$57,818 |
$59,547 |
3.0% |
|
|
California State Universityb |
4,702 |
4,047 |
4,281 |
5.8 |
|
|
University of California |
3,938 |
3,466 |
3,714 |
7.2 |
|
|
Child care |
1,710 |
1,644 |
1,868 |
13.6 |
|
|
Financial aid |
1,389 |
2,137 |
2,237 |
4.7 |
|
|
Major Health and Human Services Programs |
|||||
|
Medi‑Calc |
$22,413 |
$22,703 |
$25,925 |
14.2% |
|
|
Department of Developmental Servicesc |
5,014 |
5,846 |
6,038 |
3.3 |
|
|
In‑Home Supportive Servicesc |
4,298 |
4,485 |
5,595 |
24.8 |
|
|
SSI/SSP |
2,732 |
2,705 |
2,679 |
‑0.9 |
|
|
Department of State Hospitals |
1,767 |
1,877 |
1,893 |
0.8 |
|
|
CalWORKs |
650 |
1,135 |
1,422 |
25.3 |
|
|
Major Criminal Justice Programs |
|||||
|
Corrections and Rehabilitation |
$12,465 |
$11,212 |
$11,318 |
0.9% |
|
|
Judiciary |
2,254 |
2,135 |
1,974 |
‑7.5 |
|
|
Debt Service on State Bonds |
$5,092 |
$5,309 |
$5,779 |
8.8% |
|
|
Other Programs |
$24,846 |
$20,337 |
$20,090 |
‑1.2% |
|
|
Totals |
$147,581 |
$146,855 |
$154,360 |
5.1% |
|
|
aReflects General Fund component of the Proposition 98 minimum guarantee, including statutory supplemental payments. bIncludes state contributions for CSU retiree health. cProgram costs in 2021‑22 reflect expiration of enhanced federal share of cost for Medicaid‑funded programs at the end of 2021, which results in General Fund cost growth that is higher than it would be otherwise. |
|||||
Appendix 2, Figure 3
Spending by Major Area Through 2024‑25
LAO Baseline Expenditure Estimates (In Billions)
|
Estimates |
Outlook |
Average |
||||||
|
2019‑20 |
2020‑21 |
2021‑22 |
2022‑23 |
2023‑24 |
2024‑25 |
|||
|
Education |
||||||||
|
Schools and community collegesb |
$54.3 |
$57.8 |
$59.5 |
$61.5 |
$63.0 |
$66.1 |
3.4% |
|
|
Other major education programs |
11.7 |
11.3 |
12.1 |
13.0 |
13.7 |
14.5 |
6.5 |
|
|
Health and Human Services |
36.9 |
38.8 |
43.6 |
47.4 |
49.6 |
51.4 |
7.3 |
|
|
Criminal Justice |
14.7 |
13.3 |
13.3 |
14.4 |
14.7 |
14.5 |
2.1 |
|
|
Debt service on state bonds |
5.1 |
5.3 |
5.8 |
5.6 |
5.8 |
5.9 |
2.8 |
|
|
Other programs |
24.8 |
20.3 |
20.1 |
19.8 |
21.0 |
22.4 |
2.4 |
|
|
Totals |
$147.6 |
$146.9 |
$154.4 |
$161.7 |
$167.8 |
$174.7 |
4.4% |
|
|
Percent change |
‑0.5% |
5.1% |
4.7% |
3.8% |
4.1% |
|||
|
aFrom 2020‑21 to 2024‑25. bReflects General Fund component of the Proposition 98 minimum guarantee, including statutory supplemental payments. |
||||||||
|
Note: Program groups are defined to include departments listed in Appendix 2, Figure 2. |
||||||||