LAO Contact
This is a follow-up to our previous evaluation, published in January 2016.
February 1, 2021
Follow-Up Evaluation of the
District of Choice Program
- Introduction
- Background
- Findings
- Assessment
- Recommendations
- Conclusion
- District Participation. A district opts into the program by registering with the state and its county board of education. The district also adopts a resolution specifying the maximum number of transfer students it will accept.
- Transfer Rules. A student’s “home district” must allow the student to transfer unless the transfer would affect the home district in one of the following ways:
- Exceed an annual cap equal to 3 percent of the home district’s student attendance for the year.a
- Exceed a cumulative cap equal to 10 percent of the home district’s average annual attendance over the life of the program.a
- Exacerbate severe fiscal distress.
- Hinder a court‑ordered desegregation plan.
- Negatively affect racial balance.
- Admission Procedures. A District of Choice must accept all interested students up to its locally approved limit and conduct a lottery if oversubscribed. An oversubscribed district must give priority to the siblings of students who already attend the district, low‑income students, and students from military families.
- Funding Allocations. When a student transfers, the home district no longer generates funding for that student and the District of Choice begins generating the associated funding.b
- Exceed a 3 Percent Annual Cap. A home district may limit the number of students transferring out each year to 3 percent of its average daily attendance for that year. (The annual cap is 1 percent for home districts with more than 50,000 students.)
- Exceed a 10 Percent Cumulative Cap. In addition to the 3 percent annual cap, the law allows a home district to deny transfers that exceed a cumulative cap. (Home districts with more than 50,000 students cannot invoke this cap.) In a 2011 dispute over the calculation of the cap, an appellate court determined that the cap is equal to 10 percent of a district’s average annual attendance over the life of the program. Every student who has transferred since the inception of the program counts toward the cap, including students who are no longer enrolled. Upon reaching this cap, a home district may prohibit all further transfers.
- Exacerbate Severe Fiscal Distress. If a home district receives a negative budget rating from its county office of education (COE) (meaning the district will be unable to meet its financial obligations for the current or upcoming year without corrective action), the district may limit the number of students transferring out. A home district also may limit transfers if its COE determines that the district will fail to meet state standards for fiscal stability exclusively due to the impact of the program.
- Hinder a Court‑Ordered Desegregation Plan. If a home district is operating under a court‑ordered desegregation plan, it may prohibit transfers that would hinder the plan.
- Negatively Affect Racial Balance. A district may limit transfers that would “negatively impact” its voluntary desegregation plan or racial and ethnic balance. Any usage of this provision must comply with Proposition 209 (1996), a constitutional amendment that prohibits schools and other agencies from using race and ethnicity (among other factors) as a factor in public programs.
- Transferring From Nonbasic Aid to Basic Aid District. If a basic aid district enrolls a student from a home district that is not a basic aid district, the basic aid district receives 25 percent of the base grant the student would have generated in his or her home district. The student does not generate any supplemental or concentration funding that would apply in the home district. These types of transfers therefore generate state savings relative to other types of transfers.
- Transferring From Other Basic Aid Districts. If a basic aid district enrolls a student from another basic aid district, the law provides for no exchange of funding between the districts. From the state’s perspective, these transfers are cost neutral.
- Transparency. The data posted by CDE provides detailed information about the number of participating districts, the characteristics of transfer students, and the outcome of transfer applications. Moving forward, this information will allow the Legislature and the public to monitor and assess changes in the program more easily.
- Accountability. The new audit procedure found no systemic problems or districts discriminating against interested students. The few issues identified by the auditors seem to reflect unintentional oversights or districts being unfamiliar with the new requirements. The new complaint process administered by CDE also did not result in any investigations or penalties.
- Access. Our report reflects data for 2018‑19—the first school year after the state implemented the 2017 changes. Although the full effects of these changes will not become clear for several more years, recent trends seem promising. Most notably, the share of low‑income students using the program is up 5 percentage points compared with 2014‑15. The share of Latino students is up nearly 8 percentage points.
Executive Summary
Background
Legislature Faces Decision About Reauthorizing the “District of Choice” Program. A state law adopted in 1993 allows students to transfer to school districts that participate in the District of Choice program. The program requires participating districts to accept interested students regardless of their academic abilities or personal characteristics. Unlike other interdistrict transfer laws, it also allows students to transfer without seeking permission from their home districts. The program currently consists of 45 participating districts enrolling nearly 9,600 transfer students. The program is scheduled to sunset on July 1, 2023.
Legislature Has Made Several Changes to the Program. The Legislature made numerous changes when it last reauthorized the program in 2017. It added new oversight procedures, including a requirement for local auditors to review the districts participating in the program. In addition, it required the California Department of Education (CDE) to collect and publish program data. Regarding the transfer application process, the Legislature required participating districts to make application information easily accessible and prioritize applications from low‑income students. These changes were intended to (1) create a mechanism for monitoring compliance with program rules, and (2) increase participation among student subgroups that transfer at lower rates, including low‑income students and Latino students. Several members of the Legislature also wanted to know how the program was affecting racial balance among districts.
Report Provides Our Second Evaluation. We published our first evaluation of the program in January 2016. The 2017 reauthorization required our office to produce a follow‑up evaluation using the newly available data to assess the latest changes and make recommendations regarding further extensions of the program. This report responds to that requirement.
Key Findings
New Oversight Procedures Uncovered No Major Issues. The new oversight procedures found no systemic problems or districts discriminating against interested students. Local auditors did flag three small districts for missing paperwork. These issues seemed to reflect unintentional oversights or districts being unfamiliar with new requirements, and CDE worked with these districts to ensure they would comply moving forward.
Participation by Low‑Income Students Has Increased. Similar to our previous evaluation, we found low‑income students use the program at relatively low rates compared with other students in their home districts. Participation by these students has increased, however, from 27 percent of transfer students in 2014‑15 to 32 percent in 2018‑19.
Participation by Latino Students Has Increased. Compared with their share of home district enrollment, Latino students use the program at lower rates, whereas Asian students and white students use the program at higher rates. In terms of total participating students, however, Latino students recently overtook white students as the largest users of the program. As of 2018‑19, participating students are 40 percent Latino, 28 percent Asian, and 26 percent white (less than 7 percent belong to other groups).
Modest Effects on Racial Balance. The program appears to increase racial balance for some districts and reduce it for others, although the changes for most districts are small. Compared to a hypothetical alternative in which all students return to their home districts, the overall effect of the program on racial balance is a minor decrease. Compared to a more likely alternative in which only some students return to their home districts, the overall effect appears neutral.
Program Provides Students With Additional Educational Options. The program allows students to access educational options that are not offered by their home districts, such as schools with specialized themes or instructional models. In the specific areas we examined—including college preparatory courses, arts and music, and foreign languages—students gained access to an average of five to seven courses not offered by their home districts. Nearly all students transfer to districts with higher test scores than their home districts.
Home Districts Often Take Steps to Improve Their Instructional Offerings. As we reported in our previous evaluation, home districts often respond to the program by taking action to gain clarity about the priorities of their communities and by implementing new educational programs. We also found that the home districts most affected by the program have made above‑average gains in student achievement over the past several years, although the role of the program in these gains is difficult to determine.
Recommendations
Reauthorize the Program. The program provides quality educational options for a range of students, the new oversight mechanisms uncovered no notable concerns, and the share of disadvantaged students using the program has risen. We think these strengths merit reauthorization, potentially on a permanent basis. Alternatively, the Legislature could reauthorize the program for at least five more years and reassess trends near the end of that period. In either case, the state could continue monitoring program data and the Legislature could have future oversight hearings to ensure the program continues to meet its goals.
Repeal Cumulative Cap. We recommend repealing a cap that limits the cumulative number of students who can transfer out of each district. Once reached, this cap disallows all future participation regardless of student interest or the quality of transfer options available. Without changes to the cap, program participation seems likely to drop over the next several years. In addition, we understand the original purpose of the cap was to mitigate fiscal impacts on home districts, but the cumulative number of transfers over the life of the program does not seem to be a good indicator of a district’s current fiscal condition.
Allow Later Application Deadline. Current law requires students to submit their transfer applications for the upcoming school year prior to January 1. This deadline falls before some students and families have begun examining their options, and it limits participation for students who have less existing awareness of the program, including low‑income students. We recommend delaying the deadline, potentially to March 1.
Increase Funding for Basic Aid Districts. The 2017 reauthorization significantly reduced funding for students transferring to basic aid districts (districts with high levels of local property tax revenue). We found that this reduction has led these districts to accept fewer transfer students. In addition, the students transferring to these districts are more likely to be disadvantaged than other transfer students. We recommend setting the funding rate closer to pre‑2017 levels and providing a higher rate for low‑income students and English learners.
Continue Collecting Data. We recommend the state continue collecting data about the number and characteristics of students who transfer through the program. Ongoing data collection would help the Legislature monitor the 2017 changes as well as the effects of our recommendations. If the Legislature were interested in developing a greater understanding of why participation varies by student subgroup, it could consider funding a survey of students and parents. The findings from this survey could inform future efforts to promote participation by students who use the program less frequently.
Introduction
California Has District of Choice Program. California has several laws designed to give parents a choice about which school their children attend. One of these laws is called the District of Choice program. This program allows a student living in one school district to transfer to another school district that has deemed itself a District of Choice. The program differs from other interdistrict transfer laws because it does not require students to apply with the home districts they are leaving.
Legislature Faces Decision About Whether to Extend the Program. Though the state initially adopted the District of Choice program as a five‑year pilot, it has reauthorized the program several times. The most recent reauthorization extended the program until July 1, 2023. As we describe later in this report, the program currently consists of 45 participating school districts enrolling nearly 9,600 transfer students. Participating districts are located throughout the state, with the highest concentrations in the Counties of Los Angeles, Kern, and Sonoma.
Law Requires Follow‑Up Evaluation. At the direction of the Legislature, we published our first evaluation of the program in January 2016. To assist its deliberations about the future of the program, the Legislature directed our office to produce another evaluation using newly available data. Chapter 15 of 2017 (AB 99, Committee on the Budget) sets forth the requirements for this second evaluation:
“The Legislative Analyst shall conduct, after consulting with appropriate legislative staff, a comprehensive evaluation of the [District of Choice program] and prepare recommendations regarding the extension of the program. The evaluation shall incorporate the [demographic, fiscal, and academic data specified in law] and shall be completed and submitted, along with the recommendations regarding extension of the program and… implementation of the program to ensure access to the program for all pupils, to the appropriate education policy committees of the Legislature and to the Department of Finance by January 31, 2021.”
Report Has Four Main Sections. This report responds to the statutory evaluation requirement. The first section outlines the main features of the program and compares it with other interdistrict transfer options in California. The second section describes the findings that emerged from our analysis of the available data. The third section assesses the program and discusses a few policies limiting access for interested students. The final section makes recommendations regarding the future of the program.
Background
In this section, we describe the origins and main features of the District of Choice program. We also review the most recent changes to the program and explain how the program differs from other transfer options in the state.
History
Legislature Adopted District of Choice Program in 1993. The District of Choice program grew out of an effort in the early 1990s to increase the choices available to students within the public school system. Two main considerations motivated this effort. First, many supporters believed choice would improve public education by encouraging schools to be more responsive to community concerns and by allowing parents to choose the instructional setting best suited to the interests of their children. Other supporters were concerned about a proposal to provide state funding for students attending private schools and thought expanding choice among public schools was preferable. The Legislature responded to these concerns by enacting three laws. The first, the Charter Schools Act of 1992, allowed the establishment of charter schools that could operate independently from school districts. The second, enacted in 1993, gave students more options to transfer to other schools within the same district. The third law, also enacted in 1993, created the District of Choice program. Although this law was not the first to allow interdistrict transfers, it was designed to be much less restrictive.
Legislature Has Reauthorized the Program Six Times. The 1993 legislation implemented the District of Choice program as a five‑year pilot, with the first transfers occurring in the 1995‑96 school year. The Legislature extended the program for five more years in 1999, followed by additional extensions in 2004, 2007, 2009, 2015, and 2017. The last extension authorized the program until July 1, 2023.
Program Basics
A School District May Decide to Become a District of Choice. Figure 1 summarizes the key components of the District of Choice program. To participate in the program, a district must register with the California Department of Education (CDE) and its county board of education. The governing board of the district must also adopt an annual resolution specifying the maximum number of transfer students it is willing to accept. Each district determines its own transfer limit, typically after assessing multiple factors including facility space, staffing requirements, and overall enrollment. In most cases, a district adopts a specific transfer limit for each grade level.
Figure 1
Key Components of the District of Choice Program
|
|
|
|
|
|
|
|
|
|
|
|
|
|
|
|
|
|
|
aFor districts with more than 50,000 students, the annual cap is 1 percent and the cumulative cap is not applicable. bDifferent rules apply for basic aid school districts. |
Students Can Leave Their Home District and Attend a District of Choice. Once a district has deemed itself a District of Choice, it may begin accepting attendance applications from students in other districts. Interested students apply directly to the District of Choice and do not need to seek permission from the home districts they attend. (As we discuss below, state law allows a home district to prohibit transfers under certain conditions.) Students seeking to transfer for the upcoming school year must submit their applications prior to January 1 of the current school year. A district must give each applicant a provisional notification of its decision to accept or deny the transfer application by February 15, with final notification required by May 1. Although transfer students are not guaranteed attendance at specific schools, most districts allow students to rank their preferred schools and honor any preferences that do not displace students already enrolled. Transfer students accepted into a district are not obligated to attend. They may withdraw their applications at any time and return to their home districts. The law waives the regular application deadline for students from military families relocated within the past 90 days. These students may transfer midyear to any district in the program with available space.
A District of Choice Must Accept All Interested Students up to Its Local Limit. A distinguishing feature of the District of Choice program is the requirement for a district to accept all interested students up to the number specified in its board resolution. The law explicitly prohibits giving any consideration to academic or athletic performance or to the cost of educating a student. If the number of transfer applications exceeds a district’s locally approved limit, the district must conduct a lottery at a public meeting to determine which students it will accept. This lottery must give priority to students whose siblings already attend the district, low‑income students, and students from military families (in that order). The law only allows districts to deny transfer requests on an individual basis under two limited circumstances. First, a provision dating to 1993 allows a district to reject an application that would require it to create a new program to serve an incoming student. A subsequent reauthorization of the program, however, largely negated this provision by prohibiting districts from rejecting English learners and students with disabilities. Second, the law provides for a district to deny an application that would displace a student who already attends or resides in the district.
Accepted Students Do Not Need to Reapply Each Year. Another distinguishing feature is the provision allowing students to remain in the program until they graduate. Once a district accepts a student through the program, it can revoke the transfer only through formal expulsion proceedings. The law also allows a district to revoke all transfers if it withdraws from the program. In the case of withdrawal, the district must allow high school students to remain until they graduate.
Program Sets Rules for Communication With Students… The law requires each participating district to post application information on its website, including the procedures for submitting an application and the relevant deadlines. The law also requires districts to make public announcements about the availability of the District of Choice program. Any communication from the district must be “factually accurate” and avoid targeting students based on their academic performance, athletic ability, or any other personal characteristic. Finally, the law requires districts to provide translated application information if they receive students from districts in which more than 15 percent of students speak a primary language other than English.
…And With Home Districts. The law requires participating districts to share information with the districts students are leaving at various points. Specifically, a District of Choice must provide each home district a preliminary list of approved transfers for the upcoming school year by February 15 and an updated list by May 2. These communication requirements are intended to help home districts develop budgets and staffing levels that account for the number of students transferring out. (State law requires districts to make certain preliminary staffing decisions for the upcoming year by March 15 and final decisions by May 15.)
Home Districts Can Prohibit Transfers for a Few Reasons. The law allows a home district to prevent a student from transferring out under a few circumstances. Specifically, a home district may prohibit a transfer that would affect it in one of the following ways:
Outside of these five provisions, the law prohibits home districts from adopting any policies to block or discourage students from transferring out. In addition, home districts may not prohibit transfers by students from military families for any reason.
Funding
Funding Follows Students to Their District of Choice. California funds school districts based on student attendance, with per‑pupil funding rates determined by the Local Control Funding Formula. This formula, adopted in 2013, establishes a base grant for all students that varies by grade span but is otherwise uniform across the state. Low‑income students and English learners generate a “supplemental grant” equal to 20 percent of the base grant. In districts where these students make up more than 55 percent of the student body, the formula also provides a “concentration grant.” The total allotment for each district is funded through a combination of state aid and local property tax revenue. When a student transfers, the home district no longer generates funding for that student and the District of Choice begins generating the associated funding. Another state policy, however, tends to mitigate the fiscal effect on home districts for one year. Specifically, the state credits all districts with the higher of their current‑ or prior‑year attendance for funding purposes.
Lower Funding Rate for Basic Aid Districts. About 10 percent of school districts have local property tax revenue exceeding their allotments calculated under the Local Control Funding Formula. The state allows these districts to keep this additional revenue and treat it like other general purpose funding. These districts are known as basic aid districts (a term derived from the section of the State Constitution guaranteeing all school districts at least $120 per student from the state.) Under the District of Choice program, funding for basic aid districts works differently than it does for other districts:
Oversight
Law Requires Participating Districts to Collect and Report Data. The law requires each participating district to track the following information: (1) the total number of students applying to enter the district each year; (2) the outcome of each transfer application (granted, denied, or withdrawn), as well as the reason for any denials; (3) the race, ethnicity, gender, socioeconomic status, and home district of each student transferring into the district; (4) the number of English learners and students with disabilities transferring into the district; and (5) the number and characteristics of students receiving transportation from the district. The law also requires each district to prepare an annual report summarizing this information. No later than October 15 each year, the district must provide all adjacent districts with a copy of this report, as well as a notice indicating its intent to remain in the program for the following school year. In addition, the law requires districts to report this information to CDE. The department collects district data on applications and school transportation as part of an annual survey it administers to all districts. It collects data on the characteristics of transfer students through the California Longitudinal Pupil Achievement Data System (CalPADS). The law requires CDE to publish a summary of the information it collects on its website. Whereas the requirement for districts to produce a local report dates to the original version of the program, the requirement for CDE to collect and publish data began in 2018‑19. The state currently provides CDE an annual General Fund appropriation of $117,000 to support these activities.
School Districts in California Undergo Annual Audits. Every school district in California undergoes an annual audit to assess the accuracy of its financial statements and determine whether it complied with various state and federal laws. A district hires its auditor from a list of approved firms. The auditor then conducts an independent review following procedures set forth in the school district audit manual developed by the state. If the district is out of compliance with any of the applicable laws, the auditor communicates the finding in its audit report. Depending on the nature of the finding, the district’s COE or CDE will work with the district to implement a corrective action plan.
Parts of the District of Choice Program Subject to Audit. Since 2018‑19, the state has required auditors to ascertain whether districts complied with certain parts of the District of Choice program. Specifically, an auditor must verify that a participating district (1) registered with the state and its county board of education, (2) accepted all interested students up to its locally approved limit, (3) conducted a lottery if it received more applications than it could accept, and (4) collected all data required by law. CDE generally is responsible for addressing any audit findings identified in these areas.
Law Authorizes Special Complaint Process. Separate from the audit process, the law requires CDE to investigate any complaints it receives about districts (1) participating in the program without registering or (2) failing to report required data. If the department substantiates a complaint, it must withhold funding generated by the district’s transfer students until the district has registered for the program and provided any missing data.
Changes to the Program
2017 Reauthorization Made Several Notable Changes. Several important components of the program reflect changes the Legislature adopted in 2017 when it reauthorized the program. Figure 2 shows how the current version of the program differs from the previous version. The most notable changes involved (1) making districts subject to annual audit, (2) requiring CDE to collect and report data, (3) adding transfer priority for low‑income students, (4) reducing funding for basic aid districts, and (5) requiring districts to make application information available online. Most of these changes took effect in 2018‑19. The funding reduction for basic aid districts, however, became effective in 2017‑18.
Figure 2
State Made Notable Changes to District of Choice Program in 2017
|
Issue |
Prior Law |
Current Law |
|
Oversight |
||
|
Auditing |
District not subject to regular audit process. |
Local auditors required to review district compliance with program rules each year. |
|
Registration |
Not required. |
Districts required to register with the state and their county boards of education. |
|
Data reporting |
CDE not required to publish data about the program. |
CDE required to maintain a list of Districts of Choice and publish data about the program. |
|
Application Process |
||
|
Transfer priority |
Siblings of students who already attend the district and students from military families. |
Siblings of students who already attend the district, low‑income students, and students from military families. |
|
Application forms |
No specific requirements. |
Forms and application information must be posted online, sometimes in multiple languages. |
|
Other |
||
|
Funding for basic aid districts |
70 percent of LCFF base rate. |
25 percent of LCFF base rate. |
|
Information shared with home districts |
A summary of the transfer requests approved for the upcoming year by May 15. |
A preliminary list of students transferring for the upcoming year by February 15 and an updated list by May 2. |
|
CDE = California Department of Education and LCFF = Local Control Funding Formula. |
||
Other Transfer Options
State Has a Few Other Interdistrict Transfer Options. In addition to the District of Choice program, the state has a few other laws allowing students to transfer to other school districts. Each law functions independently of the others and includes different requirements for the students and districts involved. Many districts accept students through more than one option. (All of the interdistrict transfer options are separate from an intradistrict transfer law that allows students to attend other schools within the same district if space is available.)
Interdistrict Permit System Allows Transfers With the Agreement of the Districts Involved. A longstanding state policy allows a student to transfer from one district to another when both districts sign a permit consenting to the transfer. With respect to students leaving, most districts have a limited set of reasons for which they will release a student. Examples include the availability of child care in the other district or the attendance of a sibling already enrolled in the other district. Students who are denied a release may appeal the decision to their county board of education. After students receive their permits, their new districts typically require them to maintain satisfactory attendance, behavior, and grades as a condition of remaining enrolled. Chapter 781 of 2019 (AB 1127, Rivas) made several changes to the interdistrict permit system. Most notably, the law now prohibits districts from granting or denying a permit application based on a student’s academic performance, athletic ability, or any other personal characteristic. The law also contains a new requirement for districts to provide “transportation assistance” to low‑income students upon request.
Districts May Accept Transfers Based on Parental Employment. A state law adopted in 1986 allows a district to admit any student who has at least one parent or legal guardian employed within the boundaries of that district for at least ten hours during the school week. (The law is frequently known as the “Allen Bill” after its author, Assembly Member Doris Allen.) If a district participates in this program, it may not deny a transfer based on a student’s personal characteristics, including race, ethnicity, parental income, and academic achievement. It may, however, deny the transfer of a student who would cost more to educate than the additional funding generated for the district. The law also allows the districts from which students are leaving to prohibit transfers that exceed certain annual limits, which vary based on district size. Prior to 2016, this program operated under a series of temporary extensions. Chapter 106 of 2016 (AB 2537, O’Donnell) made the law permanent.
Open Enrollment Act Formerly Provided Another Transfer Option. In 2010, the state enacted the Open Enrollment Act, a law designed to provide additional options for students attending schools with low test scores. The law required the state to rank schools according to the performance of their students on state assessments and place the 1,000 schools with the lowest scores on the “Open Enrollment List.” A student attending one of these schools could transfer to another school within or outside of the district, provided that school had higher test scores and available space. In 2016‑17, the state implemented a new accountability system under which it publishes multiple measures of performance for each school based on test scores, graduation rates, attendance rates, and suspension rates, among other indicators. The new system does not specify a mechanism for ranking schools, and the state no longer publishes the Open Enrollment List. Due to these changes, transfers under this law are no longer available.
Findings
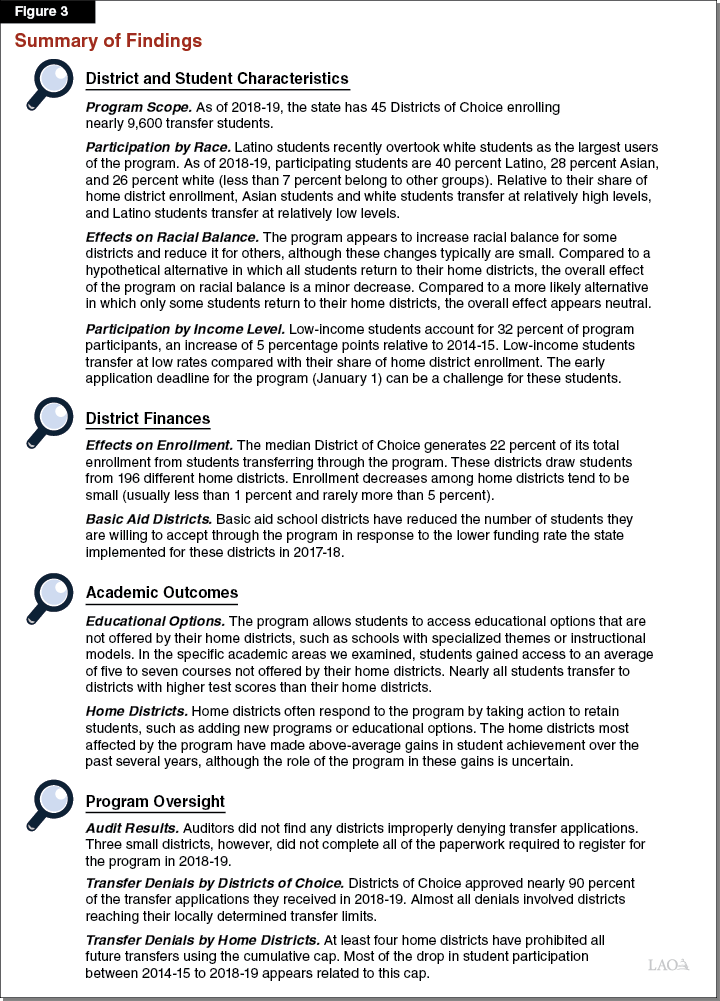
In this section of the report, we share our findings, organizing them around the areas of district and student characteristics, districts finances, academic outcomes, and program oversight. Within each section, our analysis responds to the statutory requirements for the evaluation as well as questions posed by the Legislature and legislative staff. Most of our findings reflect data for 2018‑19—the first year in which the state collected complete data for the program. Where possible, we make comparisons to the results in our previous evaluation, which reflected 2014‑15 data. We also draw upon several district interviews we conducted during the fall of 2019 and a larger set of interviews we conducted for our previous evaluation. Figure 3 summarizes our findings, which we discuss in detail below.
District and Student Characteristics
Below, we provide information about the districts participating in the program and the characteristics of students who transfer to them. We also compare these students to their home districts and explore how the program affects racial balance. Finally, we analyze differences in participation based on family income and a few other student characteristics.
Overview of Participation
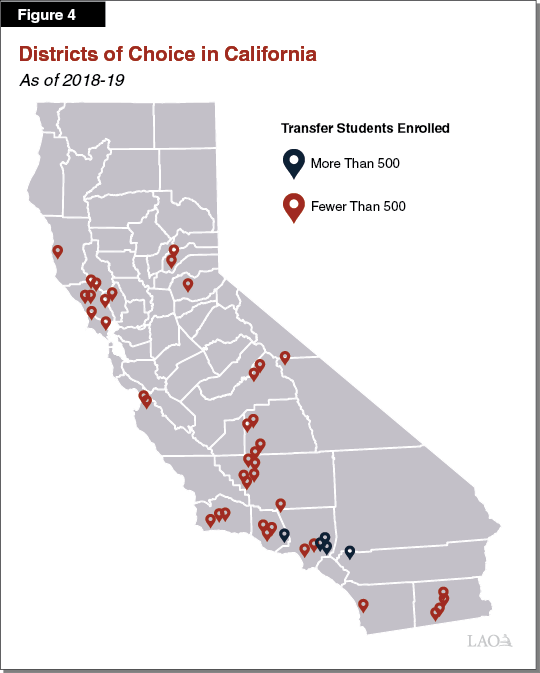
State Has 45 Districts of Choice. The state had 45 registered Districts of Choice during the 2018‑19 school year, representing 5 percent of the 944 districts in the state. As Figure 4 shows, participating districts are located throughout the state. The highest concentrations are located in Los Angeles and surrounding counties, the North Bay, and the southern part of the Central Valley.
Districts of Choice Enroll About 9,600 Transfer Students. We identified 9,568 students using the District of Choice program as of the 2018‑19 school year, representing less than 0.2 percent of students in the state. This total reflects our estimate of all transfer students actively enrolled in 2018‑19, regardless of the year in which they first transferred. Approximately two‑thirds of these students are in elementary or middle school and one‑third are in high school (similar to the state as a whole). As Figure 5 shows, these students are concentrated among five large districts. One district, the Walnut Valley Unified School District in eastern Los Angeles County, enrolls more than 3,000 participating students—nearly one‑third of the total. The five largest districts combined enroll nearly 7,000 students (more than 70 percent of the total). As we discuss in the box below, most Districts of Choice also accept students through the interdistrict permit system. (On a statewide basis, the interdistrict permit system has far more participating districts and students.)
Figure 5
Participation in the District of Choice Program
2018‑19
|
District(s) |
District of Choice Students |
Share of All District of Choice Students |
Total District Enrollmenta |
Share of Enrollment From District of Choice Program |
|
Walnut Valley Unified |
3,025 |
32% |
13,879 |
22% |
|
Oak Park Unified |
1,424 |
15 |
4,579 |
31 |
|
Riverside Unified |
992 |
10 |
40,708 |
2 |
|
West Covina Unified |
790 |
8 |
8,754 |
9 |
|
Glendora Unified |
734 |
8 |
7,198 |
10 |
|
Basic aid districts (18) |
969 |
10 |
12,440 |
8 |
|
All other districts (22)b |
1,634 |
17 |
30,954 |
5 |
|
Totals |
9,568 |
100% |
118,512 |
8%c |
|
aExcludes students attending independently managed charter schools. bIncludes five districts with no students currently participating in the program. cThis average is affected by a handful of relatively large districts with relatively few participating students. The median is 22 percent. |
||||
Comparing the District of Choice Program With Interdistrict Permits
District of Choice Program Is Small Compared With the Interdistrict Permit System. Whereas 9,568 students were using the District of Choice program in 2018‑19 (less than 0.2 percent of all students statewide), 146,109 students were using an interdistrict permit (2.4 percent of students). Similarly, the 45 districts participating in the District of Choice program compare with the 635 districts accepting students through interdistrict permits. Although we are uncertain what factors account for this difference, we did ask district administrators about potential explanations. Several noted that in cases where home districts were willing to sign interdistrict permits, participation in the District of Choice program often seemed unnecessary. Others believed districts preferred the interdistrict permit system because it provides districts with more control (such as the ability to revoke transfers by students with poor behavior or grades).
Most Districts of Choice Accept Students Through Interdistrict Permits. We found that 31 of the 45 participating districts accept students through both the District of Choice program and the interdistrict permit system. These 31 districts had 4,870 students enrolled through interdistrict permits in 2018‑19—about half as many as they received through the District of Choice program. (The state generally does not publish statewide or district‑level data for the interdistrict permit system. Our analysis relies upon a special data extraction prepared by the California Department of Education.)
Apart From Five Largest Districts, Most Districts of Choice Are Small and Rural. The five districts with the greatest participation range from medium to large in size. All five are located in urban or suburban areas, and all are unified (enrolling students in grades K through 12). These characteristics differ notably from the other 40 districts participating in the program. Among these other districts, 78 percent have fewer than 1,000 total students, 78 percent are located in rural parts of the state, and 83 percent are elementary districts (enrolling students in grades K through 8 only).
Fewer Participating Districts Compared With 2014‑15. We estimate that 49 districts were participating in the program in 2014‑15. This total includes the 47 districts identified in our previous evaluation and two small districts we identified later. Between 2014‑15 and 2018‑19, 13 of these districts left the program and 9 new districts joined the program. This turnover occurred mainly among small districts. In both 2014‑15 and 2018‑19, the same five large districts accounted for most of the participating students.
Most Districts Leaving the Program Cited Reductions in State Funding or Increases in Resident Enrollment. We analyzed the characteristics of the 13 districts leaving the program and surveyed their superintendents. We found that four of these districts had no transfer students enrolled as of 2014‑15, making their departure from the program largely a formality. The remaining nine districts also had relatively low participation, averaging around 20 transfer students each as of 2014‑15. Of the six districts responding to our survey, three were basic aid districts that cited the lower funding rate the state adopted in 2017‑18. According to these districts, the funding generated by their transfer students no longer justified the costs of the program. Two districts attributed their decision to increases in their residential enrollment. These districts indicated that due to space and other constraints, they no longer were interested in accepting students from other districts. The last district indicated that permissive interdistrict permit policies adopted by other districts in its county had made its participation in the District of Choice program unnecessary.
Fewer Participating Students Compared With 2014‑15. We estimate that 10,339 students were using the program in 2014‑15. (This total reflects the estimate from our previous evaluation, with an adjustment for students attending the two districts we identified later.) Compared with 2014‑15, program participation in 2018‑19 is down 771 students (7.5 percent). This decrease is the net change resulting from (1) a decrease of 1,304 students among districts that participated in the program in both 2014‑15 and 2018‑19, (2) a decrease of 180 students associated with the 13 districts that left the program after 2014‑15, and (3) an increase of 713 students associated with the 9 districts that recently joined the program. The cumulative cap on transfer activity appears to be a major factor in the overall decrease over the period. We provide more detail on these trends later in this report.
Participation by Race
Latino Students Account for the Largest Share of Participating Students. Data for the District of Choice program show that participating students were 40 percent Latino, 28 percent Asian, and 26 percent white as of 2018‑19. All other subgroups account for a much smaller share of program participants. Students indicating they belong to two or more races accounted for 3.5 percent of program participants. Black students accounted for 2.4 percent, and American Indian and Pacific Islander students each accounted for less than 0.5 percent.
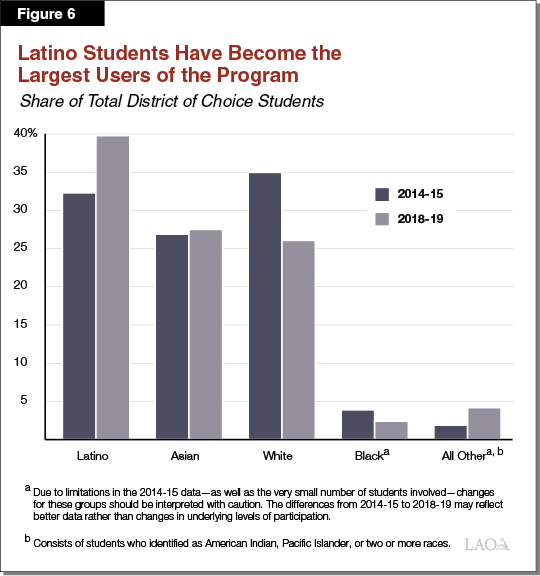
Share of Latino Students Rising Over Time. Figure 6 shows how the program has changed from 2014‑15 to 2018‑19. Most notably, Latino students overtook white students as the largest users of the program over this period. This increase is due to a majority of participating districts (about 60 percent) increasing their share of Latino students, including a significant increase in Riverside Unified (one of the five large districts). In addition, two smaller districts with especially high shares of Latino transfer students (72 percent for one district and 97 percent for the other district) joined the program after 2014‑15.
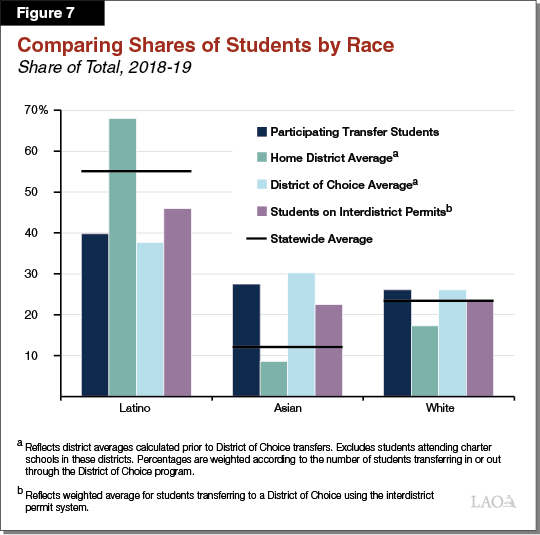
Asian Students Participate at the Highest Levels Relative to Their Share of Home District Enrollment. After analyzing trends in overall participation, we examined relative participation levels for the three largest groups of students using the program. Figure 7 compares the share of students using the program with the average among home districts. Although Latino students account for the largest users of the program, they participate at relatively low levels compared with their overall share of home district enrollment. Specifically, they average 68 percent of home district enrollment but only 40 percent of participating transfer students. By contrast, Asian students have relatively high participation, accounting for 9 percent of home district enrollment and 28 percent of participating transfer students. White students also have relatively high participation, accounting for 17 percent of home district enrollment and 26 percent of participating students. As the figure shows, these trends are not unique to the District of Choice program. Similar differences in participation are evident in the interdistrict permit system.
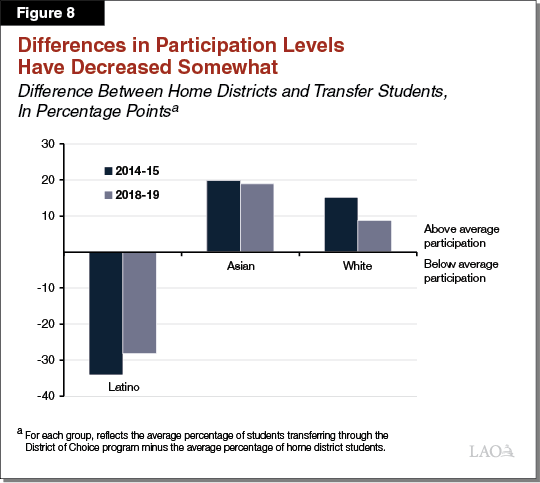
Differences Between Participating Students and Home Districts Have Narrowed Somewhat Over Time. The differences in participation by race mirror the findings from our previous evaluation of the program. Compared with our previous findings, however, the differences between participating transfer students and their home districts have narrowed somewhat (Figure 8). In 2014‑15, the difference between the share of Latino students using the program (32 percent) and their share of home district enrollment (66 percent) was 34 percentage points. In 2018‑19, this difference had decreased to 28 percentage points. Differences in the share of white students using the program also have decreased to some extent.
Effects on Racial Balance Analyzed Using the Ethnic Diversity Index (EDI)... Overall student characteristics and relative participation levels do not necessarily indicate how the program is affecting racial balance among districts. To address the Legislature’s questions about changes in racial balance, we rely upon a version of the EDI, an index developed by the Ed‑Data Partnership in the 1990s. The EDI measures the extent to which a district’s students are distributed evenly among the racial categories tracked by the state. It can theoretically range from 0 (for a district in which all students belong to a single race) to 100 (for a district with equal numbers of students from every category). For our analysis, we adjusted the EDI to focus on Latino, Asian, and white students (the largest users of the program). For an individual district, incoming or outgoing transfer students increase the EDI when they reduce the differences in the share of enrollment attributable to each group. Conversely, they decrease the EDI when they magnify these differences. (Our analysis focuses specifically on changes at the district level. School level transfer data are not available.)
…And Two Counterfactual Scenarios. To analyze changes in racial balance, we compared the current distribution of students with the distribution that would exist in the absence of the program. Our first counterfactual assumed all students would attend their home districts. Although this assumption provides a baseline, we do not think it reflects how students would react to the end of the program. District administrators often told us students and parents had strong feelings about transferring. In a survey involving a similar program in Wisconsin, only about one‑third of parents indicated they were “very likely” to send their children to their home districts if the interdistrict transfer option did not exist. Another one‑third said they were “not at all likely” to do so. Our second counterfactual simulates a more realistic alternative by assuming about one‑third of students using the program would transfer to the same districts using the interdistrict permit system, another one‑third would attend their home districts, and the remainder would pursue some other option (such as a charter school). Our second counterfactual accounts for differences in the willingness of home districts to grant interdistrict permits. It also assumes low‑income students would be much more likely to attend their home districts than high‑income students. (District administrators told us that higher‑income students were more likely to have explored other options before settling on the District of Choice program.)
Districts of Choice Becoming Slightly More Balanced, Home Districts Slightly Less. Figure 9 contains our estimates of the change in EDI for the subset of districts most affected by the program. (The figure contains all districts with at least 300 total students and at least 2 percent of their enrollment transferring in or out through the program.) The top portion shows the effect of the program relative to the alternative in which all students return to their home districts. Relative to this baseline, Districts of Choice are becoming slightly more balanced overall, with their EDI increasing by an average of 0.7. Home districts, on average, are becoming slightly less balanced, with their EDI decreasing by an average of 1.0. The bottom portion shows the effect of the program relative to our second counterfactual, which accounts for the likelihood that students would pursue a mix of options. Relative to this baseline, the increase in the EDI for Districts of Choice still averages 0.7. The average decrease for home districts, however, drops to 0.4. The effect on home districts is smaller in the second counterfactual because of the assumption that some of the students who live in those districts would not attend those districts even if the program did not exist. In practical terms, the effect of the program on racial balance in most districts is small. For example, an EDI decrease of 1.0 would be the equivalent of a district that is 70 percent Latino and 30 percent white becoming 71 percent Latino and 29 percent white. Although Figure 9 shows a few districts are experiencing somewhat more notable increases or decreases in their EDI, these districts are exceptions.
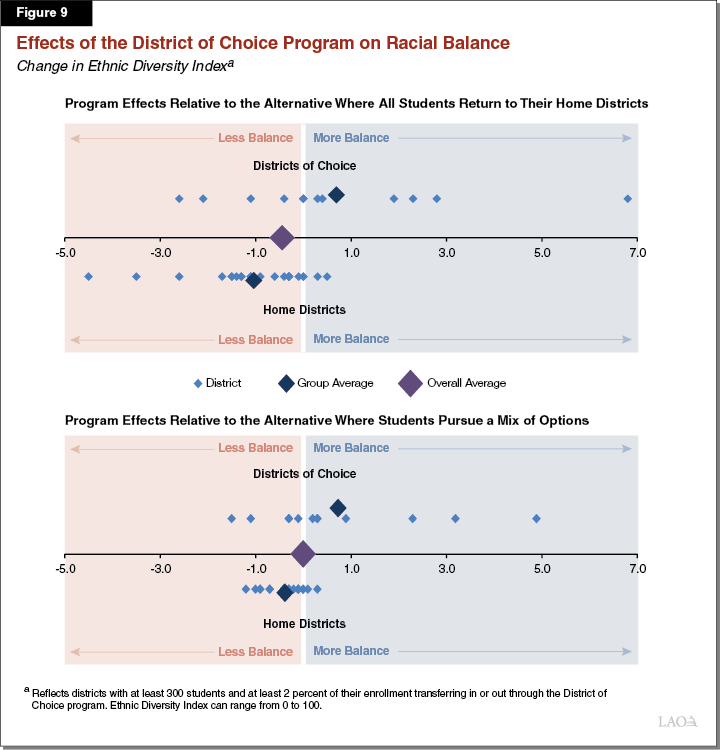
Under the More Likely Counterfactual Scenario, the Statewide Effect Is Neutral. Under the counterfactual where all students return to their home districts, the average change in the EDI across all Districts of Choice and home districts in Figure 9 is a decrease of 0.4. This decrease corresponds to a minor net decrease in racial balance overall. Under the more likely counterfactual, however, the average change across those districts is zero. (We also analyzed changes in the EDI based on larger or smaller subsets of affected districts. These analyses produced results similar to those discussed in this section.)
Participation by Income Level
Approximately One‑in‑Three Participating Students Is Low Income. The available data show that 32 percent of participating transfer students came from families with incomes low enough to qualify for the federal free or reduced‑price meals program. For the 2018‑19 school year, a family of four qualified for this program if its annual income did not exceed $46,435. As a point of comparison, 59 percent of all students statewide qualify for free or reduced‑price meals. (The program data technically include all students—regardless of income—who are homeless, migrant, or foster youth, or who come from families in which neither parent received a high school diploma. Virtually all of these students qualify for free or reduced‑price meals.)
Share of Low‑Income Students in the Program Rising Over Time. The share of low‑income students using the program has risen 5 percentage points since 2014‑15, when low‑income students accounted for 27 percent of program participants. The most notable development explaining this increase is that all five of the large Districts of Choice increased their share of low‑income students over the period. In addition, two smaller districts with very high shares of low‑income transfer students joined the program between 2014‑15 and 2018‑19.
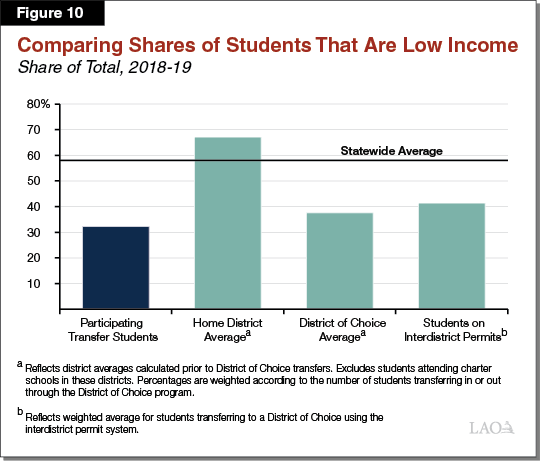
Low‑Income Students Have Relatively Low Participation. Figure 10 compares the share of low‑income students transferring through the program with the corresponding share among all students who attend a District of Choice or home district. Overall, the share of participating students who are low income is slightly lower than the average for Districts of Choice (38 percent) and much lower than the average for home districts (67 percent). Compared with their higher‑income peers, low‑income students are about half as likely to participate in the program. This difference, however, has shrunk somewhat over time. In 2014‑15, low‑income students transferred at only 40 percent of the rate of their higher‑income peers. As a further comparison, we examined the share of low‑income students transferring through the interdistrict permit system. We found that 41 percent of these students are low‑income, which is somewhat higher than the share for the District of Choice program but still low compared with the average home district. (For all of these comparisons, we weighted districts based on the number of students transferring in or out.)
Early Application Deadline Could Be an Issue for Low‑Income Students. We asked districts if any particular requirements of the program could be limiting participation for interested students. The most common responses revolved around the January 1 application deadline. Several districts described this deadline as hindering participation in two ways. First, it requires students and their parents to begin thinking about transferring for the upcoming school year in the fall of the previous school year. For a district that begins school in late August, the January 1 deadline comes nearly eight months before the start of the school year. Interviewees indicated some students have not yet begun considering their options by this point. Second, the January 1 deadline usually falls during the middle of winter break. Districts indicated that communicating with students and providing reminders about the deadline during the break is more difficult compared to when school is in session. Administrators from districts receiving relatively high numbers of applications from low‑income students were especially likely to describe the January 1 deadline as a barrier to participation, whereas districts receiving fewer applications from these students saw this deadline as less of an issue.
Other Student Characteristics
English Learners Participate at Relatively Low Rates. State law requires all districts to identify English learners using a home language survey and an assessment of their ability to read and write English. Students maintain their designation as English learners until they pass an examination demonstrating proficiency. Available data show that as of 2018‑19, 6 percent of the students using the District of Choice program were English learners. As Figure 11 shows, this share is notably lower than the average for home districts (20 percent) and somewhat lower than the average for Districts of Choice (12 percent). Although we are not certain of all the factors explaining these differences, some portion could be attributable to differences in student progress. Available data show that students attending Districts of Choice have above‑average scores on measures of progress toward English proficiency. To the extent transfer students experience similar gains, they would transition out of English learner status more quickly.
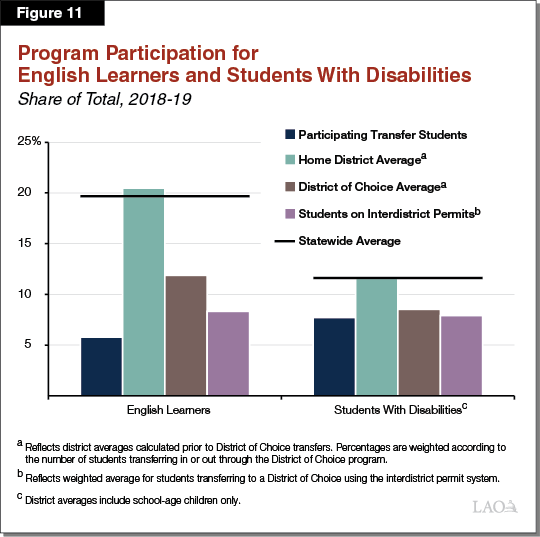
Students With Disabilities Participate at Relatively Low Rates. State and federal laws require all districts to identify students with disabilities that affect their ability to learn. The available data show that 8 percent of the students using the District of Choice program in 2018‑19 had a disability. This share compares to the district average of 9 percent for Districts of Choice and 12 percent for home districts. (These percentages exclude students with disabilities who are outside the traditional school age.) A small portion of this difference likely reflects the fact that approximately 1‑in‑20 students with disabilities receives instruction in a non‑district setting. The most common non‑district setting is a special day class operated by a COE. (Special day classes are designed for students with relatively severe disabilities and often employ specialized instructional techniques.) A few students with severe disabilities receive instruction in nonpublic schools or residential facilities. For students in non‑district settings, transferring from one district to another likely provides less benefit than other forms of choice (such as being able to choose their specific special day class). As Figure 11 shows, the share of students with disabilities transferring through the interdistrict permit system is similar to the share for the District of Choice program.
Equal Participation by Gender. The data show that show male and female students each accounted for 50 percent of the students using the program in 2018‑19. The variation among individual districts also is relatively small. When we examined individual districts with at least 50 transfer students, the share of female students ranged from 40 percent to 60 percent. These results are similar to our previous findings based on 2014‑15 data.
District Finances
In this section, we examine how the District of Choice Program affects district enrollment levels and rates of fiscal distress. We also analyze the reduction in funding for basic aid districts.
Effects on Enrollment
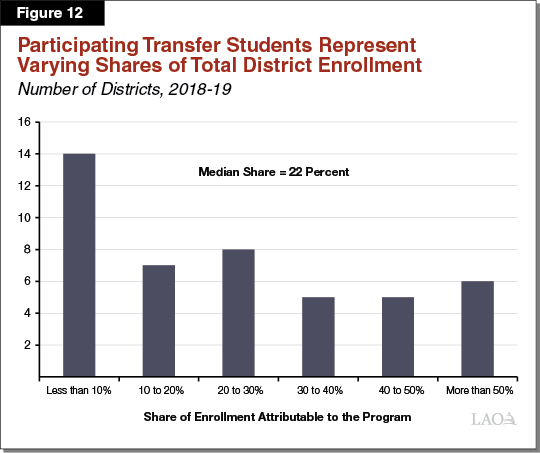
Some Districts of Choice Generate a Notable Share of Their Enrollment Through the Program. Changes in enrollment are an important fiscal issue for districts because the state allocates most funding based on student attendance. As Figure 12 shows, participating districts generate varying shares of their total enrollment through the program. For the median district, 22 percent of enrollment consists of transfer students. Very small districts (those with fewer than 300 students) are especially reliant on the program—the median share among these districts is 35 percent of enrollment. Many of these small districts indicated they joined the program to gain economies of scale and keep their enrollment from dropping to a level where they would not be fiscally viable. For larger districts (those with more than 300 students), the median share is 9 percent of enrollment. Many of these districts described declining enrollment as the key fiscal factor prompting them to join the program. Some districts also noted that neighboring districts had become less willing to approve interdistrict permits than they were in the past.
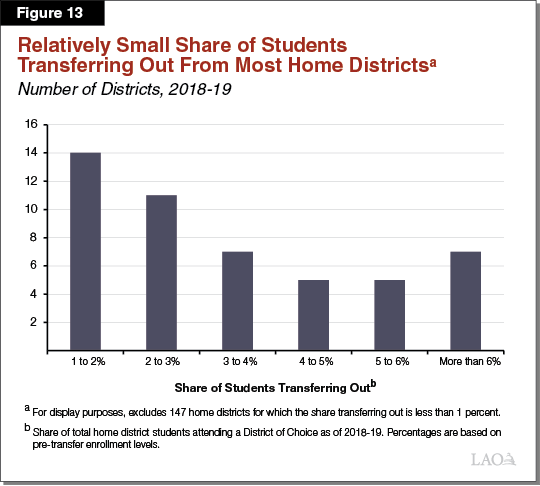
Most Home Districts Experience Relatively Small Changes in Their Enrollment. The 45 districts participating in the program receive transfer students from 196 different home districts. We found that 147 of these districts have less than 1 percent of their students attending a District of Choice. Among the other 49 districts, the share of students transferring out also tends to be small (Figure 13). We identified seven districts with more than 6 percent of their students transferring out. All of these districts had extremely low enrollments (averaging 82 students), such that a small number of students leaving accounted for a relatively large percentage of their enrollment. Although the share of students transferring out tends to be small, home districts typically cited the corresponding reduction in state funding as their chief concern about the program. These districts often reported long‑term declines in their enrollment levels and saw the District of Choice program as contributing to these declines. Districts noted that declining enrollment could require them to close schools, lay off staff, or take other difficult actions to balance their budgets. Many of these districts also are affected by the interdistrict permit system, as we discuss in the box below.
Districts Affected by District of Choice Program and Interdistrict Permits
Interdistrict Permits Can Amplify or Reduce Changes Attributable to the District of Choice Program. We analyzed interdistrict permit transfers for the 25 home districts with the highest share of students transferring out through the District of Choice program. We found that interdistrict permit transfers often have larger effects on enrollment than the District of Choice program. Specifically, nearly half of these districts had more students transferring out through interdistrict permits than the District of Choice program. As a group, these 25 districts reported about 4,500 students transferring out through the interdistrict permit process, compared with 3,400 students transferring out through the District of Choice program. We also found that most of these districts had at least some students transferring in through interdistrict permits, in some cases offsetting a significant portion of the decrease in their enrollment. Six of these districts had net increases across both programs, meaning the total number of students transferring in from other districts exceeded the number of students transferring out.
Rates of Fiscal Distress
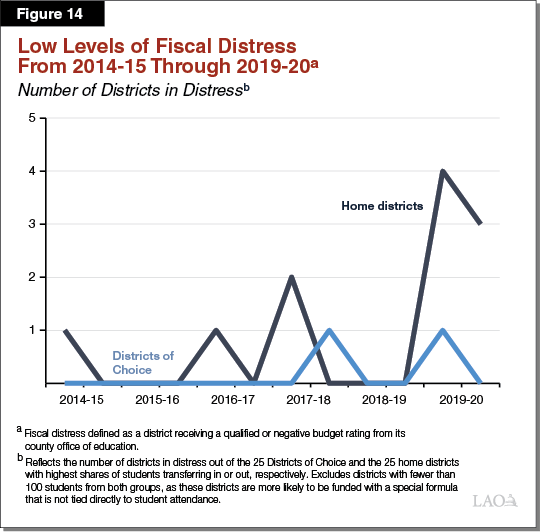
Low Rates of Fiscal Distress for Districts of Choice and Home Districts Over the Past Five Years. Figure 14 shows the number of districts in fiscal distress among the 25 Districts of Choice and 25 home districts with the highest percentage of students transferring in or out through the program. For this analysis, we identified a district as being in distress if it received a qualified or negative budget rating. (State law requires COEs to review district budgets at least twice per year and assign qualified ratings when districts are at risk of not meeting their financial obligations in the current or upcoming two years and negative ratings when districts face immediate budget problems.) Few districts in either group received qualified or negative ratings over the past five years, likely reflecting the significant increases in per‑pupil funding the state provided over the period. As Figure 14 shows, 4 of the 25 home districts reported distress in the first half of 2019‑20, the highest number over the period. In their local budget documents, these districts attributed their distress to multiple factors, including projections for slower funding growth in the future, rising pension costs, higher costs for special education, and declining enrollment.
Basic Aid Districts
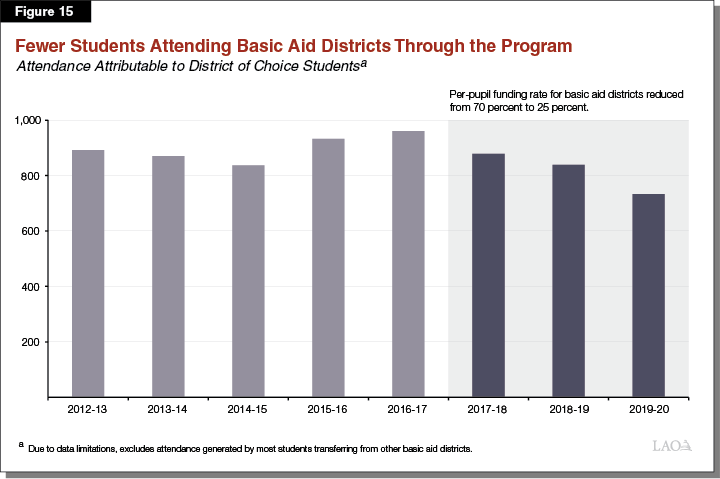
Fewer Students Transferring to Basic Aid Districts Since State Reduced Funding. Figure 15 shows the number of students attending basic aid school districts through the District of Choice program. (Due to data limitations, the numbers in Figure 15 exclude most students transferring from other basic aid districts.) Between 2016‑17 and 2019‑20, the number of transfer students attending basic aid districts decreased by 227 students (24 percent). This decline began in 2017‑18, corresponding to the year in which the state reduced funding. Several basic aid districts we interviewed indicated this reduction had caused them to become more cautious and reduce the number of students they were willing to accept through the program. As an example, one district noted that if it needed to hire another teacher, the cost would exceed the funding generated by its transfer students. In addition, six of the nine districts that were enrolling transfer students in 2014‑15 but subsequently left the program were basic aid districts.
Academic Outcomes
Below, we describe how the program can benefit participating transfer students. After that, we review some of the changes home districts have made to retain and attract students.
Transfer Students
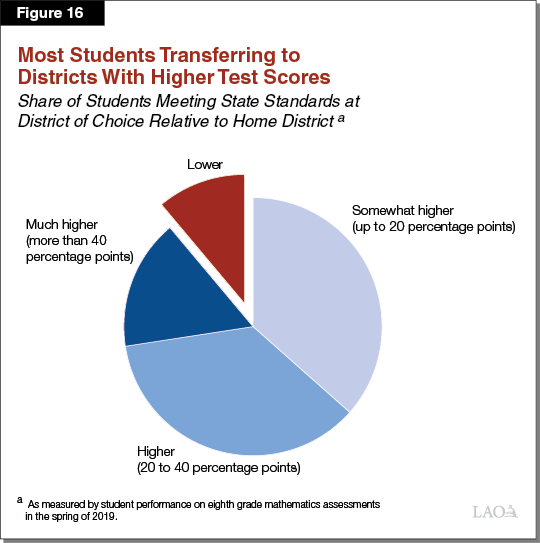
Nearly All Students Transfer to Districts With Higher Test Scores. The state’s assessment system tests students for proficiency in mathematics and English Language Arts in grades 3 through 8 and 10. To compare test scores across districts, we analyzed the share of students meeting or exceeding state performance standards in 8th grade mathematics. (Focusing on 8th grade allows us to include elementary districts.) In 2018‑19, 37 percent of all students in the state met this standard. The average among Districts of Choice was well above the state average (55 percent), whereas the average among home districts was slightly below average (33 percent). (In calculating these percentages, we weighted each district to account for the number of students transferring in or out.) As Figure 16 shows, nearly all students (89 percent) transfer to districts with higher test scores than their home districts. We found similar results when we analyzed transfer patterns using scores in other grades and scores for English Language Arts.
Nearly All Students Transfer to Districts With Higher College‑Going Rates. Many participating districts believed one factor attracting students was the high proportion of their graduates who attend college. For our analysis, we analyzed transfer patterns using the college‑going rate for each district. The state defines this rate as the percentage of students enrolling in a public or private postsecondary institution (including a community college) the year after completing high school. For 2017‑18 (the latest year available), the average college‑going rate across all districts was 64 percent. The average among Districts of Choice was well above average (79 percent), whereas the average among home districts was slightly above average (67 percent). We also found that nearly all students (95 percent) transfer to districts with higher college‑going rates than their home districts.
Program Provides Participating Students With Additional Educational Options… During our interviews, we asked participating districts to describe the academic programs they believed were attracting students. Districts frequently mentioned college preparatory courses (including courses affiliated with the Advanced Placement and International Baccalaureate programs), foreign languages, and arts and music as the options most frequently sought out by their transfer students. In a few cases, districts described students transferring to attend schools with a specific theme or instructional model. For example, one district indicated it operated the only high school in the area with a “community schools” model. (This model focuses on linking schools with other local resources to improve student achievement and family engagement.) Another district indicated it received transfer applications from students seeking to attend an arts and media academy that emphasized hands‑on training and career preparation for students interested in those fields.
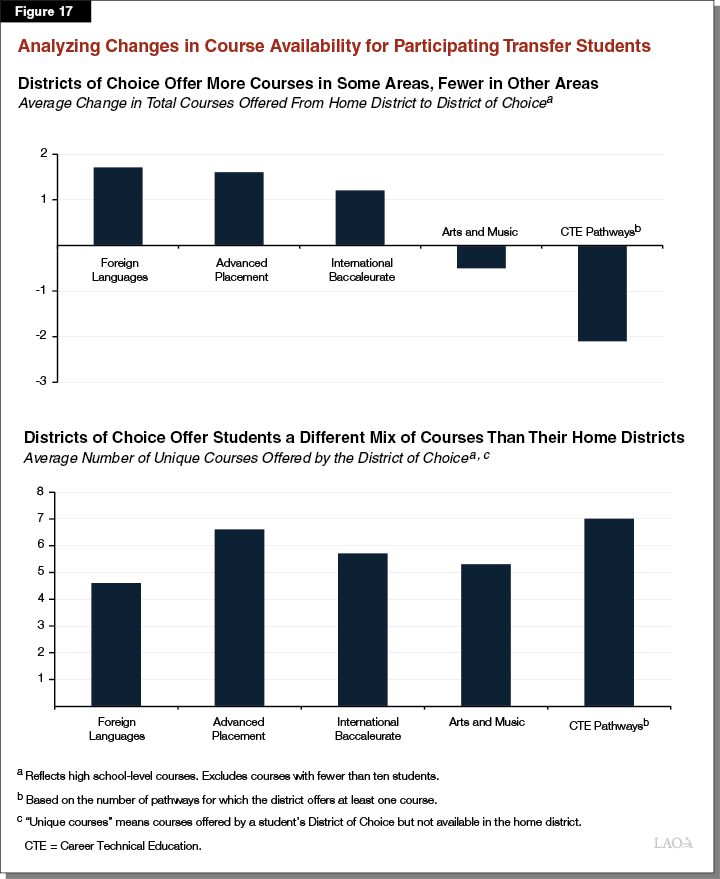
…Including a Different Variety of Courses Compared With Home Districts. After our interviews, we analyzed data on the courses available to students who transfer through the District of Choice program. We focused on the types of courses districts mentioned most—Advanced Placement, International Baccalaureate, foreign languages, and arts and music. We also analyzed the availability of Career Technical Education (CTE) pathways. (A CTE pathway is a broad grouping of courses organized around 1 of 15 industry sectors.) First, we compared the total number of courses offered in each student’s District of Choice with the number of courses offered in the home district. As the top portion of Figure 17 shows, the average student transferred to a district with a few more Advanced Placement, International Baccalaureate, and foreign language courses and slightly fewer arts and music courses and CTE pathways. Next, we examined the specific subjects taught within each area. For this analysis, we tallied the number of unique courses taught in each student’s District of Choice but not taught in the home district. For example, two districts might offer the same number of foreign language courses, but one district might teach Mandarin while the other teaches German. As the bottom portion of Figure 17 shows, in each area the average student gained access to five to seven courses not offered in the home district. We also found that the reverse is true—a home district generally offers some courses not available in the District of Choice.
Surveys in Other States Find Participating Families Are Highly Satisfied. Although we did not have the ability to survey families participating in the District of Choice program, we did review surveys conducted in three other states with similar interdistrict transfer options. These surveys all found that more than 90 percent of families using the program were satisfied or very satisfied with their new schools. In addition, fewer than 10 percent of families were thinking about changing schools again or returning to their home districts. A survey conducted in Minnesota asked parents to elaborate on the behavioral changes they observed in their children during the first year in their new schools. Parents most frequently described improvements in self‑confidence, satisfaction with learning, and motivation, with about 60 percent of parents saying their children were doing better in these areas after transferring and less than 3 percent saying their children were doing worse. Administrators for the Districts of Choice we interviewed consistently reported similar results, characterizing their transfer students as happy with their new schools and generally doing at least as well academically as resident students. Most administrators of these programs also cited high retention rates, with relatively few students returning to their home districts.
Home Districts
Home Districts Taking Action to Attract and Retain Students. Although home districts expressed reservations about the program, several responded to it by taking steps to attract and retain students. As we described in our previous evaluation, some districts convened community meetings to ask families about their concerns and the potential changes that could increase their satisfaction and attract students back. In other cases, they identified the districts their students were leaving to attend and studied programs that were popular in those districts. In some instances, districts discovered concerns related to their academic programs, such as a desire for more college preparatory courses or greater focus on science and math. In other cases, districts realized their communities wanted other changes, such as more opportunities to transfer to other schools within the district. Districts made the implementation of changes to address these concerns a priority. Although the success of these efforts is difficult to measure, we found that some home districts have experienced significant drops in the number of students transferring out. For this analysis, we focused on the 26 home districts with the greatest number of students transferring out in 2014‑15. By 2018‑19, nine of these districts had seen the number of students transferring out decrease by at least 20 percent. (We excluded districts in which the reduction was attributable to one of the statutory transfer limits.)
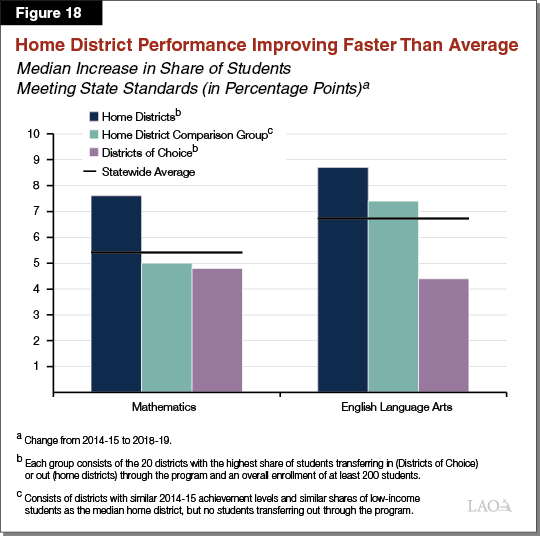
Home Districts Improving Test Scores Over Time. Between 2014‑15 and 2018‑19, the share of students meeting state standards in math increased by 5.4 percent on a statewide basis (Figure 18). Home districts improved their performance at a faster pace, with the share of their students meeting standards increasing by 7.6 percent over the same period. (For this analysis, we focused on the 20 home districts with the highest shares of students transferring out and at least 200 total students. Districts with fewer students often experience more notable fluctuations in their annual test results.) Although we are uncertain about the effect of the District of Choice program on these gains, the improvement among home districts exceeded the improvement among a comparison group consisting of districts with similar 2014‑15 achievement levels and similar shares of low‑income students as the typical home district, but no students transferring out through the program. Districts of Choice also improved, but at a somewhat slower rate than home districts (potentially because their achievement levels in 2014‑15 already were relatively high). Improvements in test scores for English Language Arts followed a similar pattern. We also found that the gains for both home districts and Districts of Choice were relatively consistent across student subgroups.
Program Oversight
In this section, we begin by analyzing the local audits of the District of Choice program. Next, we describe the reasons districts deny transfer applications and assess the provision of school transportation. Finally, we examine a few data collection issues.
Audit Results
Auditors Found No Major Issues, but Flagged Three Districts for Missing Paperwork. Local auditors flagged three small districts for issues related to the District of Choice program during the 2018‑19 audit cycle. Specifically, two districts received audit findings because they had not registered for the program in a timely manner. One of these districts indicated it had been unaware of the new requirement to register with the state. The other district cited technical difficulties, indicating it had attempted to complete the online registration form and had been unaware CDE did not receive its information. The third district received an audit finding because it did not adopt a board resolution establishing its local transfer limit. CDE resolved all three findings with the districts agreeing to implement new procedures to ensure compliance moving forward. When we examined these districts in 2020‑21, we found all three had submitted timely registrations and adopted the necessary board resolutions. As a point of comparison, auditors identified 825 instances of noncompliance across all of the school districts and program areas subject to audit in 2018‑19. Even accounting for the relatively small number of districts participating in the District of Choice program, the total number of audit findings issued for the program was relatively low.
No Complaints Lodged With CDE. In addition to the audit process, we examined the new complaint procedure. CDE indicated it received no complaints about districts failing to register or refusing to submit data. Department staff noted that most of the inquiries they received were for general information about the program, including questions from superintendents exploring whether the program would be a good fit for their districts and questions from auditors seeking information about the new requirements.
Transfer Applications
Districts of Choice Report Accepting Nearly All Transfer Applications. Based on the available district data, we estimate that 1,853 students applied to attend a District of Choice during the 2018‑19 application cycle. We estimate districts approved 1,650 of these applications, for an overall acceptance rate of 89 percent. (These totals exclude approximately 600 applications withdrawn by the students who submitted them.) Disaggregating the data by district, we found that 25 districts approved all applications they received, 14 districts denied some applications, and 6 districts received no applications.
Most Denials by Districts of Choice Related to Local Transfer Limits. Of the 14 districts denying transfers, 10 indicated they had reached their locally determined transfer limit. These districts ranged in size, but most of them were basic aid school districts. The other four districts denying transfers cited other factors. Two districts issued denials because one of their home districts had invoked the cumulative cap on transfers. (These districts explained that although their application materials indicated that students from those home districts were ineligible to apply, they had still received a few applications from students residing in those districts.) Another district attributed its denials to applications it received after the deadline. (We understand that most districts stop processing applications after the deadline instead of reporting them as denied.) Only one very small district indicated it had denied any transfers because students were requesting a program the district did not offer, and no districts denied transfers using the rule about displacement of existing students.
Denials by Home Districts Generally Related to the Cumulative Cap. In addition to examining the reasons Districts of Choice deny transfers, we examined denials by home districts. Although the state does not collect systematic data, we identified four home districts that have invoked the 10 percent cumulative cap. Students who transferred before the cap applied are not affected, but additional transfers from those districts are no longer allowed. We are uncertain how many transfers would have occurred without the cap, but historical trends suggest the number could be significant. Whereas 2,500 students from these four districts were attending a District of Choice in 2014‑15, only 1,900 students were doing so as of 2018‑19. The decline among students transferring from these districts appears to be a key reason for the overall drop in program participation over the period. We also found that home districts rarely invoke any of the other statutory reasons for limiting transfers.
School Transportation
Relatively Few Districts of Choice Provide School Transportation. Available data show that 11 of the 45 Districts of Choice provided transportation for their transfer students. All of these districts are small and rural, with an average enrollment of about 300 students each. Together, they provided transportation for 290 (3 percent) of all students participating in the program in 2018‑19. Although very few transfer students receive transportation, the average for other students also is low. According to a federal survey conducted in 2017, only 9 percent of students in the state receive district‑provided transportation. The share is even lower in urban areas, where the larger Districts of Choice are located. Consistent with these findings, most districts we interviewed indicated they did not provide transportation for resident or transfer students.
Disadvantaged Students Somewhat More Likely to Receive Transportation. One reason the Legislature required districts to report transportation data was to determine whether districts were providing this service on an equitable basis. Overall, we found that seven districts provide transportation for some of their transfer students and four districts provide transportation for all transfer students. Focusing on the districts providing transportation only to some transfer students, we found that low‑income students and English learners were somewhat more likely to receive transportation than other students (Figure 19). When we analyzed the data by race, we found only minor differences. Transfer students receiving transportation were 59 percent white and 33 percent Latino, whereas students not receiving transportation were 55 percent white and 36 percent Latino. Finally, we examined whether districts were more likely to transport students from particular home districts. We found that only two of the seven districts had a significant number of transfer students from multiple home districts. In both districts, rates of transportation were similar for students from each of the home districts.
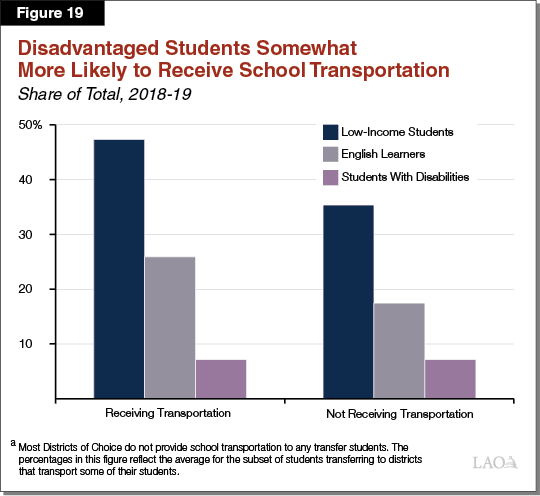
Data Reporting
Some Smaller Districts Interpreted State Reporting Instructions Differently. To obtain information on the socioeconomic and demographic characteristics of transfer students, CDE asked districts to flag those students in CalPADS. Most districts flagged all transfer students enrolled as of 2018‑19, regardless of the year in which those students first transferred. Several districts flagged only a subset of these students—generally those who transferred for the first time in 2018‑19. Regarding transfer approvals and denials, most districts provided information for the 2018‑19 application cycle. Several districts, however, provided information on applications and denials over several years. Although these differences introduce some potential error in our analysis, the districts reporting data differently account for a relatively small share of students using the program. In addition, we adjusted district data to provide for consistent comparisons in this report wherever possible.
State and Local Data Reporting Requirements Overlap. We found that the program information collected and published by CDE largely covers the same topics that districts are required to include in their local reports. In both cases, districts are providing information about the number and characteristics of students who transfer through the program. We also found that the format and content of these local reports can vary widely. For example, some districts provide extensive detail in their local reports, whereas others provide highly summarized information. Due to these differences, the local reports are much less useful for making comparisons among districts than the data collected and published by CDE.
Assessment
In this section of the report, we review the main strengths of the program. We then highlight a few policies limiting access for students and discuss differences in participation by student subgroups.
Strengths of the Program
Provides Students With Additional Educational Options. Students can benefit from the District of Choice program in several ways, including being able to take classes not offered in their home districts and attend programs that align with their personal interests and educational goals. Overall student satisfaction with the program seems high, with districts describing their transfer students as doing well academically. Although the program is relatively small, it offers students a few advantages compared with the interdistrict permit system. Most notably, it allows students to transfer even if their home districts would not approve a permit and ensures students can remain in the program until graduation. Finally, the program seems to have relatively broad appeal, attracting students from a range of racial backgrounds, income levels, and geographic regions of the state.
Encourages Home Districts to Improve Their Programs. Despite their reservations about the program, some home districts took steps to address the reasons students were leaving their districts. These steps included learning more about the priorities of their communities and adjusting their instructional options accordingly. Our finding that about one‑third of home districts saw significant reductions in the number of students transferring out over the past several years (excluding districts with drops related to the cumulative cap) suggests that students can respond positively to these efforts. In addition, we found that students who remain in their home districts continue to make gains, with home districts improving their test scores faster than most other districts.
Program Has Met or Is Making Progress Toward the Legislature’s Goals. The Legislature made several notable changes as part of the 2017 reauthorization of the program. Our understanding is that these changes broadly were intended to (1) add transparency, by making program data readily available; (2) enhance accountability, by creating a mechanism to monitor compliance with core program requirements; and (3) increase access, by promoting the participation of students who transfer at lower rates. Our findings suggest the program has met the first two objectives and is making progress toward the third, as we discuss below:
Policies Limiting Access
Cumulative Cap. The data show that nearly 1,900 (20 percent) of the students using the program in 2018‑19 came from districts that have reached the 10 percent cumulative cap. These students are 40 percent Latino, 40 percent Asian, and 13 percent white—roughly resembling other students using the program. As these students graduate and are not replaced by future cohorts, overall participation in the program is likely to decrease. This decrease could accelerate over the coming years if additional districts reach the cap. We are concerned that the cumulative cap has no connection to student interest or the quality of local transfer options available. Once reached, the cap disallows all future participation, including transfers by students whose participation the Legislature has tried to encourage. In addition, the original justification for the cumulative cap has weakened over time. Our understanding is that the Legislature included the cumulative cap in the first version of the program to prevent home districts from experiencing sizeable drops in enrollment over several consecutive years (and losing the associated per‑student funding). The cumulative number of transfers since 1993, however, is not a good indicator of a district’s current fiscal condition. In addition, the Legislature added a separate provision in 2009 allowing districts to limit transfers that would worsen their fiscal distress.
Early Application Deadline. The January 1 deadline limits the program to students who plan to transfer well in advance of the school year. Some districts believed low‑income students were particularly affected by this deadline because they had lower levels of awareness about the program. Given that many English learners also are low‑income students, we think the January 1 deadline might also contribute to lower participation for these students. We are aware of no other educational program in which the law requires students to apply as early as January 1. As a point of comparison, we understand that most charter schools set their application deadlines during late winter or spring.
Funding Reduction for Basic Aid Districts. Our findings indicate that the lower funding rate for basic aid districts has reduced the number of students these districts are willing to accept through the program. Although basic aid districts account for only about 10 percent of students in the program, their participation is notable for at least two reasons. First, students transferring to basic aid districts are somewhat more likely to be disadvantaged than other students. For example, 11 percent of students transferring to basic aid districts are English learners, compared with 5 percent of students transferring to other districts. Students transferring to basic aid districts also are slightly more likely to be low‑income or have a disability. Second, nearly all of the basic aid districts participating in the program are located in rural areas, where fewer educational options are readily available. To the extent these districts leave the program or adopt lower transfer limits, access for these students would diminish.
Program Participation Levels
Available Data Does Not Reveal Why Usage of the Program Varies Among Student Groups… The information collected by the state provides a detailed picture of who uses the program, but it does not indicate why students from different subgroups are more or less likely to use the program. Many explanations are possible. For example, these differences could reflect varying levels of awareness about the program. Even though the Legislature added some new communication requirements in 2017, the effects of these changes might not be evident for several years. Alternatively, students might differ in their satisfaction with their home districts. Many home districts offer unique courses or academic options, and some students might prefer those options. Our evaluation, however, found similar subgroup differences within the interdistrict permit system. Specifically, white students and Asian students use interdistrict permits relatively frequently, whereas Latino students use them less frequently. Low‑income students, English learners, and students with disabilities also use interdistrict permits less frequently. These findings suggest that the underlying causes of these participation differences probably are not unique to the District of Choice program.
…But Districts Typically Can Accommodate All Interested Students. A key finding from our evaluation is that most districts participating in the program are able to accept all students interested in transferring. In other words, high usage of the program by some students generally does not translate into fewer transfer opportunities for other interested students. In cases where a district receives more transfer applications than it can accept, the program provides priority for low‑income students. (The cumulative cap is a notable exception—because the cap establishes a maximum number of transfers over the life of the program, high usage by some students can result in fewer transfer opportunities for other students.)
Recommendations
Below, we provide our recommendations regarding the extension of the program. We also make several recommendations intended to promote access to the program.
Reauthorize the Program. We recommend the Legislature reauthorize the program, potentially on a permanent basis. Among other considerations, the program provides quality educational options for a range of students, the new oversight mechanisms uncovered no notable concerns, and the share of disadvantaged students using the program has risen. Ending the program, by contrast, would be disruptive for students who currently use the program and would deny future transfer students the opportunities that have benefited previous users of the program. Regarding the length of reauthorization, the program currently is operating on its sixth temporary extension since 1993. A permanent reauthorization would provide greater predictability for participating students and districts. Ongoing oversight could still take place—the state could continue collecting program data, and the Legislature could have future oversight hearings to ensure the program continues to meet its goals. Alternatively, if the Legislature were to adopt another temporary extension, we would recommend a minimum of five years. We think a shorter extension would not provide the Legislature with enough new data before it would be required to revisit the program. (Related to this recommendation, we think the coronavirus disease 2019 pandemic and associated school closures could have anomalous effects on student participation in 2020‑21 and 2021‑22. The data for these years might not be particularly helpful for assessing program trends.)
Repeal Cumulative Cap. Related to our recommendation to reauthorize the program, we recommend repealing the cumulative cap. Repealing the cap would allow students to use the program regardless of the previous transfer activity in their districts. Leaving the cap in place, by contrast, seems likely to reduce program participation over the next several years. Even without the cap, districts could limit transfers that exceed 3 percent of their annual enrollment or notably worsen fiscal distress. If the Legislature remained concerned about the immediate effect on home districts, it could phase out the cap gradually.
Allow Later Application Deadline. We think a later application deadline would make the program more accessible to students. Although the Legislature could consider many possible dates, one option would be moving the deadline from January 1 to March 1. This change would provide students with an additional two months to learn about and consider their transfer options. To facilitate this change, the Legislature could repeal the requirement for districts to provide students with a preliminary notice of their acceptance or denial by February 15. The state could maintain the May 1 deadline for Districts of Choice to develop their final list of accepted students. (Although a later deadline would provide less advance notice for home districts, the state could still structure the program to provide home districts with a list of transfer students in the spring, well in advance of the school year. In addition, the policy of funding all districts according to the higher of their current‑ or prior‑year attendance tends to mitigate the effects of unexpected changes in the number of students transferring out each year.)
Increase Funding for Basic Aid Districts and Adjust the Rate for Disadvantaged Students. We recommend setting a higher funding rate for basic aid districts and modifying this rate to mirror the Local Control Funding Formula. Specifically, we recommend setting the rate at 60 percent of the formula’s base amount, increasing to 80 percent for low‑income students and English learners. This approach would mirror the 20 percent differential for students attending other districts. More importantly, it would reward districts for attracting and retaining these students. On average, the new rate would generate similar amounts of funding as the 70 percent rate for all students that existed prior to 2017. (We estimate that low‑income students and English learners account for about half of all students transferring to basic aid districts.) From a state fiscal perspective, this increase likely would involve short‑term costs and long‑term savings. The short‑term costs—likely around $2.5 million per year for the next few years—would result from the state providing a higher rate for students who have already transferred and currently generate funding at the 25 percent rate. Long‑term savings, by contrast, would emerge to the extent basic aid districts accept new students who otherwise would attend their home districts and generate the regular rate. For example, if the higher rate caused these districts to accept an additional 500 students, the long‑term state savings would be around $1.5 million per year.
Continue Collecting Data, Consider Funding Survey to Learn More About Transfer Decisions. We recommend the state continue collecting data on the number and characteristics of students who transfer through the program. Ongoing data collection would help the Legislature assess the effects of the 2017 changes as well as our recommendations. We think CDE can address the differences in how districts reported their data without additional legislation, but we recommend asking the department for an update on these efforts during the next hearing on the program. The current data collection, however, does not help the Legislature better understand why some groups of students transfer at higher rates than others, including the differences by race. If the Legislature were interested in understanding how families make these decisions, it could consider funding a survey. This survey could ask families about their (1) awareness of transfer options, (2) motivations for transferring or not transferring, and (3) overall satisfaction with their districts. We think this survey would be more valuable if it focused on a range of choice options instead of the District of Choice program by itself. For this type of research, the state typically tasks CDE with overseeing a contract and soliciting bids from qualified organizations. The findings from this survey could inform future efforts to promote participation by students who use the program less frequently.
Repeal Redundant Reporting Requirements. We recommend repealing the requirement for districts to prepare their own annual report on the program. These reports have significant overlap with the information published by CDE, which is a more reliable source of data for the program. We also recommend repealing the requirement for participating districts to notify adjacent districts of their intent to remain in the program every year. Under the registration requirements the state added in 2017, CDE maintains and publishes a list of participating districts. The law also requires participating districts to register with their county boards of education, which can disseminate this information to nearby districts that might be affected. Eliminating these requirements could allow districts to spend more time on outreach and other activities promoting access to the program.
Conclusion
The Legislature created the District of Choice program in the early 1990s during a period of experimentation with new forms of educational choice. Our first evaluation of the program, published in 2016, found evidence the program was providing quality options for students but noted that limited data and vague oversight made the program hard to assess. A year later, the Legislature made a number of changes to address these and other concerns. The state finally obtained comprehensive data in 2018‑19, which provided evidence the program is making progress toward the Legislature’s more recent goals. In this report, we recommend reauthorizing the program and making changes to address some of the factors limiting participation. We think our recommendations would build upon existing progress and promote access for all students.
