LAO Contact

February 2, 2021
Estimating the CalWORKs Take-Up Rate
This is the first in a series of several posts estimating the percentage of California Work Opportunity and Responsibility to Kids (CalWORKs)-eligible individuals who actually enroll in the program—otherwise known as the CalWORKs take-up rate. In this post, we introduce our methodology for estimating the number of families eligible for CalWORKs since 2005 and compare this to the number who actually enrolled. In future posts, we will plan to discuss how this take-up rate varies between different regions in the state, as well as possible reasons why it varies regionally and has changed over time.
Background
CalWORKs Provides Cash Assistance and Employment Services to Low-Income Families. To qualify for CalWORKs, families must include one or more children who are either citizens or lawful permanent residents and generally must fall below certain income requirements specified in state law (roughly equal to about 80 percent of the federal poverty level [FPL] for most families, although this varies somewhat by family size and region of the state). In 2019‑20, a family of three could earn up to $1,453 per month and still qualify for CalWORKs assistance. That year, about 385,000 families (containing about 950,000 individuals) received CalWORKs assistance. The bullets below summarize other benefit and program participation rules.
Cash Assistance. Since 2011, adults generally have been limited to no more than 48 cumulative months of receiving cash assistance, although this limit is set to return to its original 60 months in May 2022. Even after adults have timed out, families can continue to receive cash assistance on behalf of any eligible children. In 2019‑20, the average monthly grant for CalWORKs families was $585.
Employment Services. Once enrolled, adult recipients generally are required either to work or engage in approved work-related activities such as searching for a job, although some adult recipients are exempt from these requirements (for example, some pregnant women). In 2019‑20, about 150,000 participating families (40 percent of the total) received employment services such as career assessments, adult education, and help with their job search.
Child Care. Families that participate in CalWORKs are eligible for subsidized child care until their children turn 12. In 2019‑20, a little over 150,000 children received CalWORKs child care.
Most CalWORKs Recipients Are Children. In 2018, there were about 1.5 million California children living below the FPL, and about half of these children were enrolled in CalWORKs. In fact, most CalWORKs recipients (a little over 80 percent) are children, and most CalWORKs families (about 55 percent) include no adult recipients (meaning parents are excluded from aid due to their immigration status, lifetime benefit limits, or for other reasons).
CalWORKs Benefits Generally Decrease as Family Income Increases. CalWORKs grants vary based on region, family size, and family income. Families living in high-cost coastal counties such as Los Angeles and San Francisco receive grants that are about 5.5 percent larger than similar families living in inland counties such as Fresno and Shasta. Grant sizes increase as family size increases, and grant sizes decrease as family income increases. Families may earn non-CalWORKs income of up to $500 a month without affecting their grant, but for each additional dollar they earn above $500 their grant is reduced by 50 cents. In 2019‑20. the maximum family grant for a family of three was $785.
Each Year, Income Eligibility for CalWORKs Automatically Increases. Under current state law, the income eligibility threshold for CalWORKs (also known as the Minimum Basic Standards for Adequate Care, or MBSAC) increases each year in proportion to the California Necessities Index (a measure of price inflation for basic goods such as food and clothing). Between 2005 and 2019, MBSAC for a family of three increased by over 50 percent (from $953 to $1,453), or from about 60 percent to about 80 percent of the FPL. Effectively, the increase in the income eligibility threshold over the years means the CalWORKs eligible population has also grown over time.
Grant Amounts Do Not Automatically Increase. Unlike MBSAC levels, grant amounts do not automatically increase in proportion to the cost of living but rather generally must be adjusted by new legislation. As a result, the purchasing power of the grants—that is, how much families can buy—decreases over time absent legislative action. Moreover, as part of the budget solutions adopted during the Great Recession, CalWORKs grant levels were reduced by first 4 percent and then 8 percent in 2011 and remained below their pre-recession peak until 2019.
Not All Eligible Families Enroll in CalWORKs. CalWORKs is an entitlement program, meaning all families that qualify for the program can receive assistance. Those who qualify, however, are not automatically enrolled. Rather, families must go through the process of learning about the program, applying, and being approved. The state does not track how many families are eligible for CalWORKs but not enrolled.
Understanding CalWORKs Take-Up Rate May Inform Future Policy Choices. As noted above, most CalWORKs recipients are children, but many children living below the FPL are not currently enrolled in the program. Consequently, increasing the CalWORKs take-up rate—and ultimately gaining a better understanding of why eligible individuals do not apply—could be used to inform policy choices that result in increased participation in the program and reduced poverty for families with children.
Understanding CalWORKs Take-Up Rate May Improve Caseload Forecasting. Since the onset of the novel coronavirus disease 2019 (COVID-19), CalWORKs caseload has proven especially difficult to forecast. As discussed in our recent Outlook post, both the administration and our office overestimated the extent to which caseload would grow following the pandemic and subsequent economic recession. These overestimates were built on observations from previous recessions (for example, the relationship between the unemployment rate and CalWORKs cases added), but such relationships do not always hold in new economic climates. Better information about the factors that influence families’ enrollment in CalWORKs likely could result in models that more accurately predict program caseloads.
Improving CalWORKs Take-Up Rate Could Mitigate Ongoing Economic Consequences of COVID-19. As we discuss below, the total number of CalWORKs-eligible families remained elevated for years following each previous recession. Should this pattern continue, tens of thousands of California families may remain impoverished for years due in large part to the COVID-19 recession. Increasing the CalWORKs take-up rate would allow the state to provide important aid to these families in the years ahead.
State Has Made Efforts to Improve Take-Up Rates in Similar Programs. Compared to other states, California historically signed up a relatively small share of families eligible for the Supplemental Nutrition Assistance Program (a federal program that helps low-income individuals purchase groceries, known locally as CalFresh). Starting in 2009, the state enacted a series of policy changes (rebranding the program, eliminating asset requirements, promoting online and telephone applications, and reducing the amount of paperwork necessary to remain enrolled in the program) which increased the measured participation rate from 51 percent to 71 percent between 2010 and 2018. More recently, the state allocated $2 million in 2016‑17 and 2017‑18 to improve awareness and take-up of the California Earned Income Tax Credit (EITC), which provides money to low-income workers.
To Date, No Formal Effort to Estimate CalWORKs Take-Up Rate. Unlike CalFresh, the federal government does not require the state to formally estimate the CalWORKs take-up rate. Consequently, such estimates are not readily available. (Although we are aware of related efforts by the Urban Institute and Center on Budget and Policy Priorities, neither of these efforts are directly comparable to the annually reported CalFresh take-up rate.) The rest of this post outlines how our office developed county-by-county estimates for CalWORKs take-up rates.
Methodology
Take-Up Rate is Equal to the Number of Families Enrolled Divided by Our Estimate of Families Eligible. Publicly available data give a clear count of the number of families enrolled in CalWORKs. We do not know, but can estimate, the number of families who are eligible but do not enroll.
For Families With Children, CalWORKs Eligibility Primarily Determined by Income and Immigration Status. To be eligible for CalWORKs, families must include at least one child and generally must earn less than 80 percent of the FPL (the exact income eligibility threshold varies by family size and from year to year and is set by state law). Children must also be either citizens or lawful permanent residents. Adults in the family can receive assistance if they (1) are lawful U.S. residents, (2) do not receive Supplemental Security Income, and (3) have not exceeded state and federal lifetime aid limits. Families also generally are deemed ineligible if they own more than $10,000 in property (other than their primary residence), have $10,000 in their bank accounts, or if they own more than $25,000 in automobiles (in practice, few families are denied aid because of these asset limits).
American Community Survey (ACS) Includes Most of the Information Needed to Estimate Eligibility. The ACS is an annual survey of more than 2 million households that is conducted by the federal Census Bureau. It measures numerous household and individual characteristics and includes most of the information necessary to estimate CalWORKs eligibility statewide. Data from the ACS currently are available for every year between 2005 and 2019.
Estimating Eligibility Requires Making a Few Simplifying Assumptions. The ACS contains most, but not all, of the information necessary to estimate CalWORKs eligibility. Consequently, we must make several simplifying assumptions to estimate the number of CalWORKs-eligible families. The nearby box lists these assumptions, as well as their likely impact on our estimates. In talking with program experts, our best guess is that the errors introduced by these assumptions roughly cancel each other out, such that a more detailed estimate (one which corrected for all of these simplifying assumptions) would be roughly equal our estimates.
Simplifying Assumptions and Their Impact on LAO’s Estimate of CalWORKs Take-up Rates
Below, we describe our simplifying assumptions. We make these assumptions to compensate for information not included in the American Community Survey (ACS). If we could correct for any of the following assumptions, we expect our estimated take-up rate would increase or decrease by less than 1 percentage point.
-
Monthly Income. We assume monthly income is equal to annual income divided by 12. The ACS reports only annual income, whereas California Work Opportunity and Responsibility to Kids (CalWORKs) eligibility is determined based on monthly income. This distinction is not important for those with regular hours throughout the year. However, CalWORKs-eligible families are disproportionately likely to have irregular hours or seasonal employment, which could result in some months with income far below and far above the families’ annual average. Correcting this assumption likely would cause our estimate of the take-up rate to decrease.
-
Eligibility Threshold. We assume income eligibility thresholds are equal to those in effect on July 1 of each calendar year. The ACS reports data for the calendar year, but income eligibility thresholds typically correspond to fiscal years (which start on July 1). In a typical year (in which income eligibility thresholds are increased on July 1), the eligibility threshold is lower from January through June than from July through December. We, however, have assumed the higher eligibility threshold throughout each year. Correcting this assumption would likely cause our estimate of the take-up rate to increase.
-
Immigration Status. The ACS does not provide sufficient data on respondents’ immigration status to determine whether they are eligible for CalWORKs. Consequently, we randomly assign each noncitizen a 45 percent probability of being deemed ineligible for CalWORKs. (This assignment roughly is based on U.S. Department of Homeland Security estimates of the proportion of noncitizen Californians who have a legal versus nonlegal residency status, the crucial distinction for CalWORKs eligibility.) Changing this assumption would have unknown effects on our estimate of the take-up rate.
-
Unemployment Insurance (UI) Benefits. The ACS does not separately track UI benefits (which, as with wages, count as income when determining CalWORKs eligibility). To estimate UI benefits for individuals who appear eligible for such benefits (those marked as “unemployed” in the ACS but who report having worked in the past 12 months and receiving “other income,” which may include UI), we estimated that these benefits do not exceed the average UI benefits for a calendar year in California (which we define as the average weekly benefit in California times the average weeks receiving UI nationwide for each calendar year). Correcting this assumption would have unknown effects on our estimate of the take-up rate.
-
Pregnancy. We assume no Pregnant Women-Only (PWO) CalWORKs cases. CalWORKs allows pregnant women to receive CalWORKs even if their only eligible child is unborn, but the ACS does not record whether female respondents are pregnant. Subsequently, these PWO cases are entirely absent from our estimates. Correcting this assumption would likely cause our estimate of the take-up rate to decrease.
-
Asset Limits. We do not disqualify families for CalWORKs eligibility due to their assets (like savings accounts). We disregarded these factors because the ACS does not have sufficient data on the value of family assets. Correcting this assumption would likely cause our estimate of the take-up rate to increase.
Initial Findings
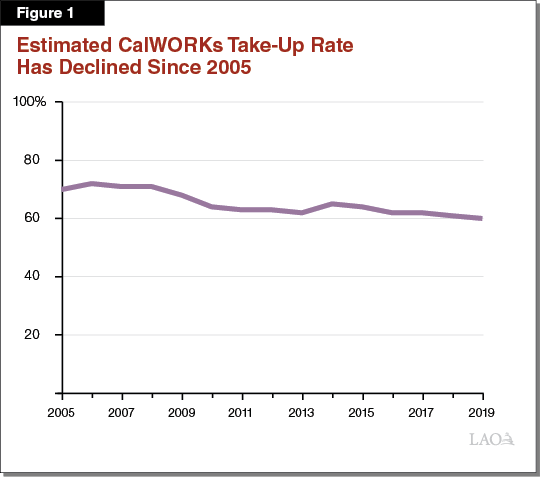
CalWORKs Currently Serves About 60 Percent of Eligible Families. We estimate that, in 2019, about 605,000 families were eligible for CalWORKs while about 365,000 were enrolled, for an estimated CalWORKs take-up rate of 60 percent.
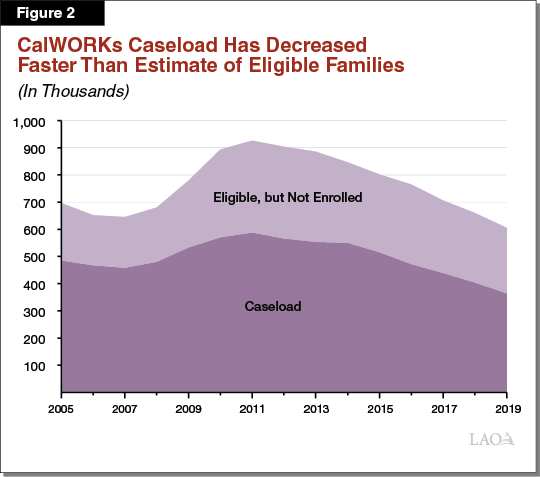
CalWORKs Take-Up Rate Has Fallen Since 2005. Figure 1 illustrates how the CalWORKs take-up rate changed between 2005 and 2019. Figure 2 compares our estimate of the total eligible population (light and dark sections) to those enrolled in CalWORKs (dark section only). Between 2005 and 2008 (during the economic expansion which preceded the Great Recession), the take-up rate hovered around 70 percent as both CalWORKs caseload and the number of CalWORKs-eligible families decreased year over year. After the Great Recession, however, the take-up rate fell to around 65 percent as the CalWORKs caseload increased at a slower pace than the increase in the number of CalWORKs-eligible families. In the years since, CalWORKs caseload has declined at a somewhat faster pace than the number of CalWORKs-eligible families, causing the take-up rate to fall to around 60 percent.
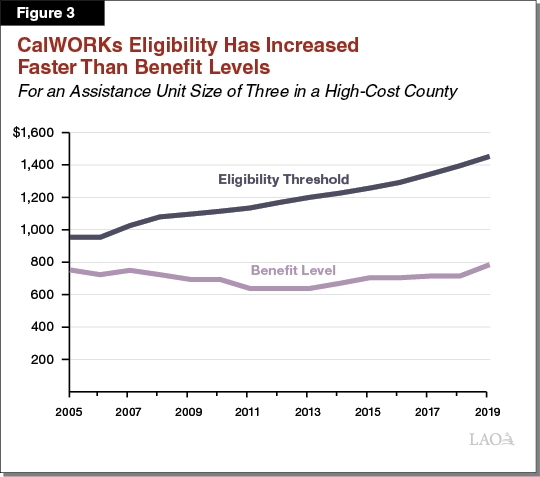
CalWORKs Eligibility Thresholds Have Risen More Quickly Than Benefits. Figure 3 compares the change in the eligibility threshold to the change in grant levels over the last 15 years. Since 2005, the CalWORKs income eligibility threshold has increased by more than 50 percent, making more families with relatively higher incomes eligible to enroll in the program. At the same time, CalWORKs benefits have increased by less than 5 percent (note that neither the benefit nor eligibility threshold figures have been inflation-adjusted). Because families earning relatively higher incomes already receive relatively smaller benefits, they have less incentive to enroll than lower-income families. Because benefit levels did not increase at the same pace as the eligibility threshold, these newly eligible families may have seen little benefit to enroll in the program, potentially explaining the lower take-up rate to an extent. (For example, a family of three earning $1,400 a month would be newly eligible for CalWORKs in July 2019, but would only receive a monthly benefit of about $250.)
Future Posts Will Explore Additional Reasons for the Decline in Take-Up Rates, Among Other Topics. In upcoming posts, we plan to examine whether and how the CalWORKs take-up rate varies among different regions in the state and explore reasons for those differences. We also will attempt to identify which types of families are most likely to enroll in CalWORKs when eligible.
Conclusion
Measuring the CalWORKs take-up rate is an important step towards potentially improving participation in the program. The state has recent experience in improving the take-up rate in similar programs, further helping those programs achieve their intended policy goals. For CalWORKs in particular, an improved understanding of the take-up rate could improve caseload forecasting and help the state mitigate the ongoing economic effects of COVID-19.