LAO Contact

September 30, 2021
Reducing the Destructiveness of Wildfires:
Promoting Defensible Space in California
For a quick look, download the  Executive Summary
- Introduction
- Defensible Space Helps Prevent Wildfire Disasters
- Current State and Local Defensible Space Efforts
- Findings
- Recommendations
- Funding Options for Implementing Recommendations
- Conclusion
- Appendix
Executive Summary
Defensible Space Is Valuable Tool to Reduce Destructive Wildfires
Reducing Home Ignitions Helps Prevent Destructiveness of Wildfires. Many of the largest and most damaging wildfires have occured in recent years. One approach to mitigating future wildfire disasters is to reduce the chance that homes ignite when wildfires occur nearby, such as through the maintenance of defensible space—areas free of excess or dead vegetation—around homes. Importantly, maintaining defensible space not only helps to protect that home, it also reduces the risk that the wildfire will spread to neighboring homes, thereby helping to protect communities.
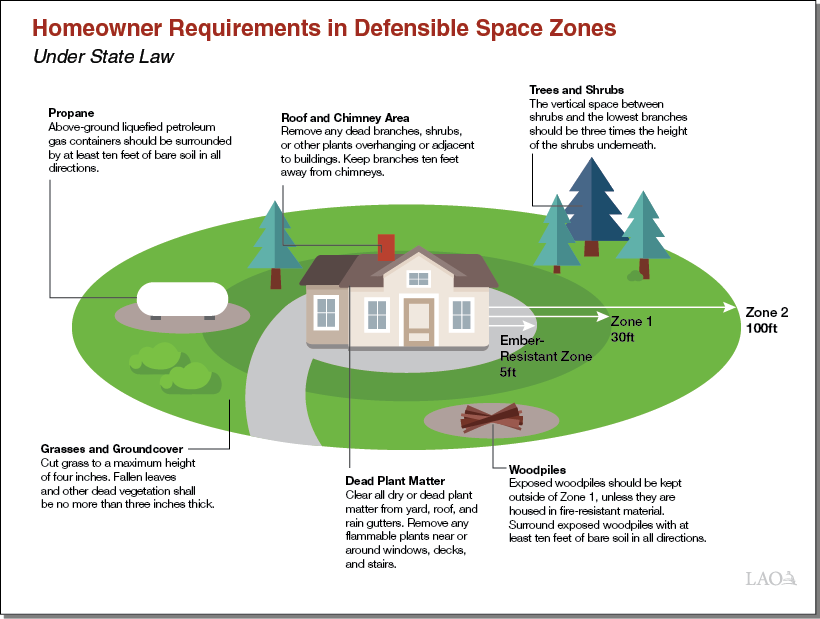
Existing Defensible Space Requirements. Under existing state and local laws, homeowners in certain areas at high risk of wildfires are required to create and maintain defensible space. As shown in the nearby figure, state law requires implementation of certain defensible space practices within three separate zones around structures.
State and Local Agencies Administer Various Defensible Space Programs. The California Department of Forestry and Fire Protection (CalFire) and local agencies administer a range of programs aimed at improving compliance with defensible space requirements. The most common defensible space activity is inspections of properties to assess compliance. Other programs include homeowner education activities, financial or other assistance, and enforcement.
Achieving Compliance Complicated by Various Factors
Many communities report relatively high compliance rates with defensible space regulations, but there is significant variation by location. Moreover, given the large number of homes in fire‑prone areas in California, even a moderately high compliance rate means that there are probably hundreds of thousands of homes out of compliance throughout the state. We find that efforts to improve compliance rates are complicated by factors including:
- Fragmented and Overlapping Responsibilities. There are hundreds of state and local agencies involved in defensible space programs. Without consistent coordination, this can lead to gaps in the delivery of programs in some places and potential duplication in others.
- Lack of Consistent Statewide Data. A lack of consistent statewide data on defensible space inspections and compliance makes it difficult to (1) identify where gaps in or overlapping inspection programs are occurring, (2) fully understand the extent to which homeowners are out of compliance with defensible space regulations in different communities, and (3) assess the effectiveness of programs at improving compliance.
- Lack of Resources, Authority, and Motivation. Other key barriers to state and local agency efforts to improve compliance include insufficient funding and staffing, authority to fine non‑compliant homeowners, and motivation to implement strong defensible space programs.
- Cost‑Effectiveness of Defensible Space Not Well Understood. The research literature has not yet provided clear information on the cost‑effectiveness of maintaining defensible space compared to other risk‑reduction activities, or on the cost‑effectiveness of different programs designed to improve defensible space compliance. This lack of information makes it difficult to determine which specific steps, if any, state or local agencies should undertake.
Recommend Legislature Take Steps to Improve Compliance
Improve Data Collection, Sharing, and Quality. We recommend the Legislature take steps to improve the availability of consistent information on defensible space programs, which would benefit policymakers and program administrators. This includes increased state support for a shared data collector application and ensuring that state and local agencies feed inspections data into a centralized system.
Take Steps to Address Other Barriers to State and Local Efforts. To begin addressing the barriers of lack of resources, authority, and motivation, we recommend: (1) increased ongoing resources for CalFire inspections, (2) providing CalFire with administrative fee authority, and (3) using oversight of reported compliance rates to improve transparency and help motivate agency actions.
Support Additional Research Efforts to Identify Effective Strategies. We recommend that data collection and evaluation be integrated in defensible space grant programs as a condition of future state funding. We further recommend that the state fund demonstration projects to provide better information on the most cost‑effective strategies for improving compliance, including the use of newer strategies involving insurance and emerging technology.
Conduct Oversight to Inform Future Decisions. We recommend that the Legislature conduct ongoing oversight focused on (1) assessing the size and location of gaps and overlaps in programs, (2) the implementation of CalFire’s new training program, (3) the cost‑effectiveness of defensible space activities, and (4) the outcomes of current and future demonstration projects. This oversight could inform future policy decisions and help the state target limited funding in ways that increase compliance and reduce wildfire risk to homeowners and communities.
Introduction
Reducing Home Ignitability Through Defensible Space Is a Key to Mitigating Wildfire Disasters. In recent years, California has experienced a growing number of highly destructive wildfires. Of the 20 most destructive wildfires in California’s recorded history (as measured by the number of structures lost), 13 have occurred since 2017. Together, these 13 fires caused tremendous damage, destroying nearly 40,000 structures, taking 148 lives, and charring millions of acres.
There are two main approaches to mitigating wildfire disasters. One approach is to reduce the chance that homes will be exposed to wildfires, such as through a robust fire suppression program. A second approach is to reduce the chance that homes ignite when wildfires occur nearby. There is evidence that a key way to reduce these home ignitions, and thus protect homes from being lost to wildfires, is for homeowners to maintain areas free of excess or dead vegetation around their homes—commonly referred to as defensible space. When homeowners maintain defensible space, it reduces the risk that the flames, radiant heat, and embers from wildfires will ignite homes, thus reducing home losses. Additionally, defensible space provides more areas for firefighters to position themselves and their equipment in order to defend homes from wildfires.
Report Responds to Legislative Interest in Defensible Space. We prepared this report in response to legislative interest in wildfire mitigation and, more specifically, potential improvements to the current defensible space practices in California. While we focus this report on defensible space, we acknowledge that defensible space is just one of several strategies to reduce the risk of wildfire disasters, with other strategies including home hardening, implementation of fire breaks, and projects to improve forest health and reduce excess vegetation.
Report Focuses Primarily on How State Can Support Individual Efforts. The state does not bear the primary responsibility for defensible space. Instead, the creation and maintenance of defensible space around private properties is an owner responsibility. When homeowners or other property owners fail to maintain defensible space, however, they can put their neighbors and the larger community at greater risk of devastating wildfires, which can have myriad negative impacts on the state. Accordingly, reducing wildfire disasters by promoting defensible space is an issue of statewide importance. This report focuses largely on how the state—and Legislature in particular—can support efforts undertaken by state and local agencies to encourage homeowners to comply with relevant defensible space requirements.
Research Approach Focused on Literature Review, Survey, and Interviews. To formulate the findings and recommendations presented in this report, we drew upon a wide range of information sources. Our analysis was informed by a survey we conducted of local fire agencies. In addition, we conducted roughly 50 interviews with groups that have a variety of perspectives on the issue, including local fire agencies, academic researchers, nongovernmental organizations, interest groups, private companies, and state departments. We also accompanied inspectors from the California Department of Forestry and Fire Protection (CalFire) on some defensible space inspections. Finally, we reviewed relevant reports and academic literature. We list some of the key work that informed this report in the Appendix.
Structure of Report. The report includes the following five main sections:
- In the first section, we provide background on the role defensible space plays in preventing wildfire disasters.
- The second section summarizes the state’s main programs for verifying and promoting defensible space, as well as what we learned about local efforts based on our survey and interviews.
- The third section contains our analyses and findings.
- In the fourth section, we provide recommendations for promoting defensible space compliance.
- The last section discusses the main funding sources that the state could use to implement our recommendations, as well as other potential future state efforts to promote defensible space.
Defensible Space Helps Prevent Wildfire Disasters
Wildfire Disasters in California
Many Parts of the State Are Prone to Wildfires. California’s climate makes it naturally susceptible to wildfires. The state’s rainfall is highly seasonal, typically falling mostly in the late fall and winter. Starting in the spring, much of the state typically experiences low levels of rainfall and increasingly warm conditions. These conditions begin to dry out vegetation, which makes the state increasingly susceptible to wildfires during the summer and early fall.
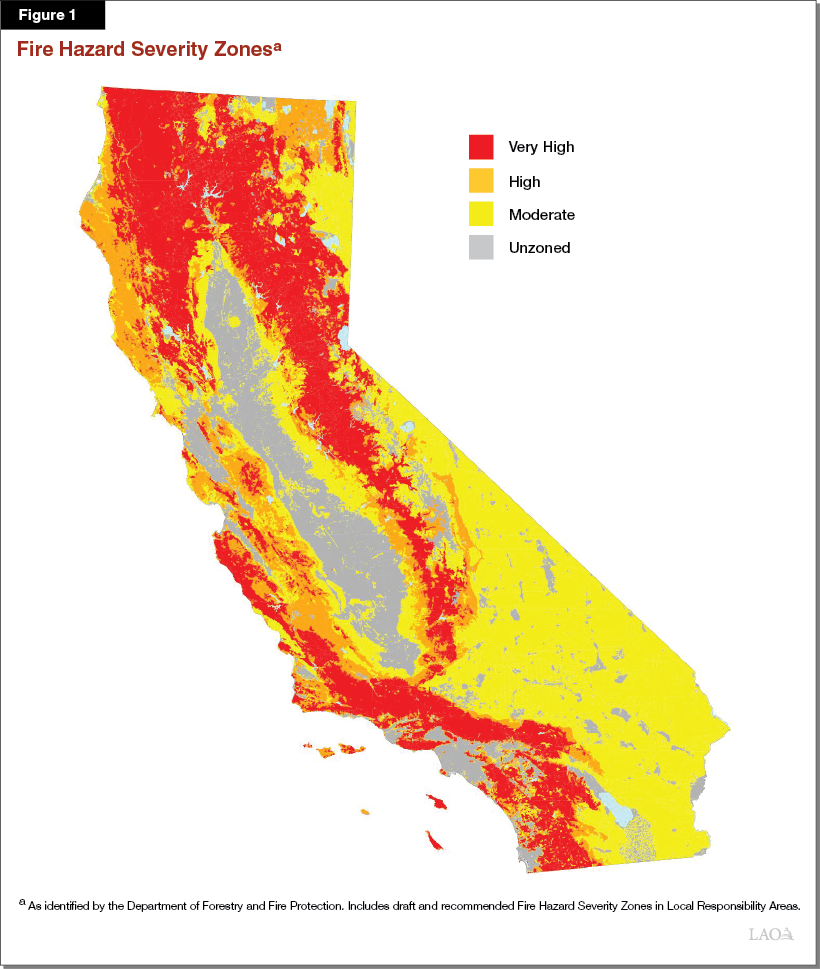
While California tends to be prone to wildfires—particularly in the dry months of the year—some areas of the state are at particularly high risk of severe wildfires due to factors such as the type of vegetation present, the local weather patterns, and the topography. CalFire designates such areas as high and very high fire hazard severity zones (HFHSZs and VHFHSZs).
As shown in Figure 1, HFHSZs and VHFHSZs are scattered across various parts of the state. Notably, many of them are in lightly populated areas and small communities where human development abuts or intermingles with undeveloped wildlands, commonly referred to as the wildland‑urban interface (WUI). In addition, some more populated suburban areas also can be highly susceptible to wildfires, such as during high wind conditions.
Wildfires Are a Natural Part of California’s Ecosystems. Historically, significant parts of the state would burn annually, especially during the warm, dry months of the year. In the 1700s, an estimated 4.5 million acres burned each year, on average, in these regular wildfires. This is more than four times the average annual amount of acreage that has burned in recent decades, due in large part to the state’s focus on suppressing fires to protect lives and property. Many species native to California adapted to regular, low‑ and moderate‑intensity wildfires. These regular fires played an important role in keeping the state’s forests and landscapes healthy by periodically clearing underbrush and contributing to regrowth of native plant species.
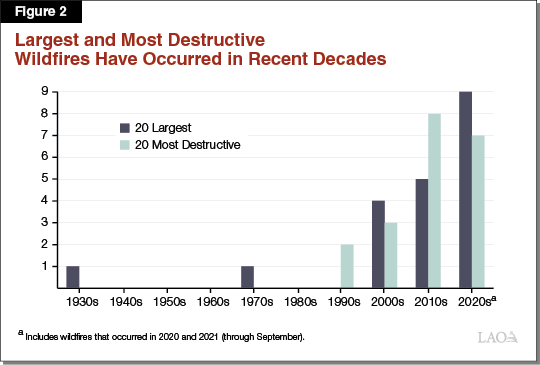
Wildfire Disasters Are a Large and Growing Problem. While wildfires have potential benefits, they can also be highly problematic when they are much more severe than they would be naturally and threaten lives and property. In recent years, California has experienced a growing number of problematic wildfires. As Figure 2 shows, most of California’s largest and most destructive wildfires have occurred in recent decades. This trend has been particularly notable in the last few years, which have seen some of the worst wildfires in the state’s recorded history. For example, the 2018 wildfire season included the Camp Fire in Butte County, which became the single most destructive wildfire in state history with nearly 19,000 structures destroyed and 85 fatalities, including the near‑total destruction of the town of Paradise. The 2020 wildfire season also included several particularly catastrophic wildfires. Five of the 20 most destructive wildfires in the state’s history occurred in 2020 alone. Many of these fires were not only large and destructive, but they also exhibited extreme behavior. These wildfires overwhelmed the state’s fire response capacity and led to the destruction of roughly 7,800 structures and the deaths of 23 people.
Experts Have Identified Some Factors That Are Contributing to More Wildfire Disasters. A few key factors are exposing more homes to large, intense wildfires, leading to more wildfire disasters. These factors include:
- Climate Change. Climate change is contributing to hotter weather and longer dry seasons in California than was previously typical. These conditions increasingly dry out vegetation and lengthen the wildfire season, which increases wildfire risks. Combined with high winds, the results can be particularly devastating, since embers from a wildfire can blow miles away from the main fire before igniting dry vegetation and homes. For example, weather conditions were a major factor in several of the recent wildfires that were particularly destructive, such as the Camp Fire. Additionally, climate change can negatively affect forest health by increasing the frequency and severity of droughts, which can put stress on trees and make them more susceptible to pest infestations. This, in turn, can lead to more diseased, dead, and dying trees, which can also exacerbate the severity of wildfires by providing more combustible fuels.
- Poor Forest and Land Management Practices. Over time, much of the state’s forestlands have become unhealthy, in part due to the focus on suppressing naturally occurring fires in recent decades. This has resulted in many forests densely filled with relatively small trees and brush, which serve as “ladder fuels” to carry wildfires into tree canopies, increasing their spread. Importantly, there is growing recognition that forest management practices should change to better support the natural role of wildfires in the California environment, including less reliance on suppression and greater use of prescribed fires.
- WUI Development. Over time, as the state’s population has increased, more homes and communities have been built in the WUI. Development in these areas increases the risk of ignitions, since many ignitions are caused by human activity. Also, development in the WUI means that more people and property are located in vegetated wildland areas that are prone to wildfires. Thus, when wildfires occur, they are more likely to be deadly and destructive.
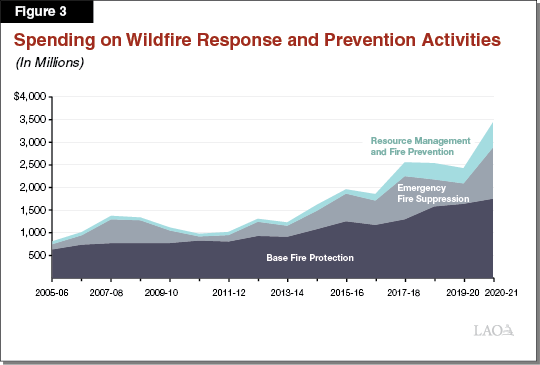
Wildfires Are Costly, Particularly When They Become Disasters. Federal, state, and local governments incur significant fiscal costs related to wildfires. State costs related to wildfires have increased markedly in recent years. For example, as shown in Figure 3, the cost to the state General Fund of resource management and fire prevention is estimated to be about $550 million in 2020‑21, up from about $60 million in 2005‑06, which largely reflects increased state funding in more recent years. Additionally, the cost of providing fire protection is estimated to reach $2.9 billion in 2020‑21. This represents a substantial increase from the roughly $750 million that the state spent on fire protection in 2005‑06. Part of the growth in fire protection costs has been driven by the need to respond to the recent large wildfires that the state has faced. For example, of the $2.9 billion in estimated General Fund costs in 2020‑21, about $1.1 billion was spending from the Emergency Fund (also known as the E‑Fund), which was largely related to responding to the large, destructive wildfires that the state confronted in 2020. (Total E‑Fund costs in 2020‑21 are estimated at over $1.7 billion, but are anticipated to be offset by roughly $600 million in federal reimbursements.)
Large, destructive wildfires not only increase response costs, but can also result in significant costs to governments, private property owners, insurers, and others related to cleaning up damage and rebuilding homes and infrastructure. For example, as of June 2021, the administration estimated that the cost of removing debris related to the 2020 wildfires would reach roughly $1.8 billion, about $700 million of which is expected to be paid for by the state General Fund and $1.1 billion of which is expected to be reimbursed by the federal government. Additionally, the insured losses from the 2020 fires in California have been estimated at $5 billion or more.
Preventing Wildfire Disasters by Maintaining Defensible Space
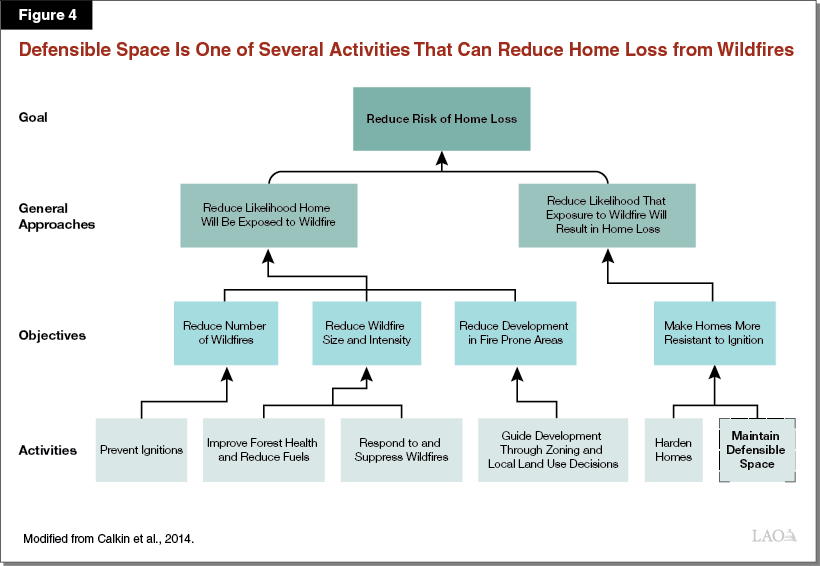
A Key Way to Reduce Wildfire Disasters Is to Reduce Home Ignitions. As shown in Figure 4, there are two general approaches to reducing the likelihood that homes are lost to wildfires. One approach is to reduce the chance that homes will be exposed to wildfires in the first place through a robust fire suppression program and forest and landscape health treatments aimed at reducing fire severity. The other approach is to reduce the chance that structures ignite when wildfires occur near populated areas. Reducing the likelihood that individual homes ignite is an important part of preventing wildfire disasters because burning homes can become added fuel for the fire, which can then ignite nearby vegetation and homes, thereby increasing the spread of the wildfire. If, however, homes and their surroundings are ignition‑resistant, the destructiveness of these wildfires can be reduced.
Historically, state, federal, and local programs have focused primarily on the approach of reducing the chance that homes will be exposed to wildfires in the first place, mostly by funding a robust fire suppression program aimed at protecting lives and property. However, the trends discussed above—climate change, changing landscape management practices, and increased populations living in the WUI—make it increasingly important to ensure that homes are resilient to wildfires. These trends mean that many communities in California will need to become more accustomed to living safely alongside wildfire even if we have robust suppression programs.
Defensible Space Plays Important Role in Reducing Home Ignitability. Researchers generally agree that it is important for homeowners to maintain an area free of excess or dead vegetation around their homes, known as defensible space. (We summarize some of the state and local defensible space requirements later in this report.) When defensible space is maintained, there is less flammable material near homes that can ignite and spread to the homes themselves. Evidence supporting the protective effects of defensible space includes experiments that have shown that when defensible space is maintained, radiant heat from nearby fires generally cannot ignite homes. Researchers have also conducted studies after individual wildfires to explore the role of defensible space and other factors in home survivability. For example, a 2013 study of two large fires in San Diego County found that structures that had vegetation cleared within 30 feet survived at about twice the rate of structures that did not have that vegetation clearance. Additionally, in 2021, the Insurance Institute for Business and Home Safety (IBHS) collaborated with a private data analytics firm on an analysis of over 70,000 properties within wildfire areas over a three‑year period. Using pre‑ and post‑satellite imagery, the study estimated that homes with heavy vegetation coverage near the structure were roughly twice as likely to be destroyed by a wildfire than homes with less vegetation. Furthermore, in 2019, CalFire staff conducted an analysis of the relationship between defensible space compliance (as assessed through its defensible space inspection program) and destruction of structures during the seven largest fires that occurred in California in 2017 and 2018. Overall, this analysis concluded that the odds of a structure being destroyed by wildfire were roughly five times higher for noncompliant structures compared to compliant ones.
Notably, while there is a general consensus among researchers that defensible space can help protect homes from igniting during wildfires, there are still gaps in knowledge. For example, there is limited information on the degree to which the effectiveness of defensible space depends on the specific setting of a home, including the adjacent topography and vegetation types. We discuss some of these gaps in more detail in the “Findings” section of this report.
Area Closest to Home Likely Most Important to Reducing Home Ignitions. Overall, existing research not only indicates that defensible space can play an important role in reducing home ignition and loss, it also suggests that the area closest to the home is likely the most important to preventing home ignitability. For example, a 2014 study of homes burned in San Diego County found that structures were more likely to survive a fire with defensible space immediately adjacent to them and that the most effective actions included ensuring that vegetation does not overhang or touch structures. Based on this type of research, organizations such as IBHS and the National Fire Protection Association indicate that it is most critical for homeowners to keep the areas immediately adjacent to their homes free from flammable vegetation or other items.
Multiple Entities Have an Interest in Supporting Defensible Space Practices
Defensible Space Helps Homeowners Protect Their Homes. Defensible space is generally considered to be the homeowner’s responsibility. Much of the defensible space work takes place on private property, generally around private homes. Additionally, homeowners themselves have a significant stake in defensible space, since it can play an important role in protecting their homes—often their most valuable asset—from wildfire.
Defensible Space Is Also Important for Neighbors, Governments, and Insurers. While homeowners benefit from defensible space on their properties, the benefits extend to others, as well. For example, when homeowners maintain defensible space, their homes are less likely to ignite other nearby homes, overwhelm firefighters, and ultimately threaten larger communities with wildfire disasters. As such, an individual homeowner’s decision to create and maintain defensible space can help protect communities, governments, and insurers from the significant costs of wildfire disasters.
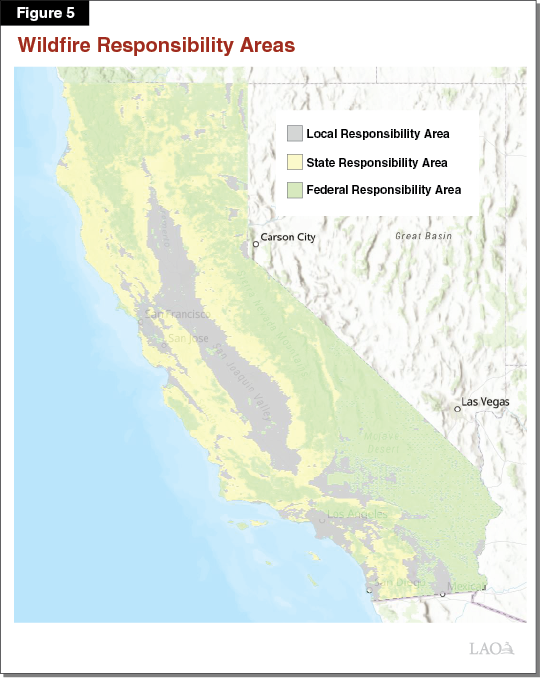
Federal, State, and Local Governments Share Responsibility for Response and Prevention. For the purposes of wildfire response and prevention, land in the state is divided into three main areas—Local, State, and Federal Responsibility Areas (LRAs, SRAs, and FRAs, respectively)—depending on which level of government bears primary responsibility. Local agencies—such as county fire departments and fire protection districts—are primarily responsible for fire protection in LRAs, which include areas such as incorporated cities and agricultural lands. CalFire is responsible for fire protection in the SRA. (CalFire and local agencies sometimes provide primary response and prevention services in each other’s jurisdictions under contractual relationships.) As shown in Figure 5, the SRA includes over 31 million acres—about one‑third of the state—and primarily consists of privately owned wildlands.
State and Local Requirements for Maintenance of Defensible Space
Given the broader public interest in defensible space, state and local governments impose various requirements on homeowners to create and maintain defensible space, as described further below.
State Laws Establish Minimum Defensible Space Requirements. Current state law requires the Board of Forestry and Fire Protection (BFFP) to establish defensible space requirements for structures in the SRA and VHFHSZs in the LRAs in California. (There are estimated to be about 768,000 structures in the SRA and roughly 700,000 structures in VHFHSZs in the LRAs.) Under the existing regulations set by the board, homeowners in these areas must meet specific requirements on their properties within two zones: (1) certain requirements within 100 feet of structures and (2) additional, more stringent requirements within 30 feet of structures. These regulations include requirements related to maintenance of live vegetation (trees, shrubs, and grasses), clearance of dead vegetation, and the location and storage of wood piles and other flammable items near the structures. (Figure 6 shows some of the requirements in these two zones, as well as identifies a recently established third zone discussed below.)
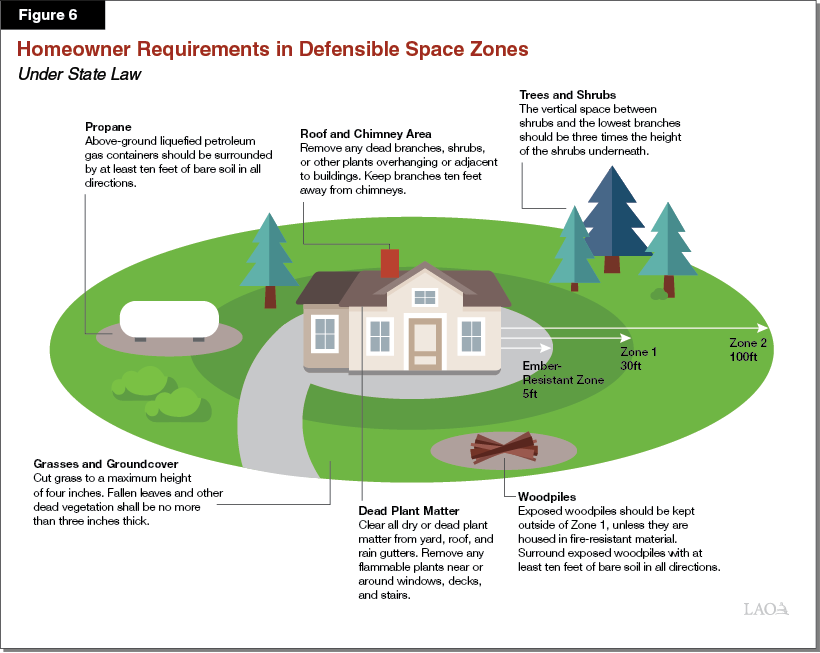
In recognition that the area immediately surrounding a home is likely the most important for protecting a home from igniting during a wildfire, the Legislature passed Chapter 259 of 2020 (AB 3074, Friedman), which creates a third, “ember‑resistant zone” within five feet of structures in SRAs and VHFHSZs. The statute requires BFFP to promulgate regulations to implement the requirement for an ember‑resistant zone and to create a related guidance document no later than January 1, 2023. Those regulations, when completed, will provide specific information on the types of vegetation allowed in the ember‑resistant zone.
CalFire Enforces State Requirements in SRA. CalFire is responsible for enforcing defensible space requirements in the SRA. In six “contract counties”—Kern, Los Angeles, Marin, Orange, Santa Barbara, and Ventura—CalFire delegates all wildfire response responsibilities in the SRA to the county fire agency and provides them with associated funding. These agencies also are responsible for enforcement of defensible space requirements in the SRA within their counties. When CalFire receives additional resources for defensible space in the SRA, these contract counties receive additional resources, as well.
Local Agencies Sometimes Enforce Stricter Requirements. Local agencies are responsible for enforcing defensible space requirements in the VHFHSZs within their jurisdictions. In some cases, local jurisdictional boundaries overlap with the SRA, so both CalFire and local jurisdictions can have shared responsibility for enforcing defensible space requirements. According to CalFire, 95 percent of SRA where there are houses is in a local fire district or served by a county fire department. State law requires jurisdictions to adopt defensible space ordinances if they have VHFHSZs within their boundaries. As part of these ordinances, state law authorizes local jurisdictions to establish more stringent—but not less stringent—requirements than those established by BFFP. As described further in the nearby box, in fall 2020, we surveyed local fire agencies on their defensible space programs. Of the 54 agencies that responded to a question in our survey about their ordinances, 59 percent reported that their local jurisdictions had adopted a local ordinance more stringent than required under state regulations. Some of these additional requirements include specific management requirements for certain types of vegetation, expanding defensible space requirements beyond 100 feet for certain properties, creating more stringent requirements in areas immediately adjacent to structures, and applying defensible space requirements to additional areas—such as in HFHSZs and on vacant parcels. Some local ordinances also allow the local fire agency to assess an administrative fine for noncompliance with local defensible space requirements. (As we discuss later in this report, CalFire has authority to issue citations enforced by the courts, but does not currently have authority to assess administrative fines.)
LAO Survey of Local Fire Agencies in California
In fall 2020, we conducted a survey of local fire agencies across the state to better understand the activities they are engaging in related to defensible space. The survey yielded responses from 110 local fire agencies, though not all agencies provided responses to every question. We estimate that there are over 500 local fire agencies in California, including those administered by city and county governments (though not all agencies are in locations that necessitate a defensible space program). Our survey respondents included agencies of different sizes and from various parts of the state. While instructive, we do not think the survey results can be generalized to all defensible space programs in the state.
State Does Not Require Specific Enforcement Activities. State and local defensible space requirements apply to homeowners. While state and local agencies are authorized to enforce defensible space regulations, there generally is no requirement that they conduct enforcement or that homeowner compliance be verified, such as through inspections. Hence—and as discussed in more detail later in this report—the degree to which inspections and enforcement occurs varies significantly across jurisdictions. The one exception to the absence of inspection requirements is under Chapter 391 of 2019 (AB 38, Wood). Beginning July 1, 2020, property sellers in HFHSZs and VHFHSZs must disclose to buyers whether the home complies with defensible space requirements. The new law requires property sellers to obtain documentation of an inspection from CalFire or a local agency that verifies this compliance.
Barriers to Homeowners Maintaining Defensible Space
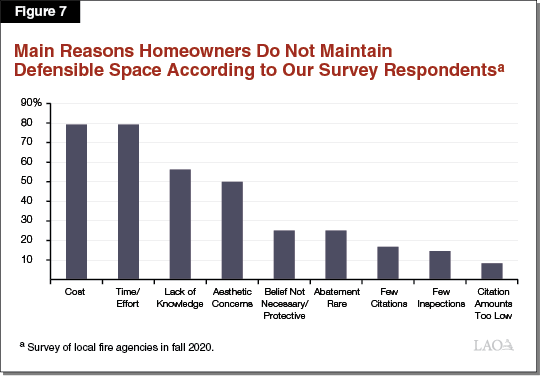
Researchers have explored—mostly using survey data and interviews—some of the barriers homeowners typically face related to completing defensible space work, including prohibitive costs and/or time required, inadequate motivation to comply, and incomplete understanding of the nature of the risk to their home. Notably, the survey responses we received from local agencies about their perceptions of the barriers facing homeowners echoed these research findings. The responses to our survey are summarized in Figure 7. We summarize some of the key barriers to compliance identified by the research literature below.
Lack of Resources Deters Many Homeowners From Maintaining Defensible Space. Research suggests that the resources required to complete defensible space work—in the form of time and money—can be a significant barrier. In particular, certain activities, such as removal of large trees, can be difficult and cost thousands of dollars if the homeowner hires someone to conduct the removal. Additionally, much of defensible space work is not a one‑time activity, but instead involves the trimming of vegetation growth that should happen periodically. For example, activities such as cutting grasses and cleaning gutters are relatively simple and inexpensive, but they must be conducted regularly to be effective. Some homeowners—such as those who are low income—might not have the necessary resources to complete these activities, even if they were highly motivated to do so. In particular, it can be particularly difficult for low‑income individuals that have limited physical capabilities to maintain defensible space because they may not be able to conduct the work themselves or afford to hire someone to help them do so.
Homeowners Might Not Be Adequately Motivated to Maintain Defensible Space. The literature points to various potential reasons for a lack of motivation among some homeowners. For example, some research has found that homeowners like the aesthetics or other amenities (such as shade) provided by existing trees and other vegetation. Additionally, homeowners might perceive that their actions have limited effectiveness, particularly if they see neighboring property owners are putting them at risk by not maintaining their defensible space. Absent strong social pressures or financial incentives— such as enforcement of fines for noncompliance—these homeowners might not consistently prioritize taking action to maintain defensible space.
Homeowners Might Not Fully Understand Nature of Risk to Home. Research suggests that homeowners generally are aware that their properties are at risk of wildfires. In some cases, however, they might underestimate the level of risk of potential damage to their properties, particularly if their area has not experienced a wildfire recently.
Current State and Local Defensible Space Efforts
CalFire and local agencies administer a range of programs aimed at addressing the barriers homeowners face in creating and maintaining defensible space, as well as improving compliance with defensible space requirements. Below, we summarize the main defensible space programs administered in California, including inspections, homeowner education, homeowner assistance, and enforcement.
Defensible Space Inspections
Inspections Contribute to Increased Compliance in Multiple Ways. Inspections are the main type of activity state and local agencies undertake related to defensible space. During inspections, inspectors visit properties to assess their compliance with defensible space requirements. State and local agencies vary in how they conduct inspections, which properties are prioritized for inspections, and the training provided to inspectors. However, in general, inspections can contribute to improved defensible space compliance in several ways. First, inspections verify whether homeowners are complying with defensible space requirements and best practices. Failure to meet requirements can then lead to enforcement actions. Second, many agencies use inspections as an opportunity to educate homeowners about specific steps they can take to reduce their risk. Third, inspections can play an important role in homeowner financial assistance programs. For example, in some cases, inspections are used to identify specific activities (such as the removal of certain trees) that are eligible for reimbursement through these programs.
CalFire Inspection Rates Vary by Unit. CalFire is organized into 27 units (including the six contract counties) with each comprised of the SRA within one or more counties. Statewide, CalFire has identified about 768,000 parcels within the SRA subject to defensible space inspections. The department’s goal is to inspect each of these parcels once every three years (roughly 250,000 parcels annually). In total, CalFire (including contract counties) has completed over 200,000 inspections in each of the past couple years, so the agency is falling somewhat short of its goal. Also, as shown in Figure 8, the rate of inspections varies considerably by unit. For example, among CalFire (noncontract) units, four units inspected 10 percent or fewer of their parcels in 2019‑20 (the most recent year for which data was available at the time this report was prepared), while four units inspected more than half of their parcels that year. Notably, five out of six of the contract counties have inspection rates exceeding 50 percent.
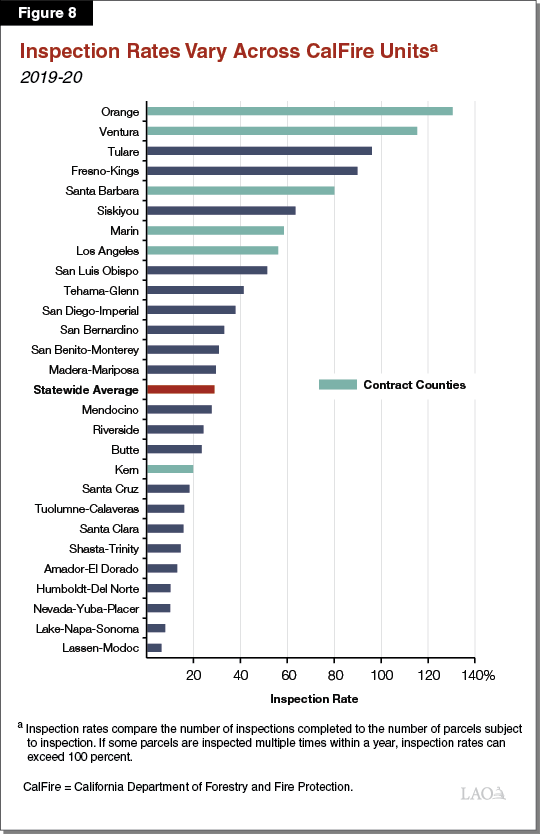
The inspection rates cited above compare the number of parcels inspected to the number subject to inspection. Because some parcels are inspected multiple times within the year, these inspection rates overstate the percentage of parcels that are inspected each year. At the time of the preparation of this report, CalFire was not able to provide data on how many unique properties were inspected each year or how many properties had not been inspected within the past three years. So, it is unclear what share of properties have received recent inspections.
CalFire Has Base Funding and Staffing, Plus Recent Augmentations. The department completes inspections with a base inspections budget of $3.4 million annually from the Greenhouse Gas Reduction Fund (GGRF)—which is generated from the state’s cap‑and‑trade system. CalFire’s base funding supports between 1 to 1.5 full‑time equivalent defensible space inspector staff at each of its 21 noncontract county units. (The six contract counties each receive similar levels of funding to the noncontract CalFire units.) Units have flexibility in how they utilize this position authority, and units generally use this base funding to employ between four and six seasonal inspectors for a three‑month period. Notably, in addition to dedicated inspectors, CalFire also deploys firefighters to conduct defensible space inspections as time permits. In 2019‑20, inspectors performed 69 percent of CalFire inspections, and firefighters performed 31 percent.
In recent years, CalFire’s base funding for defensible space inspections staff has been supplemented with additional funding from other sources—such as by utilizing a share of GGRF funds available for forest health and fire prevention activities to extend the use of seasonal inspectors to up to nine months. Recent budget actions have provided three augmentations for CalFire’s defensible space inspection programs. First, in April 2021, the Legislature passed a $536 million “early action” wildfire resilience package that added $2 million on a one‑time basis to CalFire’s 2020‑21 General Fund budget for additional defensible space inspectors. Second, the 2021‑22 Budget Act includes $8.3 million ($6.1 million ongoing) from the General Fund for 26 year‑round positions to support defensible space inspections related to property sales in accordance with Chapter 391. Third, the 2021‑22 budget was amended in September 2021 to include a $988 million wildfire resilience package, which included $13 million from the General Fund on a one‑time basis for defensible space inspectors.
Local Agencies Vary Widely in Share of Parcels Inspected. A total of 35 local fire agencies (excluding contract counties) provided data in response to our survey on the number of defensible space inspections completed and the number of parcels within their jurisdictions that are subject to inspections. On average, these agencies reported an annual inspection rate of roughly 35 percent. As with CalFire, the inspection rate varied considerably across jurisdictions, with reported inspection rates ranging from 3 percent to 100 percent. Local agencies report using a mix of dedicated year‑round and seasonal staff of various titles to perform inspections.
Local Agencies Use Various Resources to Support Defensible Space Inspections. The most common funding source for inspections is the local agency’s General Fund (including allocations of property taxes received by fire districts). About 90 percent of the 44 local agencies that reported information on funding sources indicated that they used their General Fund to support their inspection programs. Other funding sources reported by local agencies include citations and fees, special taxes, and federal grants. For example, in 2020, voters in Marin County passed a special parcel tax to fund the creation of a joint powers authority focused on ï¬re protection and prevention, including defensible space.
Homeowner Education Programs
CalFire Engages in Public Education Efforts. CalFire conducts general public outreach through different media outlets and provides printed information to homeowners upon inspection. CalFire also reports that the main purpose of its inspection program is to educate the public. If homeowners are present during inspections, CalFire inspectors will use the opportunity to engage homeowners and educate them on defensible space. This could include walking around the home with the homeowner and visually identifying risks to the property, including violations of state defensible space requirements, as well as the failure to follow other best practices—such as home hardening.
Local Agencies and Nongovernmental Organizations Also Engage in Public Education. Many local agencies reported that their defensible space programs include public education through participation at community events and/or the provision of brochures or other written information to homeowners, often during inspections. Some local agencies also use inspections as an opportunity to educate homeowners about defensible space. Additionally, the state is home to over 100 local fire safe councils, which typically focus on educating their local communities about wildfire. These community‑based groups serve many, but not all, parts of the state.
Homeowner Assistance Programs
CalFire’s Fire Prevention Program Provides Grants to Support Assistance to Homeowners. CalFire administers the state’s Fire Prevention Grant Program. This program is funded through GGRF and provides grants to government agencies, nonprofits, and tribes to support projects that reduce wildfire risk and increase community resiliency. In recent years, among other things, this program has supported various activities related to defensible space, including community outreach and education; the purchase of equipment (such as wood chippers); and removal of dead trees or other hazardous vegetation on certain properties, such as those owned by seniors or the disabled. From 2017‑18 through 2019‑20, roughly $33 million of the $169 million awarded through the Fire Prevention Grant Program went to local agencies and nonprofits for projects related to defensible space. (Some of these projects also included other fire prevention activities, so the amount of funding directed to defensible space was likely less than $33 million.)
Some Local Agencies and Nonprofits Run Local Homeowner Assistance Programs. Some local agencies and fire safe councils use funding from CalFire grants—and sometimes other sources such as local or federal funding—to support various types of assistance programs for homeowners. For example, of the 52 survey respondents who responded to our question about financial assistance or in‑kind assistance (such as use of wood chippers) to homeowners, 23 reported providing such assistance. These programs mostly consist of in‑kind services such as providing wood chipping and/or vegetation removal services. Six agencies reported having a financial assistance program. While CalFire does not provide any financial or in‑kind assistance directly to homeowners, its inspectors often refer homeowners to relevant local programs if they exist.
Defensible Space Enforcement
State and Local Enforcement Authority. Current law authorizes state and local fire agencies to issue citations for noncompliance. The fine for the first citation is at least $100, which increases to a misdemeanor and fine of at least $500 for the third violation. Local district attorneys and courts are responsible for enforcing these penalties. As noted above, some local agencies have ordinances that include provisions for administrative fines, which are enforced by the local jurisdiction rather than the court. State and local agencies also have the legal authority to direct the cleanup of noncompliant properties and to assess the resulting abatement costs on the property owner.
Agencies Rarely Issues Citations for Noncompliance. As discussed below, CalFire and local agencies generally report low noncompliance rates across the state. Nevertheless, with a total of 1.5 million properties in the SRA and VHFHSZs within LRAs, there are still likely a couple hundred thousand noncompliant properties throughout the state. Moreover, even with the limited inspection programs currently in operation, there are tens of thousands of noncompliant properties being identified each year. For example, in 2019‑20, about 30,500 inspections in the SRA (14 percent) resulted in a finding of noncompliance.
Despite potentially large numbers of noncompliant properties in the SRA and VHFHSZs, only a small share result in enforcement. In 2019‑20, CalFire and contract counties issued fewer than 1,000 citations, which account for only 3 percent of the noncompliant findings. Moreover, 21 of the 27 units (including contract counties) reported issuing only two or fewer citations in 2019‑20. (Kern County, a contract county, accounted for 86 percent of the citations issued by the remaining six counties.) According to CalFire, its units rarely issue citations, partly due to a belief that local district attorneys will not prioritize enforcement of the citations. Additionally, in CalFire’s view, educating homeowners is more effective and less administratively burdensome than issuing citations.
In our survey, 43 local agencies (excluding contract counties) reported the number of citations issued for noncompliance with state laws or local ordinances regarding defensible space. In total, these agencies reported about 15,100 citations annually. Of the 43 respondents, 17 agencies reported issuing no citations, 8 agencies reported issuing 10 or fewer citations, and 10 agencies reported issuing between 10 and 100 citations. The remaining eight agencies were responsible for 14,500—96 percent—of the total citations issued. Of the agencies that explained why they do not issue citations, the most common explanations were: (1) insufficient enforcement staffing or funding, (2) the ineffectiveness of citations for encouraging compliance, and/or (3) a decision to focus on education instead of citations. In addition, some agencies expressed a desire not to upset members of the local community by implementing strict enforcement measures.
CalFire and Most Local Agencies Rarely Use Abatement. State law authorizes state and local agencies to direct the cleanup of noncompliant properties and assess the resulting abatement costs to the homeowners. CalFire reports that it does not enforce abatement of noncompliant properties because it does not have the staffing to do so. In our survey, 37 local agencies reported the number of abatement actions undertaken in their jurisdictions. Of these, the majority—21 agencies—reported not conducting any abatements. Of the remaining, only two agencies reported conducting more than 50 abatements each. Of the local agencies that explained why they do not conduct abatement, a large majority cited insufficient staffing or funding, including difficulty recovering abatement costs. Our discussions with local agencies indicate that if they use abatement, they typically do so as a last resort, giving homeowners ample notice and opportunities to correct violations before conducting abatement. Abatement activities can result in large costs for homeowners—sometimes reaching thousands or as much as low tens of thousands of dollars to cover the cost of contractors to conduct the work as well as agency administrative fees.
Findings
In this section, we discuss the findings from our review of the effectiveness of state and local defensible space efforts, which we summarize in Figure 9. We find that compliance rates vary across the state and improving compliance in areas with low rates is a worthwhile state goal. However, we find that various complications impede state and local efforts to improve defensible space compliance, such as the fragmented and overlapping responsibilities of the agencies involved, a lack of consistent statewide data, various other barriers to state and local agency efforts, and a lack of information on the cost‑effectiveness of strategies to increase compliance with defensible space. The state has recently initiated various activities to explore how to best address some of these complications, and we find that there are other promising efforts that the state is not currently undertaking but which have the potential to improve the state’s approach to improving defensible space compliance.
Figure 9
Summary of Key Findings
|
|
|
|
|
|
|
Reported Compliance Rates Generally High, but Vary Widely
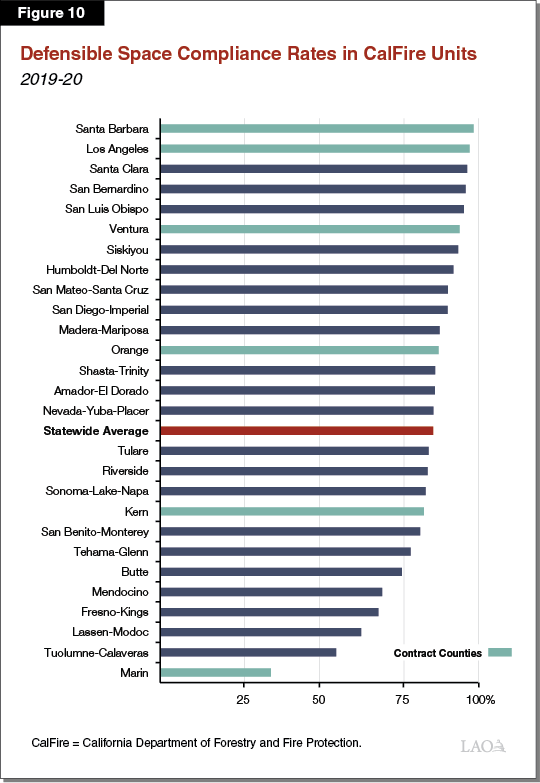
Many communities report relatively high compliance rates. CalFire data show that 86 percent of their inspections in 2019‑20 resulted in a finding of compliance with defensible space requirements. Similarly, the 39 local agencies that provided data on compliance reported an average compliance rate of 76 percent.
While overall compliance rates appear to be relatively high, there is significant variation by location. As shown in Figure 10, compliance rates at CalFire units (including contract counties) ranged from a high of 98 percent (Santa Barbara) to a low of 35 percent (Marin). Similar variation existed among the local agencies reporting in our survey. Specifically, 21 percent of reporting agencies had compliance rates below 25 percent, while 38 percent had compliance rates above 75 percent. In the box below, we discuss some issues related to why measuring compliance rates is a valuable, though imperfect, measure of wildfire risk reduction, as well as why there is no clear optimal compliance rate that the state should target.
Why Focus on Compliance Rates?
Relying on Compliance Rates Is Imperfect but Best Proxy for Risk Reduction. The ultimate goal of maintaining defensible space is to prevent individual homes from being lost due to wildfires, thereby reducing the risk of greater wildfire spread, damage to property and infrastructure, and loss of life. In practice, however, it is difficult to directly measure the effectiveness of defensible space (and programs designed to increase adoption of defensible space practices) at reducing risk and structure loss. In part, this is because researchers can only observe the degree to which defensible space reduced losses in populated areas that actually experience wildfires—and only if information on defensible space adoption is even available. However, when large wildfires do not occur, it is not possible to evaluate how well defensible space practices and programs worked. For this reason, we find that it makes sense to use a proxy. In this case, available information suggests that compliance rates with defensible space requirements are correlated with home ignition risk from nearby vegetation, and thus can serve as a reasonable proxy.
No Clear Optimal Compliance Rate. It is reasonable to ask what level of compliance the state should target. However, based on our conversation with researchers and fire officials, there is no clear “right” level of defensible space. In general, the greater a wildfire‑exposed community’s compliance rate, the better the protection from wildfire risk. Thus, if risk reduction were the only consideration, it would make sense to target perfect compliance. In practice, however, risk reduction is not the only consideration. In particular, achieving compliance can be costly for various parties, including the homeowners who are responsible for modifying their properties and the state and local agencies charged with conducting programs to promote and verify compliance. It is important for the Legislature to weigh these costs against the benefits when determining what level of compliance it determines to be adequate.
Adequate Defensible Space Compliance Rate Might Vary Across State. The benefits of defensible space—both to individuals and the broader community—and cost of achieving compliance can vary by location. For example, when homes are close together, an individual homeowner’s decision to maintain defensible space is more likely to affect the neighboring homes than when homes are far apart. Additionally, the risk‑reduction benefits of defensible space are likely to be greater for homes in areas at highest risk of wildfire, for example, due to topography or the condition of nearby forests. Also, the amount of work necessary to maintain defensible space—and the associated costs to homeowners—can vary by location depending, for example, on the type and density of vegetation. Accordingly, determining what is an adequate level of defensible space compliance can vary across the state and even within regions.
Fragmented and Overlapping Responsibilities Complicate Efforts to Improve Compliance
Multiple entities are responsible for defensible space in California. In addition to CalFire, there are hundreds of local agencies and community organizations with responsibilities for inspections and other defensible space programs. As we discuss below, this can lead to potential gaps and overlap in programs and, absent consistent coordination, potential duplication.
Fragmented Responsibilities Among Multiple Agencies Could Contribute to Gaps in Programs. The number of entities involved in defensible space—many of which have limited resources—likely contributes to gaps in programs, such as inspection and homeowner assistance. For example, our interviews and survey revealed that some parts of the state are not subject to regular inspections. Some properties in LRAs do not receive regular inspections because the relevant local agency has not dedicated resources to establish a defensible space inspection program of properties in VHFHSZs. As discussed earlier in this report, some areas of the SRA do not appear to receive regular inspections from CalFire based on recent inspection data. In addition, in many cases, local agencies do not regularly inspect properties within their jurisdiction if they are in the SRA. Based on our conversations with stakeholders, reasons why local agencies might not conduct these inspections include that they (1) consider the SRA to be primarily CalFire’s responsibility, (2) lack adequate resources, or (3) have not coordinated adequately with CalFire to identify and target gaps in inspections. Given the inconsistency of many state and local inspection programs, it is very likely that there are many areas of the state where properties are not regularly—or ever—checked for compliance with existing defensible space laws and regulations.
It is also worth noting that there are gaps in the availability of homeowner assistance programs. For example, fewer than half of the agencies that provided information on their programs identified having any homeowner assistance programs. (As we discuss in the next section of the report, we do not know the size of the gaps in inspection or homeowner assistance programs due to the lack of consistent statewide data.)
Overlapping Responsibility Could Lead to Ineffective Resource Allocation Absent Robust Coordination. While some local agencies do not conduct inspections in the SRA, other local agencies do. Based on our interviews, two reasons local agencies conduct inspections in the SRA are (1) a view that the number of inspections done by CalFire is insufficient and (2) a desire to apply the local agency’s more robust regulations. (CalFire generally inspects to state regulatory standards, even if the local regulatory standards in that area are more stringent.) Having multiple agencies conducting inspections in an area might not be problematic when there is sufficient inspection workload to occupy multiple agencies and the agencies are coordinating their efforts. In our conversations, we heard about a few areas where CalFire is coordinating closely with local agencies, but it appears that in most areas there is only limited and informal coordination between state and local agencies. To the extent that CalFire and local agencies do not coordinate adequately, inspections could be poorly targeted or duplicative. Some properties might receive more frequent inspections than others for reasons unrelated to their underlying risks. For example, we have learned of a few instances in which CalFire and local agencies conducted inspections in the same areas within a short time frame. Clearly, such duplication is an inefficient use of scarce inspection resources, and it can create other problems as well. For example, if CalFire and local agencies conduct inspections to different standards, duplicative inspections could yield confusing results for homeowners, potentially undermining the educational aspect of inspections.
Lack of Consistent Statewide Data and Inspection Standards Hinders Efforts to Improve Compliance
With so many entities involved in defensible space, it is important for state and local agencies and policymakers to have programmatic information and outcome data to effectively facilitate coordination, target limited resources, and make policy decisions regarding how to improve compliance. Currently, however, there is not consistent data collection, sharing, or reporting across the many state and local agencies involved in defensible space programs.
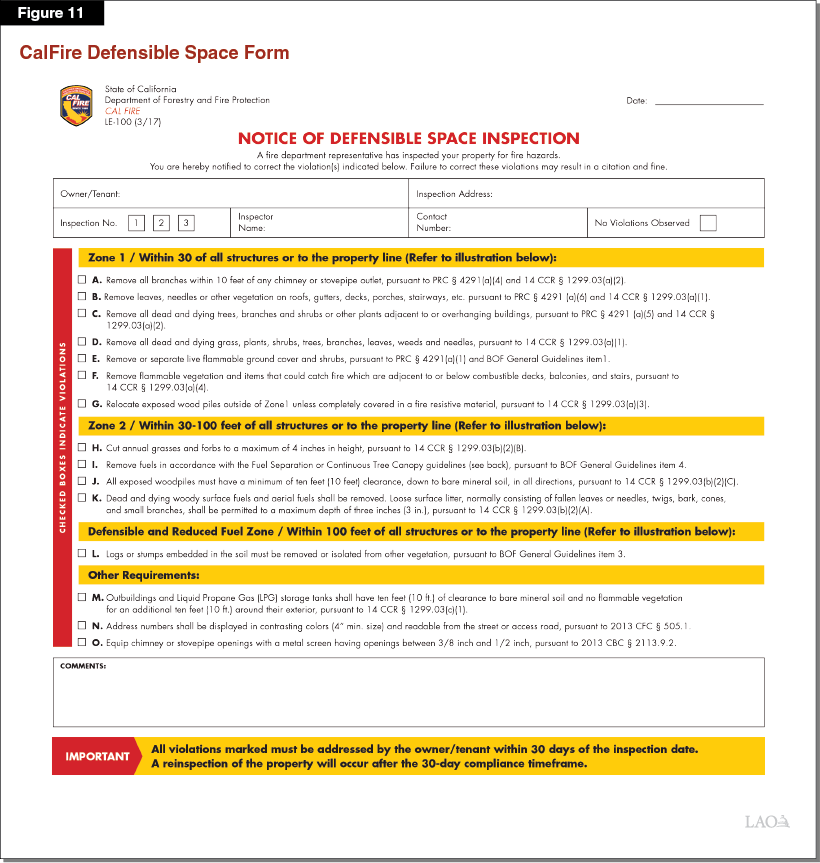
State and Local Agencies Use Various Programs to Collect Inspection Data. CalFire and many local agencies collect information on inspections and compliance, but they do not regularly share this information with each other. Specifically, CalFire inspectors input data from their inspections into tablets using an application that CalFire calls its “collector app.” This application includes a map showing parcel boundaries. Inspectors can click on the relevant parcel to see some basic information on each property (such as a structure’s age). As inspectors complete their inspections, they mark in the application whether properties are compliant with the various requirements for defensible space under state law. If inspectors find a property to be noncompliant, they typically attach pictures of the relevant violations. Inspectors can also enter notes into the application about conditions on the property that may not be violations, but could increase wildfire risks (such as lack of home hardening). When the inspection is complete, inspectors leave a handwritten paper form, shown in Figure 11, with the inspection findings.
Based on our interviews with local agencies, we found that many collect data on the inspections they perform; however, the format of that data varies. Some agencies reported that they use CalFire’s collector app. Other agencies reported using other applications to collect data on their inspections. In some cases, local agencies indicated that these other applications offer additional features, such as more baseline information on properties (such as about ownership) or more robust internal and external reporting. For example, Marin County recently launched a new application that allows owners of inspected homes to review pictures and descriptions of violations of the relevant defensible space ordinance, as well as other recommended defensible space and home hardening improvements that go beyond the regulatory requirements. Additionally, several cities, including Los Angeles, use an application that provides additional reporting and case management functionality.
Agencies Generally Do Not Share Data, Contributing to Duplication and Overlap. Currently, while various state and local agencies use CalFire’s collector app, they do not share inspection information consistently. For example, our interviews indicate that local agencies that use CalFire’s collector app cannot always view CalFire’s inspection information. Among users of other applications, data sharing is rare. In addition, some of the applications that local agencies use are not designed to provide data to CalFire. Our discussions suggest that it likely would not be difficult to export data from these other systems into CalFire’s current collector app system. However, CalFire currently does not collect these data, and there currently is no requirement that this data sharing occur. Without data sharing, entities do not have access to information on which properties other entities have inspected or the level of compliance of properties that have been inspected. Consequently, it is more difficult for agencies to coordinate in order to avoid duplicating efforts or to better target gaps where inspections are not occurring, including in potentially high‑priority areas.
No Consistent Statewide Data Collection or Reporting on Defensible Space Activities. There is no comprehensive statewide data on defensible space activities—such as inspections and compliance—reported for both state and local inspection programs. CalFire reports summary data on its inspections by unit based on data collected by its inspectors (including in contract counties). There is, however, no centralized collection or reporting of activities undertaken in the LRA or by other local agencies in the SRA.
In addition, even where state and local agencies collect data, the data reported on inspection and compliance rates may not be comparable for a few reasons:
- Different Reporting Approaches. As mentioned previously, CalFire’s reports only include the number of inspections done, not the number of unique parcels that are inspected. Other agencies might track the share of unique parcels inspected, making it impossible to directly compare CalFire’s inspection rate to the inspection rate of those agencies.
- Different Compliance Standards. Some local agencies are inspecting to different regulatory standards than the state standard because, as allowed by law, they have adopted more stringent local ordinances. Consequently, what activities are deemed compliant can vary across localities.
- Different Inspection Practices. Agencies take different approaches to inspections, with some more thorough than others. For example, some agencies drive by properties to verify compliance, while others perform more thorough inspections that include walking the property with the homeowner. More thorough inspections might be more likely to identify areas of noncompliance because some violations might not be readily apparent from the street. For example, one local agency reported to us that it inspected in the same area as CalFire and found significantly lower compliance than CalFire did, suggesting that some difference in reported compliance rates could be due to differences in inspections rather than differences in underlying conditions.
- Different Levels of Training. CalFire reported to us that while it provides training to its defensible space inspectors, it currently does not have a standardized curriculum for such training. Local agencies reported wide variation in the amount of training provided to inspectors—with some providing minimal training and others providing 40 hours or more. Given the inconsistent training provided, some inspectors might not have a high level of expertise—informed by the best available science—to guide them, resulting in variation in inspection outcomes. Notably, CalFire reports that it currently is in the process of creating a training curriculum—which will cover inspections for defensible space and home hardening—as part of its implementation of Chapter 404 of 2019 (SB 190, Dodd). CalFire also reports that it plans to offer the resulting training to staff of local agencies and others, such as building officials. Although the details of this training are not yet available, we think it has the potential to help improve the consistency and quality of inspections and the resulting data collected.
Inconsistent Data Collection and Reporting Hinder Policymaking and Oversight. Without consistent, reliable statewide data on inspections, compliance, and programs being reported on an ongoing basis, it is difficult to for policymakers to make changes to improve compliance, target resources efficiently, and conduct oversight. Consistent statewide data could be particularly valuable in at least three areas related to defensible space:
- Identifying Inspection Gaps and Overlap. Having consistent data on which areas do and do not have inspection programs could be important in at least a couple of ways. First, it would allow state and local agencies to more efficiently target their existing resources to gaps in high‑priority areas, as well as to ensure that duplication is not occurring. Second, the information could help inform policymakers about the overall magnitude and location of program gaps, which could inform state and local policymakers’ decisions regarding whether and where to invest additional resources for inspections. Third, the availability of data on state and local inspection programs would enhance oversight, allowing elected officials and the public greater information on the extent to which agencies are enforcing defensible space laws and regulations in different communities.
- Understanding Scope of Problem of Lack of Compliance. Consistent data on noncompliance across the state would provide policymakers better information than is currently available on the extent of the problem in various parts of the state. In turn, this could inform how to best target policy interventions. For example, to the extent that low compliance rates are a much more significant problem in certain parts of the state than in others, the Legislature could consider focusing a greater share of future budget appropriations to those areas. Similarly, CalFire could be directed to direct a greater share of its inspection resources or grant funding to those areas with the largest compliance deficits.
- Assessing Program Effectiveness. Data on compliance rates across communities and over time could be important to understanding of the degree to which different types of defensible space programs increase compliance rates. If, for example, data showed that communities that implement abatement programs tend to have much higher compliance than those that do not, it could provide some suggestive evidence to support the value of abatement programs. Additionally, longitudinal data could be used to compare changes in compliance rates between communities that implement new defensible space programs—such as new homeowner assistance programs—and communities that do not. Such comparisons could provide valuable insights into the effectiveness of these programs.
Other Barriers to State and Local Agencies’ Efforts to Increase Compliance
Below, we discuss various other barriers that state and local agencies face to achieving higher defensible space compliance rates. These barriers include lack of resources, authority, and motivation to implement strong programs.
Efforts to Improve Compliance Can Be Resource‑Intensive. Our survey and interviews suggest that a lack of resources is a barrier to state and local agency efforts to improve defensible space compliance. For example, in our survey, inadequate resources—including funding and staffing—was the most common reason cited by agencies for not administering any defensible space program, cited by about two‑thirds of respondents. Furthermore, lack of funding was the most frequently cited reason for declining to implement changes that would improve compliance, such as issuing more citations or conducting abatement activities. The interviews we conducted with local agencies and CalFire echoed these concerns.
These responses are not surprising given that administering robust programs can be resource‑intensive. Completing thorough inspections requires hiring staff, and the inspections can be time‑consuming, particularly for large properties with multiple structures to inspect and in rural areas where the travel time between inspections can be significant. For example, we estimate that a 30‑minute inspection—roughly the average length cited in our survey—costs about $20. (We discuss the amount of time required for inspections in the nearby box.) While this is not a large per inspection cost, an inspection program in even a moderately sized community can cost hundreds of thousands or millions of dollars annually.
How Long Does an Inspection Take?
The amount of time required to conduct inspections can vary considerably, depending on factors such as the scope of the inspection and the amount of travel time between parcels. On average, local agencies that responded to our survey reported inspections taking more than a half hour each. There was, however, significant variation in the amount of time reported, with some local agencies responding that inspections take over one hour on average. Notably, California Department of Forestry and Fire Protection (CalFire) data show that its inspections take an average of less than 15 minutes to complete, including travel time. According to CalFire, this short inspection time is because it has focused its efforts in areas where homes are close together, which allows inspectors to inspect more homes within a shorter period of time. However, to the extent the department were to expand inspections to other areas that are less densely populated, total inspection times could increase. For reference, CalFire estimates that Chapter 391 of 2019 (AB 38, Wood) inspections will take an average of 1.5 hours each, including travel time, because homes for sale are not likely to be grouped together.
Additionally, other components of defensible space programs—such as homeowner assistance—can be resource‑intensive. For example, some recent state grant‑funded programs provided an average of roughly $1,000 per property to assist homeowners with removing dead and dying trees and vegetation around their homes, and one program offered by a local government provides up to $3,500 per property. Many local communities do not have sufficient funds to offer such services to their residents. While state and federal grants may be available to help support these types of activities, that funding is limited and some smaller and poorer jurisdictions in particular likely struggle to apply for and administer the grants given their limited resources.
Agencies May Lack Authority for Certain Activities. In some cases, a barrier that state and local agencies face is a lack of legal authority to impose administrative fees that could help facilitate enforcement of defensible space regulations. As mentioned previously, CalFire reports that its lack of administrative fee authority is one reason it does not issue many citations. Instead, CalFire must rely on local district attorneys who might not regard citation enforcement as a high priority. Additionally, local agencies have administrative fee authority only if their local governing body has adopted an ordinance granting that authority. Accordingly, this authority is not consistently available statewide.
Agencies Do Not Always Have Strong Incentive to Prioritize Defensible Space Activities. State law does not require state and local agencies to conduct specific defensible space activities, such as community education, homeowner assistance, inspections, and enforcement. Thus, the current system relies upon agencies’ motivation to undertake defensible space activities on a voluntary basis. In some cases, agencies we interviewed reported strong local support for their defensible space programs. In other cases, however, we heard that constituent opposition makes it difficult for some local agencies to secure sufficient local support to run robust programs. In particular, we heard that it can be difficult to secure sufficient support to undertake enforcement programs since many community members do not want to face the prospect of citations or other enforcement actions for failing to comply with defensible space requirements.
Cost‑Effectiveness of Different Strategies Not Well Understood
There are two key challenges with regard to understanding the cost‑effectiveness of defensible space programs. First, there is limited information about the cost‑effectiveness of maintaining defensible space compared to implementing other activities that reduce wildfire risk. Second, the relative cost‑effectiveness of different approaches to improving defensible space compliance is unclear. This lack of information makes it difficult to determine which specific steps, if any, the state or local agencies should undertake to address the barriers identified previously, such as how to best target funding where resources are limited.
Lack of Information on Cost‑Effectiveness of Defensible Space Compared to Other Risk‑Reduction Activities. While there is general agreement that defensible space improves the likelihood that a home will survive a wildfire, there is much less agreement regarding (1) the extent to which maintaining defensible space reduces the risk of losing a home, (2) the extent to which the likelihood that a home will be lost depends on an individual home’s surrounding vegetation and topography, (3) the extent to which expected home losses depend on overall defensible space in the broader community, and (4) the degree to which reductions in property losses offset the costs of implementing and maintaining defensible space. Importantly, limited information on the benefits and costs of defensible space makes it difficult to compare the value of increasing defensible space compliance to other activities that could reduce wildfire disasters, such as home hardening, fuel breaks, or forest health treatments.
The most relevant research on cost‑effectiveness that we found has been done by private firms using proprietary catastrophe risk models. For example, a recent analysis by a data analytics firm estimated that about 850 homes and $1.3 billion in economic losses could be avoided statewide annually in California if properties located in high wildfire risk areas were cleared of vegetation overhanging and within 30 feet of structures. Another recent analysis by a data analytics firm estimated that the financial benefits of conducting vegetation management around homes and home hardening exceeded the costs in some communities but not in others. While these analyses represent preliminary steps towards improved understanding of the cost‑effectiveness of defensible space, they do not fully address the gaps in understanding. Therefore, it remains difficult to determine the overall level of resources that should be devoted to promoting defensible space compliance compared to other activities that reduce wildfire‑related risks.
Lack of Information on Cost‑Effectiveness of Approaches to Improving Defensible Space Compliance. Not only is there limited information about the cost‑effectiveness of homeowners implementing defensible space, there is also a lack of information regarding the cost‑effectiveness of specific activities that promote defensible space compliance. Specifically, we could not find any studies on the relative cost‑effectiveness of various types of programs—such as inspections, enforcement, financial assistance, and in‑kind assistance—aiming to improve compliance with defensible space. For example, there is an absence of credible data on the effectiveness of enforcement, as well as widely divergent perspectives among practitioners about how important enforcement is to improve defensible space compliance. Additionally, while homeowner assistance programs help address resource limitations that are barriers to some homeowners maintaining defensible space, we did not find any studies assessing their cost‑effectiveness at improving compliance or home survivability.
Importantly, a key reason that the state does not have information on the cost‑effectiveness of its defensible space programs is that there is no requirement for administering departments to evaluate their programs’ effectiveness at increasing compliance or reducing risk. For example, although CalFire funds various efforts to support defensible space (such as chipping programs) through its Fire Prevention Grant Program, it has not evaluated the cost‑effectiveness of this program. This lack of information makes it difficult to identify which specific activities should be the focus of future state funding.
Additionally, there is a lack of information on the cost‑effectiveness of different approaches to delivering each type of program. For example, it is unclear how frequently defensible space inspections should occur and whether some types of parcels should be inspected more often than others. CalFire’s current approach, for example, is to try to inspect every property at least once every three years. While this may make sense, it could also potentially make sense to inspect certain properties of highest risk more frequently than those of lower risk.
Cost‑Effectiveness Is Particularly Important Given Potential Costs. Running defensible space programs can be costly, particularly if they are robust. For example, we estimate that a hypothetical program providing annual inspections for all of the roughly 1.5 million properties required to comply with defensible space requirements, as well as $500 per homeowner to 10 percent of these properties, could cost over $100 million per year. Given this potential cost, it is particularly important for state and local agencies to have information on cost‑effectiveness. This information could help guide decisions about how much funding to provide for defensible space compliance, which specific programs to support, and to whom to offer these programs. Moreover, a more complete understanding of cost‑effectiveness could be used to inform homeowners about their risks, more effectively addressing that barrier to implementing defensible space.
Recent Efforts Could Inform Best Path Forward, but Are Still in Initial Stages
The Legislature has recognized many of the challenges we identified previously—including potential gaps in programs, lack of coordination, and lack of information on cost‑effectiveness of programs—and has funded some specific activities to begin to address them. We summarize some of these key activities below, which we expect will provide valuable information about gaps in programs, improving coordination, and exploring innovative and cost‑effective programs.
Efforts to Assess Gaps in Programs and Improve Coordination. The Legislature has taken the following steps to begin to assess the gaps in programs, as well as to improve coordination among entities involved in wildfire mitigation.
- Regional Capacity Assessment. The Legislature recognized the problem of gaps in fire mitigation programs, such as for defensible space, and the importance of ensuring collaboration among entities when it passed Chapter 391. Among other things, Chapter 391 requires the California Natural Resources Agency (CNRA), in consultation with the State Fire Marshal and the Forest Management Task Force, to review the regional capacity of each county that contains VHFHSZs to identify entities engaged in fire prevention efforts, assess capacity deficits, and provide recommendations to improve capacity and collaboration within counties. The Legislature appropriated $250,000 from the General Fund for this review as part of the 2021‑22 budget. At the time of the preparation of this report, this review had not yet begun, and details on the scope were not available. However, we think that this review could potentially provide valuable information about the size and nature of gaps in defensible space programs and promising avenues for improving collaboration to address these gaps and limit potential duplication.
- County Coordinator Program. In further recognition of the value of coordination among entities involved in defensible space and other wildfire mitigation activities, the Legislature provided $6 million from GGRF to CalFire for grants to counties as part of the 2019‑20 budget. CalFire subsequently selected the California Fire Safe Council (Council) to administer this grant program. In June 2021, the Council issued a request for proposals to identify up to 24 counties to receive one‑time grants of $175,000 to be used over an 18‑month period. These funds will help cover administrative costs related to countywide coordination of wildfire mitigation, such as the cost of hiring county coordinators. Among other things, these coordinators are expected to (1) identify all active wildfire mitigation groups and projects; (2) analyze gaps in countywide wildfire resiliency and emergency preparedness; (3) develop recommendations to fill these gaps; and (4) improve outreach and coordination efforts focused on wildfire mitigation. We expect that this effort will help demonstrate whether additional coordination at the county level can help identify and address gaps in programs, ideally encouraging a more strategic approach to defensible space and wildfire mitigation.
Efforts to Pilot Innovative and Cost‑Effective Approaches to Wildfire Mitigation. The Legislature has taken the following steps to begin to pilot innovative approaches to defensible space programs and explore the cost‑effectiveness of efforts to make homes more resilient to wildfires.
- Defensible Space Programs in Three Counties. As part of the 2019‑20 budget, the Legislature gave CNRA $5 million from the General Fund on a one‑time basis to support programs in up to three counties that provide financial assistance to help low‑income, elderly, and disabled residents comply with defensible space requirements. This funding, which is being administered by the Council, is being used to explore different approaches to increasing defensible space compliance in Los Angeles, Butte, and Napa counties. At the time this report was prepared, these programs were at the beginning stages of design and implementation, and it was not clear when results would be available. They could, however, provide some lessons to inform defensible space program implementation in the future.
- Wildfire Mitigation Assistance Pilot Program. The Legislature also initiated another pilot effort to improve the understanding of the cost‑effectiveness of wildfire mitigation efforts, including home hardening and defensible space. Specifically, in 2020‑21, the Legislature provided $25 million on a one‑time basis to the Office of Emergency Services (OES) and CalFire for a pilot required by Chapter 391. This pilot will provide inspections, education, and homeowner‑assistance to homeowners for defensible space and home hardening activities. At the time this report was prepared, many program details were not finalized, such as which communities would be targeted, which homeowners would be eligible, and which specific activities would be funded. However, based on our discussions with OES and CalFire, the program likely will focus on underserved areas of the state and target low‑income homeowners. Notably, as required by Chapter 391, a report assessing the cost‑effectiveness of defensible space and home hardening compared to other activities will be completed by 2024. This pilot program—and the required report—should help inform how much should be spent on defensible space compared to other potential approaches to reducing wildfire disasters.
Other Areas Where Additional Evaluation and Research Could Inform Policy
In addition to the efforts that the Legislature has already funded, some other promising ideas for improving defensible space compliance emerged from our conversations with experts. We describe a few of these promising areas for additional research and evaluation below.
Role of Insurance in Incentivizing Defensible Space Compliance. Over the past few years, insurance companies have experienced large losses related to wildfires in California. In response, companies have been raising premiums and, in a growing number of cases, refusing to renew policies. Homeowners that cannot renew their insurance policies may have to seek insurance that is more expensive and provides less coverage, such as through the FAIR plan. (The California FAIR Plan Association provides basic fire insurance coverage for high‑risk properties that traditional insurance companies will not cover.) Recent insurance affordability and availability trends have spurred growing interest in using insurance to incentivize property‑specific wildfire mitigation activities, such as defensible space. Specifically, homeowners could receive rate reductions or be allowed to renew their existing policies if they can demonstrate that they maintain defensible space. In concept, allowing and encouraging insurance companies to consider specific wildfire mitigations in setting rates could help address the emerging challenges of insurance affordability and availability because homeowners undertaking these efforts could qualify for lower rates and/or have access to more options for insurance coverage than they would otherwise. Additionally, it could also provide important incentives for homeowners to conduct mitigation activities because they would be rewarded with immediate, clear financial incentives that help offset their costs. This idea is particularly attractive because it could motivate homeowners to conduct wildfire mitigations without the need for state or local agencies to conduct enforcement activities.
Boulder County, Colorado is implementing this type of approach as part of a multifaceted program to encourage defensible space, known as Wildfire Partners. Under the Wildfire Partners model, homeowners can request assessments of their properties and receive financial assistance to help offset the costs of addressing findings of noncompliance. Once homeowners address the findings, they receive a certificate. Participating insurers, in turn, agree to renew coverage for homeowners with these certificates. Implementing a model similar to Wildfire Partners in California, however, could be complicated. The state is large, so providing the inspections and homeowner supports similar to those in the Wildfire Partners model would require significant resources. (The Wildfire Partners model relies partially on federal funding, which could be difficult to secure at the scale of California.) Another complicating factor is the state’s insurance regulatory environment, which is guided by rules established by voters through the initiative process, thus complicating potential legislative efforts to make modifications. A third complicating factor is the insurance industry’s recent loss history in the state, which likely makes insurance companies wary of agreeing to new, untested factors that could reduce premiums at a time when many have sought rate increases. Despite these complications, the Wildfire Partners model is conceptually promising, and there might be opportunities to adapt the program model so that it could be piloted in California.
Notably, the Department of Insurance (CDI) has given considerable attention to the issue of insurance availability and affordability in the WUI. As part of this work, CDI released a report in 2018 that provided various recommendations, including that the Legislature require insurers to offer discounts and guarantee renewals to homeowners that conduct certain wildfire mitigation activities. CDI also has expressed support for pursuing a Wildfire Partners‑type approach and, in addition, has proposed demonstration projects to demonstrate the feasibility of insurance models to promote wildfire mitigation.
Role of Technology to Target Resources and Ensure Data Consistency. During the course of our interviews, various experts suggested that the state explore the use of technology—such as high‑quality satellite, drone, or Light Detection and Ranging (LiDAR)—to improve defensible space programs. (LiDAR is a method of remote sensing used to create high‑resolution, three dimensional images of the earth’s surface.) Such technology potentially could be used in a variety of ways to support defensible space programs. For example, it could support inspection programs by more efficiently identifying potentially noncompliant properties within certain communities—such as in high‑risk or rural areas—thereby allowing agencies to better target on‑the‑ground inspection resources.
The technology also could provide more consistent data on compliance rates across the state, which could be valuable in program evaluation and oversight efforts. While the data would not be definitive—because there are limits to what can be assessed from an aerial perspective—it could provide helpful evidence for what is happening in different areas. For example, if detailed satellite or LiDAR data of areas with very high reported compliance rates showed widespread examples of vegetation overhanging roofs and chimneys, it could suggest that the agencies undertaking inspections in that area are not accurately measuring compliance.
Recommendations
Based on our review of state and local efforts and the findings described above, we recommend key steps the state should take to encourage increased homeowner implementation of defensible space to better protect homes and communities from wildfire. This includes (1) gathering more information in key areas through consistent and centralized data collection, (2) taking initial steps to address other barriers to state and local defensible space efforts, (3) supporting additional research efforts to identify effective strategies to improve defensible space compliance, and (4) conducting oversight activities to gain lessons learned and inform longer‑term actions. These recommendations focus on actions the state should take over the next few years. In addition, we anticipate that implementing these recommendations would provide information that would help inform future state and local actions to improve defensible space compliance in the longer term. We summarize our recommendations in Figure 12 and describe them more fully below. Additionally, in the box below, we discuss how a greater focus on home hardening can complement these recommendations.
Figure 12
Summary of Recommendations
|
Improve Data Collection, Sharing, and Quality |
|
|
Take Initial Steps to Address Other Barriers to State and Local Efforts |
|
|
Support Additional Research Efforts to Identify Effective Strategies |
|
|
Conduct Oversight to Gather Lessons Learned and Help Inform Future Decisions |
|
Home Hardening Can Complement Defensible Space Compliance
Home Hardening Also Plays Important Role Reducing Home Ignition. This report has focused on defensible space. However, home hardening also plays an important role in preventing home ignitions. Even when defensible space is properly maintained, it is possible for wildfires to find the weakest part of the home. In particular, embers can penetrate unscreened vents, cracks, and other vulnerable parts of homes and start structure fires. Accordingly, experts emphasize the importance of combining defensible space with home hardening to provide maximum protection.
Home Hardening Has Not Been Main Focus of Most State and Local Efforts. While home hardening is important to protecting homes from wildfires, state and local laws do not require it for existing homes. Additionally, home hardening has not traditionally been the main focus of state grant or many inspection programs. For example, the California Department of Forestry and Fire Protection’s (CalFire’s) Fire Prevention Grant Program has supported local defensible space and other vegetation management activities but not home hardening. (Notably, the Legislature recently established the Wildfire Mitigation Pilot Program, which will encourage home hardening and defensible space practices once implemented.) Additionally, CalFire’s defensible space inspectors currently do not consistently receive training on home hardening, nor is a full review of home hardening included as part of a standard defensible space inspection. Also, based on the discussions we had with various agencies and our survey data, it appears that, while many local agencies might incorporate some aspects of home hardening review into their defensible space programs, it is generally a lesser focus compared to defensible space.
Natural Opportunities to Integrate Home Hardening Into Defensible Space Efforts. In some ways, home hardening could fit naturally into defensible space programs. Defensible space training programs could incorporate curricula on inspecting for home hardening risks. For example, CalFire is developing a training program that is anticipated to cover home hardening. Additionally, defensible space inspectors could conduct a formal evaluation of home hardening at the same time they are reviewing a property for defensible space. The state could structure grant programs to target both defensible space and home hardening, rather than limiting the grants to defensible space. Although taking such steps would require additional resources, the marginal additional costs are likely to be modest if incorporated into existing programs, and the benefits to homeowners and communities from reduced wildfire risk could be significant if these practices were more widely adopted.
Improve Data Collection, Sharing, and Quality
One of the fundamental obstacles to improving defensible space compliance is a lack of comparable statewide data, which complicates coordination, hinders program evaluation, and limits oversight. So, a key first step is addressing this lack of information. We recommend some ways to do so below.
Increase State Support for Shared Collector App for Data Collection and Sharing. Currently, CalFire’s collector app is a useful tool for CalFire and a number of local agencies. However, some local agencies do not use it because it does not meet their specific needs or because it lacks functionality that the agencies would find beneficial. We recommend that the Legislature provide funding to support additional enhancements to the current collector app (or the replacement of the current app with another application with additional flexibility), as well as resources to better enable CalFire to assist local agencies that would like to use the application. These resources could be modest, potentially in the low millions of dollars on a one‑time basis and hundreds of thousands of dollars on an ongoing basis, to support a couple additional CalFire staff and technology development. Ensuring the availability of a common data collection app that meets the needs of local agencies at minimal additional cost to them will make it more likely that those agencies collect and are able to share important information on their defensible space inspections. This, in turn, will help address the challenge of coordinating inspections given overlapping jurisdictions, as well as address other information‑related challenges.
(We note that at the time this report was prepared, the Legislature had passed SB 63 [Stern], which includes some provisions that are similar to this recommendation for improved data collection. Specifically, among other things, this bill requires CalFire to establish a common platform for reporting defensible space and home hardening assessment data. The bill also requires CalFire to compile the data submitted.)
Ensure State and Local Agencies Feed Data Into Centralized System, Using Consistent Definitions. Regardless of whether local agencies use the collector app, it would be valuable for them to input information from their inspections into a centralized data system. Without this data sharing, it is difficult for agencies to coordinate and direct limited resources in a strategic way. The Legislature could, for example, pass a law requiring CalFire and local agencies to provide information into a centralized system. It is difficult to know the precise costs of such a requirement, but it probably would be modest—potentially a few million dollars annually statewide—particularly if local agencies have access to the state’s collector app. Alternatively, if the Legislature wanted to avoid adopting a reimbursable state mandate, the state could make inputting data into a centralized database voluntary, but also incentivize participation in the system by conditioning future grant funding on providing this information.
Notably, it would be important for agencies to use common definitions of key terms, such as what constitutes an inspection and a citation, and what is considered compliant for reporting purposes. (This would not preclude local jurisdictions from continuing to have their own regulatory requirements for defensible space.) Establishment of common definitions would better standardize inspection information, thereby ensuring greater consistency and reliability of the data reported. The Legislature could direct BFFP to develop these common definitions.
Require Inspection and Compliance Data to Be Publicly Reported and Shared With Researchers. We recommend that the Legislature require CalFire to compile data from state and local agencies and to publicly report it on at least an annual basis. The data should include information on the share of unique parcels that were inspected, what enforcement actions were taken, and the share of parcels that were found to be in compliance across jurisdictions. These data would help program administrators, researchers, and policymakers assess the extent to which gaps or overlap in inspection programs is occurring, the level of noncompliance with defensible space laws, as well as the effectiveness of different state and local efforts to increase compliance. State and local policymakers then could develop well‑informed plans for addressing identified problem areas.
Notably, in addition to the high‑level data provided to the public, we recommend that the Legislature require CalFire to make more granular inspection data available to researchers. For example, inspection data could be helpful to researchers as they attempt to better understand the effectiveness of different defensible space practices at reducing home losses. Additionally, these data could enable researchers to better assess the effectiveness of various programs designed to increase compliance rates by comparing compliance rates in communities that implement defensible space programs to compliance rates in other communities.
Take Initial Steps to Address Other Barriers to State and Local Efforts
We have identified some initial steps to address the barriers of lack of resources, authority, and motivation that agencies face. Specifically, we recommend that the Legislature (1) provide additional resources for CalFire defensible space inspectors, (2) provide CalFire with authority to administer fines for noncompliance, and (3) conduct oversight of existing state and local defensible space programs.
Increase Ongoing Resources for CalFire Inspections and Require Staffing Plan. We recommend that the Legislature provide an ongoing, dedicated augmentation to CalFire to meet its goal of providing inspections of every property at least once every three years. While there is uncertainty regarding the optimal frequency of inspections to improve compliance—and how that could vary by community and parcel—ensuring that the department can meet a baseline number of inspections each year is important. Inspections play a valuable foundational role in defensible space programs and can help the state track and evaluate its efforts to promote defensible space compliance. Additionally, they can help to educate homeowners. One inspection every three years likely is a reasonable frequency necessary to serve these purposes, so providing this level of ongoing resources is reasonable. Based on the amount of funding requested by CalFire on a one‑time basis to temporarily meet its goal for defensible space inspections, we estimate that the cost of this ongoing staffing could cost about $6 million annually. It will be important, however, for CalFire to justify the specific amount of funding required to meet its goal of inspecting every property at least once every three years.
Additionally, given the wide variation in inspection rates across the state, it will be important for CalFire to show how it plans to distribute any additional staffing in a way that will enable it to consistently meet the inspection rate goal in all units across the state. Accordingly, we recommend that any additional funding be predicated on CalFire providing a staffing plan showing how it intends to allocate the additional staff across units based on factors such as geography and the number of parcels subject to inspection in order to meet its inspection goal.
The recommendations in this report focus on actions the state can take to improve defensible space practices. For this reason—and because providing defensible space inspections and other fire prevention programs in the LRA are fundamentally local responsibilities—we do not broadly recommend increased funding for local defensible space efforts across the state. However, given the statewide impacts of wildfires, we acknowledge that state funding for local activities can be warranted in some cases. In the nearby box, we discuss some potential considerations for the Legislature to keep in mind as it considers whether to provide local agencies with additional funding in the future.
What Costs Should the State Bear?
Our recommendations focus on state activities with relatively modest costs. However, there are some areas where the additional information gathered through data collection and research efforts could justify additional actions to improve defensible space compliance in the future. Should that be the case, there may be a question about which entities should fund those actions. When considering that question, it is important to recognize that many entities benefit from defensible space. This includes homeowners who help protect their homes when they maintain defensible space. This also includes governments, since defensible space mitigates the destructiveness of wildfires to communities, thus reducing response and recovery costs. Given that the benefits of defensible space are spread among multiple entities, it makes sense for the costs to be shared as well. Decisions on how to allocate these costs across the different entities that would benefit can involve trade‑offs, for example, related to the ability to bear costs and effectively implement changes. Key considerations for assigning costs could include such things as:
- Ability of Homeowners to Afford Costs. On the one hand, maintenance of defensible space is a homeowner responsibility that the state generally has not funded. Accordingly, homeowners generally should bear the costs of compliance. On the other hand, some homeowners are unable to afford the costs of implementing and maintaining defensible space. In such cases, it may make sense for governments to provide in‑kind or financial assistance to homeowners that cannot afford to undertake defensible space efforts themselves.
- Jurisdictional Responsibility. When thinking about how to assign costs across governmental jurisdictions, it is important to align financial impacts—both costs and revenues—with the legal authority of the jurisdictions that affect change. Typically, the state has responsibility for fire prevention activities—including those related to defensible space—in the State Responsibility Area (SRA). Locals, in turn, generally are responsible for fire prevention activities in the Local Responsibility Areas. Thus, in general, absent a strong rationale otherwise, it makes sense for the state to focus its resources in the SRA, while local governments should be responsible for program costs in the LRA.
- Community’s Fiscal Capacity and Wildfire Risk Level. As noted in this report, some local agencies have few resources to devote to fire prevention activities, such as those related to defensible space. In some cases, agencies may be able to secure additional resources, such as through new charges. However, in other cases, such as when communities are very low income, it may not be feasible for local agencies to raise the funds necessary to implement robust defensible space programs themselves. In these cases, it could make sense for the state to provide some targeted grants or other financial support to assist these local agencies, particularly when they are at very high risk of severe wildfires and have low compliance rates. This could be informed by what the state learns over time about the scale of gaps in defensible space programs.
- Type of Activity. There are some types of activities that it makes sense for the state to undertake, rather than relying on local agencies. For instance, this includes activities that are accomplished much more efficiently at a large scale (such as the development of training or educational materials) and those that require statewide coordination. It also includes research and demonstration projects that provide broad benefits to the state through filling key gaps in knowledge.
Provide CalFire With Administrative Fine Authority. We recommend that the Legislature provide CalFire with legal authority to fine property owners that do not maintain defensible space in accordance with state law and regulations. This authority would mean that CalFire would no longer have to rely on local district attorneys to enforce its administrative citations. This statutory change would address one of the main barriers that CalFire has identified to taking enforcement actions. In so doing, it would allow the department to more easily take enforcement actions when it deems it appropriate to increase compliance, such as when homeowners refuse to implement defensible space improvements even after multiple findings of noncompliance. At this time, we were not able to verify the extent to which a lack of local authority is a barrier to enforcement for communities that are motivated to undertake it, and thus whether statutory changes are needed to local agency authority.
Conduct Ongoing Oversight of Defensible Space Compliance to Increase Motivation. We also recommend that the Legislature conduct oversight hearings focused on why compliance rates vary across the state. (This oversight could be combined with additional oversight efforts we recommend later in this report.) As part of this oversight effort, we recommend that the Legislature require CalFire to report on how it plans to improve compliance in the SRA, particularly in the areas with low reported compliance rates. Once CalFire begins collecting data on local agency compliance rates, we recommend the Legislature conduct oversight hearings that examine compliance in the LRA as well. These hearings would help the Legislature gather additional information on the drivers of variation in reported compliance rates across the state (including distinguishing between differences in measurement and actual differences in compliance). These hearings could play an important role in drawing attention to areas in the state with low levels of compliance. Importantly, this additional transparency on the risks to different communities could motivate local agencies to take actions to further improve compliance.
Support Additional Research Efforts to Identify Effective Strategies
While we think the pilots that have been funded by the Legislature to date will likely provide valuable information, we do not expect them to address all of the key outstanding questions related to defensible space. Accordingly, we recommend that the state use future funding to continue to fill other gaps in knowledge, as discussed below.
Require Data Collection and Evaluation as a Condition of Future Funding. Currently, the state provides grants for local defensible space activities—such as homeowner assistance and education—but does not evaluate them. We recommend that the Legislature require CalFire to include program evaluation as part of future defensible space grants. Under such a requirement, recipients of state‑funded grants related to defensible space would need to provide specified data, such as compliance rates before and after the implementation of grants. Requiring program evaluation could add some additional costs to grant programs, but those costs are likely to be relatively modest. Moreover, we think the potential long‑term benefits this information could provide to inform future policy, budget, and programmatic decisions—such as related to program design—would likely outweigh these potential costs.
Fund Additional Demonstration Projects Focused on Filling Knowledge Gaps. As discussed in the “Findings” section, some promising areas of research to explore include expanding the roles of insurance and technology in increasing compliance. For example, the Legislature could collaborate with CDI to develop and fund demonstration projects that could demonstrate the feasibility of linking insurance rate reductions and/or renewals to specific wildfire mitigations, potentially similar to the Wildfire Partners program. Additionally, the state could fund demonstration projects exploring the use of satellite and/or LiDAR technology to help CalFire increase the number of inspections in more remote areas, more strategically target inspections in those areas with higher risks of wildfire damage, and identify noncompliant properties. The cost to undertake each of these demonstration projects would depend heavily on the specifics of how many were undertaken and how they were structured, but could be in the millions to tens of millions of dollars.
While these are specific areas of research that we have identified, other areas could merit exploration, as well. Importantly, we recommend that program evaluation be included in any pilot efforts the Legislature funds in the future. To ensure that pilots provide meaningful results, we recommend that the Legislature require the administration to consult with external researchers to help develop research strategies and protocols at the outset, so that programs are designed with evaluation in mind. Additionally, we recommend that the Legislature fund demonstration projects that have the potential to yield cost‑effective approaches that can be adapted in other locations across the state. A solution that works in one part of the state might not work another, so in some cases it may make sense to pilot approaches in at least a few different places so that results are more generalizable.
Conduct Oversight to Gather Lessons Learned and Inform Future Decisions
We also recommend that the Legislature use oversight hearings to gather lessons learned from the state’s various information gathering activities (such as its data collection and demonstration projects) once they are completed. Importantly, we think that given the high financial and personal costs associated with wildfire disasters in California, the Legislature should conduct ongoing oversight over the coming years to ensure that state and local agencies are making improvements and that the lessons learned from various efforts are shared beyond local jurisdictional boundaries. Ultimately, the information gathered through these ongoing hearings could be used to help inform future legislative policy and budget decisions.
Specifically, we recommend that the Legislature conduct oversight hearings with an eye towards gathering information on the following:
- Size and Location of Gaps and Overlap in Defensible Space Programs. Oversight should include a review of information gathered on the size and location of gaps and overlap in inspection and other programs. This information could come from sources such as the existing statewide inspection and compliance data gathered by CalFire, additional inspection data collected via our recommended centralized data collections system, and the results of recently funded projects (including the Regional Capacity Assessment and the county coordinator program). The Legislature could use the results of this oversight to inform future decisions to close gaps and increase coordination. For instance, if the county coordinator program proves to be successful, the Legislature could consider supporting county‑based collaborative efforts on an ongoing basis.
- Development and Implementation of CalFire’s Training Program. Upon its completion, oversight could also include a review of the training program that CalFire is developing. This oversight could help ensure that the Legislature can be confident the training program that is ultimately offered by CalFire is robust and widely available enough to ensure that state and local defensible space inspectors can access adequate training.
- Relative Cost‑Effectiveness of Defensible Space Compared to Other Activities. Oversight could include a review of information on the cost‑effectiveness of defensible space compared to other activities aimed at mitigating the destructiveness of wildfires. For example, the Legislature could use oversight hearings to review the results of the Wildfire Mitigation Assistance Pilot Program. This information could help inform legislative decision‑making regarding how much should be spent by state and local agencies on defensible space compared to other potential approaches to reducing the damage from wildfires.
- Lessons Learned About Crafting Defensible Space Programs. Oversight could also include the review of information gathered about how to best structure various defensible space programs to ensure they are working effectively and are cost‑effective. For example, the Legislature could use oversight hearings to review the results and lessons learned from the three county efforts already funded, as well as any other demonstration projects undertaken to fill knowledge gaps and to inform whether the state should take steps to expand the activities statewide on an ongoing basis. For example, if specific homeowner assistance programs are found to reduce wildfire losses very cost‑effectively, then future state and federal funding could be better targeted to support those types of programs versus programs that are not evidence‑based.
Funding Options for Implementing Recommendations
As discussed above, some of our recommendations would likely would result in additional costs. Below, we summarize some of the main state and federal funding sources the Legislature could use to support the expansion of defensible space programs and improve compliance. Additionally, as discussed previously, local agencies also have an important role in supporting defensible space activities.
Existing State Funding Sources Being Used for Defensible Space Efforts. GGRF and the General Fund are the two main sources of funding that the Legislature has used to support defensible space and related activities in the past and that are available to support future activities. If the Legislature would like to support additional activities to make homes more resilient to wildfire, it could increase the funding level provided from these sources or redirect some existing funding already used for similar purposes.
- Greenhouse Gas Reduction Fund. In recent years, the budget has included roughly $200 million a year from GGRF for CalFire wildfire mitigation programs, consistent with legislative intent specified in Chapter 626 of 2018 (SB 901, Dodd). Additionally, the 2021‑22 budget package included language continuously appropriating $200 million annually for these programs from 2022‑23 through 2028‑29. (For context, annual GGRF revenues are generally between $2 billion and $3 billion.) To date, the Legislature has given CalFire significant flexibility over the use of these funds, and CalFire has allocated some of them towards defensible space. If, however, this issue is a priority for the Legislature, it could require CalFire to dedicate a greater share of this allocation to defensible space activities or increase CalFire’s allocation of GGRF funds to support these activities.
- General Fund. The Legislature has also provided General Fund support for defensible space‑related activities, such as the implementation of defensible space inspections pursuant to Chapter 391. Also, in 2021‑22, the Legislature approved $100 million for OES to support community resilience to various hazards, including wildfires. Among other things, this funding could be used to support local governments’ cost share to participate in federal grant programs that support defensible space or other activities to mitigate the destructiveness of wildfires.
Various Federal Funding Sources Could Be Used for Defensible Space. The state has access to two main federal funding sources for wildfire mitigation activities. There are some restrictions on this funding, including that projects must show that the projected benefits exceed the implementation costs according to a methodology established by the federal government. Additionally, state or local governments typically must provide a cost share of 25 percent of the project costs. OES serves a key role in allocating and applying for these federal funds. The Legislature historically has deferred to OES on the allocation of these funds. However, if defensible space is a priority for the Legislature, it could direct OES to prioritize defensible space projects in these programs to a greater degree.
- Building Resilient Infrastructure and Communities (BRIC) Program. The federal BRIC program—previously known as the Pre‑Disaster Mitigation Program—is a competitive grant program. In 2020, $500 million was available nationwide for projects that mitigate disaster risks and build resiliency. Through OES, California submitted project proposals totaling $369 million, about 12 percent ($43 million) of which was for wildfire‑related projects. In September 2021, the Federal Emergency Management Agency (FEMA) announced that of the proposals submitted by California, $95 million were selected for competitive funding, including $37 million for a Sonoma County project that includes structural hardening, defensible space, and vegetation management.
- Hazard Mitigation Grant Program (HMGP). After a state experiences a large disaster that receives a Presidential Major Disaster Declaration, FEMA provides funding for activities intended to lessen the impacts of future disasters through HMGP. The amount of the grant is up to 20 percent of the total federal disaster assistance provided in the relevant disaster. Upon receipt of funds, states have the primary responsibility for prioritizing, selecting, and administering state and local hazard mitigation projects. Since 2017, California has received roughly $800 million in HMGP funding, mostly related to recent wildfire disasters. OES has recommended this funding be provided to more than 400 projects across the state aimed at mitigating risk from flood, fire, earthquake, and other hazards. Additionally, the state is expecting to receive another $200 million in HMGP funds as a result of the 2020 wildfires. In recent years, roughly 20 percent of HMGP funds have been provided to wildfire‑related projects, including several defensible space projects.
Conclusion
The state faces large and growing risks of potentially devastating wildfire disasters. One key step towards mitigating the risk of these disasters is to make homes less likely to ignite through defensible space practices. Current state and local efforts are complicated by the fragmented and overlapping nature of responsibilities, lack of consistent statewide data, various other barriers to state and local agency efforts, and a lack research in important areas to guide policymakers. In this report, we identify several steps the Legislature could take to improve defensible space programs and support higher rates of homeowner compliance with defensible space requirements. In sum, we find that the following actions could help move the state towards greater resiliency and reduce future losses: (1) gathering more information on defensible space inspections and compliance through improved data collection, (2) taking initial steps to address other barriers to state and local defensible space efforts, (3) supporting additional research efforts to identify effective strategies to improve defensible space compliance, and (4) conducting oversight activities to gain lessons learned and inform future policy decisions.
Appendix: Selected References
Arrowsmith, E., Fortier, F. D., & Cope, A. D. (2021) “Wildfire Fuel Management and Risk Reduction: Where to Start?” Insurance Institute for Business & Home Safety and Zesty.ai.
Calkin, D. E., Cohen, J. D., Finney, M. A., & Thompson, M. P. (2014). “How Risk Management Can Prevent Future Wildfire Disasters in the Wildland‑Urban Interface.” Proceedings of the National Academy of Sciences, 111(2), 746‑751.
Caton, S. E., Hakes, R. S., Gorham, D. J., Zhou, A., & Gollner, M. J. (2017). “Review of Pathways for Building Fire Spread in the Wildland Urban Interface Part I: Exposure Conditions.” Fire Technology, 53(2), 429‑473.
Cignarale, T., Laucher, J., Allen, K., Landsman‑Smith, L. (2018). “The Availability and Affordability of Coverage for Wildfire Loss in Residential Property Insurance in the Wildland‑Urban Interface and Other High‑Risk Areas of California: CDI Summary and Proposed Solutions.” California Department of Insurance.
Czajkowski, J., Russo, E., Brandenburg, A., Groshong, L., Young, M., Nielsen, M., Cope, A., & Giammanco, I. (2020). “Application of Wildfire Mitigation to Insured Property Exposure.” National Association of Insurance Commissioners’ Center for Insurance Policy Research, Risk Management Solutions, Inc., and the Insurance Institute for Business and Home Safety.
Duerksen, C., Elliott, D., & Anthony, P. (2011). “Addressing Community Wildfire Risk: A Review and Assessment of Regulatory and Planning Tools.” NFPA Fire Protection Research Foundation Report.
Feo, T. & Evans, S. (2020). “The Costs of Wildfire in California.” California Council on Science and Technology.
Hakes, R. S., Caton, S. E., Gorham, D. J., & Gollner, M. J. (2017). “A Review of Pathways for Building Fire Spread in the Wildland Urban Interface Part II: Response of Components and Systems and Mitigation Strategies in the United States.” Fire Technology, 53(2), 475‑515.
Hawks, S. & Brewer, W. (2019). “CalFire Defensible Space and Damage Inspection Program Data Analysis.”
Hedayati, F., Stansell, C., Gorham, D., & Quarles, S. L. (2018). “Wildfire Research: Near‑Building Noncombustible Zone.” Insurance Institute for Business & Home Safety.
Hodgson, R. W. (1995). “Strategies for and Barriers to Public Adoption of Fire Safe Behavior.” The Biswell Symposium: Fire Issues and Solutions in Urban Interface and Wildland Ecosystems.
Insurance Institute for Business & Home Safety. (2020). “Suburban Wildfire Adaptation Roadmaps: A Path to Coexisting with Wildfires.”
Maranghides, A., McNamara, D., Mell, W., Trook, J., & Toman, B. (2013). “A Case Study of a Community Affected by the Witch and Guejito Fires: Report# 2: Evaluating the Effects of Hazard Mitigation Actions on Structure Ignitions.” National Institute of Standards and Technology, US Department of Commerce and US Forest Service, Gaithersburg, MD.
McCaffrey, S. M., Stidham, M., Toman, E., & Shindler, B. (2011). “Outreach Programs, Peer Pressure, and Common Sense: What Motivates Homeowners to Mitigate Wildfire Risk?.” Environmental Management, 48(3), 475‑488.
Meldrum, J. R., Barth, C. M., Falk, L. C., Brenkert‑Smith, H., Warziniack, T., & Champ, P. (2013). “Living with Wildfire in Log Hill Mesa, Colorado.” US Department of Agriculture, Forest Service, Rocky Mountain Research Station.
Mell, W., Manzello, S., & Maranghides, A., (2010). “The Wildland‑Urban Interface Fire Problem‑Current Approaches and Research Needs.” Journal of Wildland Fire, 238‑251.
Syphard, A. D., Brennan, T. J., & Keeley, J. E. (2014). “The Role of Defensible Space for Residential Structure Protection During Wildfires.” International Journal of Wildland Fire, 23(8), 1165‑1175.
Syphard, A. D., & Keeley, J. E. (2019). “Factors Associated with Structure Loss in the 2013‑2018 California Wildfires.” Fire, 2(3), 49.
Wara, Michael. (2021). “A New Strategy for Addressing the Wildfire Epidemic in California.” Stanford Woods Institute for the Environment.