LAO Contact

November 17, 2021
The 2022-23 Budget
California’s Fiscal Outlook
- Introduction
- What Is the Budget's Condition for 2022-23?
- How Does the SAL Affect Budget Choices?
- Is There Capacity for New, Ongoing Commitments?
- Comments
- Appendix
Executive Summary
What Is the Anticipated Surplus? Despite the ongoing global pandemic and its disparate health and economic impacts on Californians, revenues are growing at historic rates and we estimate the state will have a $31 billion surplus (resources in excess of current law commitments) to allocate in 2022‑23.
How Does the State Appropriations Limit (SAL) Affect Budget Choices? Our office historically has focused on budget balance and reserves as key budget structure issues. Given trends in revenues and spending, we see the SAL as the key issue this year. Specifically, using our estimates of revenues and spending under current law and policy, the state would need to allocate roughly $14 billion to meet the constitutional requirements under SAL across 2020‑21 and 2021‑22. (To meet those requirements, the Legislature could reduce taxes; spend more on excluded purposes, like infrastructure; or issue tax rebates and make additional payments to schools and community colleges.) In addition—while there is significant uncertainty in these figures—we estimate the state could have $12 billion in additional SAL requirements in 2022‑23.
Is There Capacity for New, Ongoing Commitments? We also examine the budget’s condition through 2025‑26 and assess its capacity for new commitments, such as spending increases or tax reductions. This report finds the budget has such capacity. Specifically, we find the operating surpluses range from $3 billion to $8 billion over the multiyear period.
LAO Comments
Will Recent Revenue Gains Be Sustained? Revenue collections have grown rapidly in recent months, coming in over $10 billion ahead of budget act expectations so far this year. Underlying this growth is a meteoric rise in several measures of economic activity. Can these trends really remain so far above the long‑run trend for an extended period of time? Historically, strong economic and revenue growth more often than not is followed by more growth. Moreover, much of the revenue gains have been in historically more stable revenue streams, such as sales tax and income tax withholding. In a period of such unprecedented growth, however, these historical observations might be less relevant than usual. Ultimately, knowing for certain whether recent gains are sustainable is impossible. Recognizing this, our main revenue forecast takes a middle ground of possibilities, assuming neither that the gains are entirely sustainable nor that they are entirely unsustainable.
Under Our Revenue Estimates, Actions to Meet the SAL Requirements Would Be Prudent in Early 2022. If current revenue collection conditions persist in December and January, the Legislature may want to seriously consider—early in the year—how it plans to meet the SAL requirements for 2020‑21 and 2021‑22. By identifying how to meet current‑ and prior‑year SAL requirements early, the Legislature largely would avoid needing to make this decision in May, when myriad other budget issues are being deliberated.
More Reserves Warranted. Under our revenue estimates for 2022‑23, the balance of the state’s constitutional reserve would reach about 10 percent of revenues and transfers by the end of that fiscal year. In order to bring the balance of the state’s total reserves to their pre‑pandemic level of 13 percent of revenues and transfers, the Legislature would need to make additional, discretionary deposits into one of its reserves. Although it would involve trade‑offs, given the historic growth in revenues in recent years and sizeable anticipated surplus, we suggest the Legislature consider increasing total reserves by more than the constitutionally required level.
Introduction
Each year, our office publishes the Fiscal Outlook in anticipation of the upcoming state budget process. This year’s report addresses three key questions for lawmakers:
- What Is the Budget’s Condition for 2022‑23? Despite the ongoing global pandemic and its disparate health and economic impacts on Californians, revenues are growing at historic rates and the state likely will have another significant surplus (resources in excess of current law commitments).
- How Does the State Appropriations Limit (SAL) Affect Budget Choices? Our office historically has focused on budget balance and reserves as key budget structure issues. Given trends in revenues and spending, we see the SAL as the key issue this year. Specifically, the SAL will constrain how the Legislature can allocate the estimated surplus this year.
- Is There Capacity for New, Ongoing Commitments? We also examine the budget’s condition over the longer term—through 2025‑26—and assess its capacity for new commitments, such as spending increases or tax reductions. This report finds the budget has such capacity.
Our answers to these questions rely on specific assumptions about the future of the state economy, its revenues, and its expenditures. Consequently, our answers are not definitive, but rather reflect our best guidance to the Legislature based on our professional assessments at this time. In addition, while we were putting together the estimates in this report, Congress passed the Infrastructure Investment and Jobs Act and updated inflation information became available. The ultimate budgetary impacts of these changes are not yet known. Regardless, because of the timing, any possible effects of these changes are not included in this analysis.
What Is the Budget’s Condition for 2022‑23?
Anticipated Surplus of $31 Billion
Figure 1 shows that under our revenue estimates the state would have a surplus of $31 billion to allocate in the upcoming budget process. The term “surplus” means the difference between projected revenues and spending under current law and policy. Consequently, the surplus reflects our assessment of the budget’s capacity to pay for existing and—potentially—new commitments. On a technical basis, the surplus is shown as the balance of the Special Fund for Economic Uncertainties (SFEU) in 2022‑23.
Figure 1
General Fund Condition Under Fiscal Outlook
(In Millions)
|
2020‑21 |
2021‑22 |
2022‑23 |
|
|
Prior‑year fund balance |
$5,556 |
$32,229 |
$29,195 |
|
Revenues and transfers |
193,757 |
197,944 |
202,288 |
|
Expenditures |
167,084 |
200,978 |
197,059 |
|
Ending fund balance |
32,229 |
29,195 |
34,424 |
|
Encumbrances |
3,175 |
3,175 |
3,175 |
|
SFEU Balance |
$29,054 |
$26,020 |
$31,249 |
|
Reserves |
|||
|
BSA balance |
$11,967 |
$16,825 |
$20,917 |
|
Safety Net Reserve |
900 |
900 |
900 |
|
Total Reserves |
$12,867 |
$17,725 |
$21,817 |
|
SFEU = Special Fund for Economic Uncertainties and BSA = Budget Stabilization Account. |
|||
The surplus reflects three trends in the prior year (2020‑21) and current year (2021‑22), as well an operating surplus in the budget year (2022‑23) and the $4 billion SFEU balance from the enacted 2021‑22 budget.
Specifically, it is the result of:
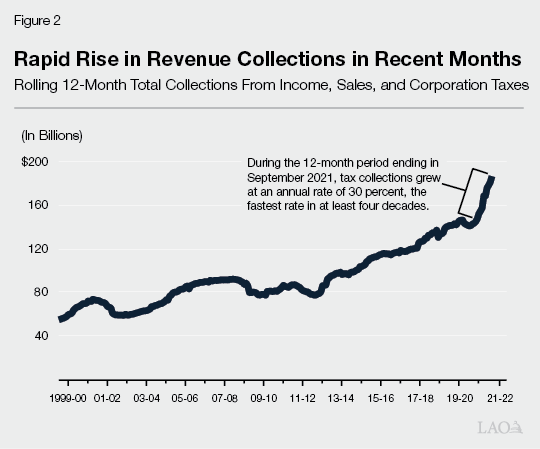
- Higher Revenues of $28 Billion. As can be seen in Figure 2, revenue collections have grown rapidly in recent months, coming in over $10 billion ahead of budget act expectations so far this year. Underlying this growth is a meteoric rise in several measures of economic activity. Retail sales have posted double digit growth during 2021. Stock prices have doubled from their pandemic low last spring. Several major firms have posted historically high earnings. Consistent with this recent trend, under our main forecast, we estimate tax revenues (and transfers) are higher by nearly $28 billion across 2020‑21 and 2021‑22 compared to budget act estimates. (For more information about our revenue forecast, see: 2022‑23 Fiscal Outlook Revenue Estimates.)
- Higher Spending on Schools and Community Colleges by $11 Billion. General Fund spending on schools and community colleges is determined by a set of constitutional formulas under Proposition 98 (1988). Under our outlook, the state allocates about 40 percent of General Fund revenue to K‑14 education each year of the budget window. As such, consistent with General Fund tax revenue increases, our estimate of required General Fund spending on schools and community colleges for 2020‑21 and 2021‑22 increases by almost $11 billion. We discuss more information about the overall minimum funding level for K‑14 education below.
- Other Spending Lower by $5 Billion. Across the rest of the budget, our estimate of costs in 2020‑21 and 2021‑22 are lower than budget act estimates by about $5 billion. There are many factors contributing to these savings, but two major ones. First, we score all of the savings associated with the enhanced federal share for certain Medicaid programs in 2021‑22. (We describe this in more detail in the box nearby, along with other federal pandemic‑related actions that have notable implications for this year’s budget condition.) Second, we account for a reversion of $3.3 billion in spending on transportation, which was contingent on legislation that did not pass.
- Operating Surplus of $5 Billion in 2022‑23. In addition to the factors described above, which are revisions to the 2021‑22 Budget Act, our outlook anticipates the state will have an additional $5.2 billion operating surplus in 2022‑23. This is the amount that revenues are expected to exceed spending under current law and policy in that year.
Federal Coronavirus Disease 2019‑Related Actions With Continued Impact on the State Budget
Throughout 2020 and 2021, the federal government took actions and passed legislation that had a significant effect on California’s budget. This box describes some of the federal actions that continue to have major implications for the state’s fiscal condition in 2022‑23. (As noted earlier, this report does not reflect recent federal action on infrastructure spending as the Infrastructure Investment and Jobs Act was passed as we were completing our assessment.)
American Rescue Plan (ARP) Act Fiscal Relief Funds. The ARP included $350 billion in flexible funding to state and local governments for fiscal recovery in Coronavirus State and Local Fiscal Recovery Funds. Of this total, California’s state government received about $27 billion. The 2021‑22 budget allocated the entirety of these funds to a variety of purposes, including about $9.2 billion to offset existing General Fund costs. After the budget was passed, however, the Newsom administration adjusted this amount downward by about $300 million to account for a new estimate of revenue losses under the ARP’s provisions. This means General Fund costs will increase by this amount, but the Legislature also will have these ARP funds to allocate to one of the federally allowable purposes in 2022‑23. (For more information, see: The 2021‑22 Spending Plan: Major New Control Sections in the Spending Plan)
Enhanced Federal Match for Medicaid. Medicaid is an entitlement program whose costs generally are shared between the federal government and states. In 2020, Congress approved a temporary 6.2 percentage point increase in the federal government’s share of cost for state Medicaid programs until the end of the national public health emergency declaration. We assume the declaration expires in January 2022, with a corresponding expiration of the enhanced federal match at the end of March. As a result, we assume an increase in General Fund costs of state Medicaid programs beginning in the fourth quarter of the current fiscal year (2021‑22).
Enhanced Federal Match for Home‑ and Community‑Based Services (HCBS). The ARP also included a temporary enhanced federal match rate for HCBS funded through the Medicaid program, which reduces the state’s share of base program costs for these services by $3 billion. However, the federal government requires states to “reinvest” these freed‑up state funds on expanded, enhanced, or strengthened HCBS services. The budget act did not fully account for the base HCBS program savings or expenditure of these savings. Relative to the budget act, we score an additional $1 billion in net General Fund savings between 2020‑21 and 2021‑22 associated with the enhanced Medicaid HCBS match. However, these funds are not ultimately part of the surplus—they have already been committed to specific HCBS enhancements that were adopted after the passage of the budget act through the state’s HCBS Spending Plan. (For more information, see our post: Home‑ and Community‑Based Services Spending Plan.)
The result of these factors, taken together, is a discretionary surplus of $31 billion, which is available for the Legislature to allocate in the 2022‑23 budget process.
Resources Available to Allocate to Discretionary Spending Likely Will Be Somewhat Less Than $31 Billion. Our estimate of a $31 billion surplus for 2022‑23 includes: (1) the enacted SFEU balance from 2021‑22 ($4 billion) and (2) the $3.3 billion planned for transportation, but which reverted to the General Fund. Consequently, our estimate of the surplus could be interpreted to implicitly reflect an SFEU balance that is essentially $0. The Legislature can choose to set the SFEU balance at any level above zero. Recent budgets have enacted SFEU balances around $2 billion to $4 billion, which the state has sometimes used to cover costs for unanticipated expenditures. Given this, in practice, the actual amount of the state’s resources available for new discretionary spending will be somewhat less than $31 billion.
Actual Surplus Will Be Different. The state has a $31 billion surplus under our main forecast. However, revenues easily could end up tens of billions of dollars above or below our main forecast. If revenues in 2021‑22 and 2022‑23 are at the lower end of our most likely alternative outcomes, the surplus could be as low as $10 billion. If revenues are at the higher end, the surplus could be closer to $60 billion.
Reserves
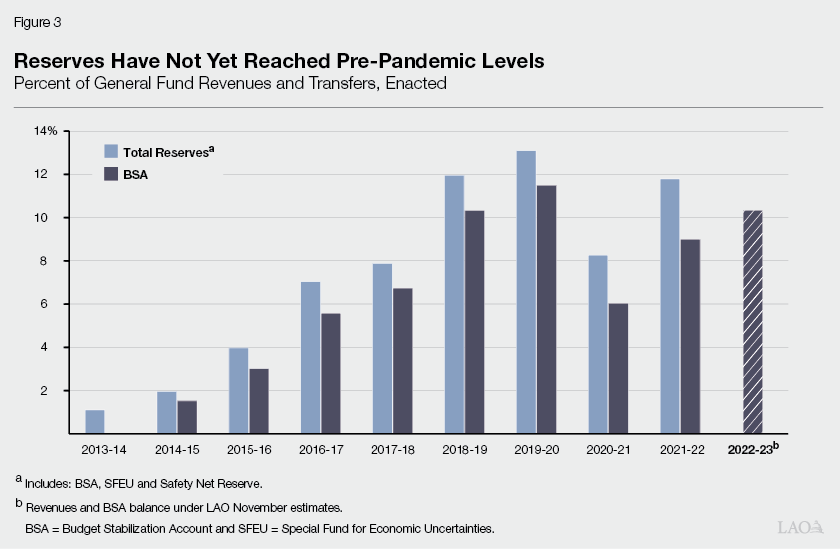
Excluding the SFEU, Reserves Would Reach $22 Billion in 2022‑23. As shown in Figure 3, the balance of the state’s constitutional reserve, the Budget Stabilization Account (BSA), would grow to about 10 percent of General Fund revenues and transfers ($21 billion) under our revenue estimates. In particular, under the constitutional rules of Proposition 2 (2014), the state would be required to deposit about $4 billion in the BSA in 2022‑23 and make net true up deposits of $1 billion. Although this represents an increase relative to the 2021‑22 enacted level, the balance of the BSA would remain below the pre‑pandemic level of 11 percent of revenues. (Figure 3 does not display an estimate for total reserves in 2022‑23 because this level largely will be determined by discretionary choices made by the Legislature. Total reserves include the Safety Net Reserve and the enacted balance of the SFEU.)
Funding for Schools and Community Colleges
Significantly Higher Estimates of the Proposition 98 Guarantee in Current and Prior Year. The state funds the guarantee through a combination of General Fund and local property tax revenue. Compared with the estimates included in the June 2021 budget plan, the estimates of the guarantee under our main outlook are up $1.8 billion (2 percent) in 2020‑21 and $8.9 billion (9.5 percent) in 2021‑22. The increase in the 2021‑22 guarantee is one of the largest upward revisions since the passage of Proposition 98 in 1988. In both years, the increases are due to our higher General Fund revenue estimates.
Additional Growth in the Guarantee in Budget Year. For 2022‑23, we estimate the guarantee is $105.3 billion, an increase of $2.6 billion (2.6 percent) relative to the revised 2021‑22 level. Growth in General Fund revenue and local property tax revenue both contribute to the higher guarantee. An additional contributing factor is the expansion of Transitional Kindergarten, a program that is currently open to four‑year old children born between September 2 and December 2. The June 2021 budget plan sets forth a schedule to expand this program to all four‑year olds over a four‑year period, beginning in 2022‑23. The Legislature and Governor also agreed to adjust the guarantee to cover the associated costs. This adjustment accounts for $421 million of the increase in the guarantee in 2022‑23.
Nearly $20 Billion Available for Allocation in Upcoming Budget Cycle. After accounting for a 5.35 percent statutory cost‑of‑living adjustment (COLA), deposits into the Proposition 98 reserve, and various other adjustments, we estimate the Legislature has $9.5 billion in ongoing funds available for allocation in 2022‑23. In addition, after accounting for the upward revisions in 2020‑21 and 2021‑22 and various smaller adjustments, we estimate that $10.2 billion in one‑time funds are available. Across the three‑year period, the Legislature has $19.7 billion to allocate for its school and community college priorities in the upcoming budget cycle. This estimate of available funding exceeds the amount in any previous outlook our office has produced.
How Does the SAL Affect Budget Choices?
Our office historically has focused on budget balance and reserves as key budget structure issues. Given trends in revenues and spending, we see the SAL as the key issue this year. The SAL limits how the Legislature can use revenues that exceed a specific threshold. Given this constraint, under our revenue estimates, the Legislature would not have full discretion over the anticipated $31 billion surplus. Specifically, before allocating the surplus to any discretionary purpose, the Legislature first would need to determine how much of the state’s revenues must be allocated to SAL‑related purposes.
How the Formula Works. Proposition 4 (1979) established an appropriations limit on the state and most types of local governments. Under these constitutional requirements, each year the state must compare the appropriations limit to appropriations subject to the limit. As shown in Step 1 of Figure 4, this year’s limit is calculated by adjusting last year’s limit for a growth factor that includes economic and population growth. As shown in Step 2, appropriations subject to the limit are determined by taking all proceeds of taxes and subtracting excluded spending. In Step 3, the state compares appropriations subject to the limit to the limit itself. If appropriations subject to the limit are less than the limit, there is “room.” If appropriations subject to the limit exceed the limit (on net) over any two‑year period, there are excess revenues.
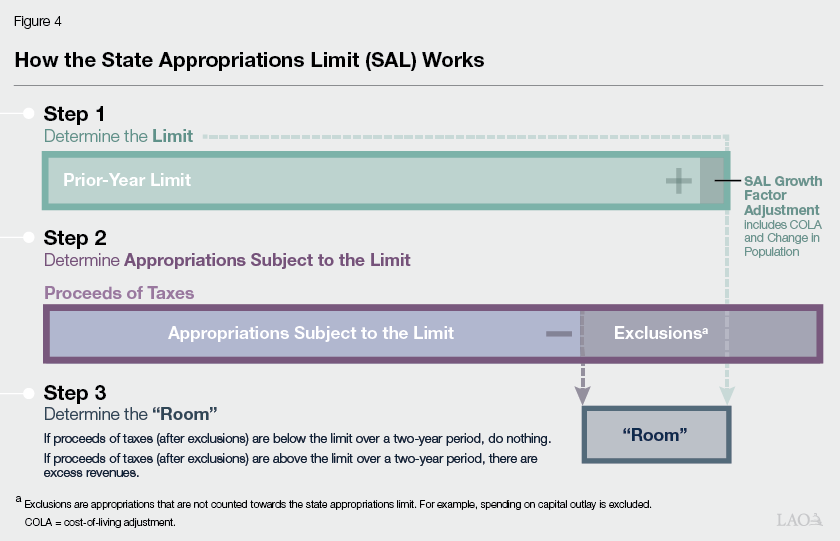
How Does the Legislature Meet the Constitutional Requirements Under the SAL? The Legislature can meet its SAL requirements in any of three ways: (1) lower tax revenues; (2) split the excess revenues between additional school and community college district spending and taxpayer rebates, or (3) appropriate more money for purposes excluded from the SAL. These exclusions include: subventions to local governments, capital outlay projects, debt service, federal and court mandates, and certain kinds of emergency spending.
Current‑Year SAL Requirements. Under our estimates of revenues and spending under current law and policy, the state would need to allocate roughly $14 billion to meet the constitutional requirements under SAL across 2020‑21 and 2021‑22. (This is shown in Figure 5 as the net amount by which appropriations subject to the limit exceed the limit across those two years.) There are a couple of key reasons that this is the case, even though the 2021‑22 Budget Act anticipated the state would have about $17 billion in room across these two years. First, our estimate of General Fund proceeds of taxes in these years is $28 billion higher than budget act estimates. Second, as a result of late session actions, we estimate spending on qualified capital outlay is about $4 billion lower than the budget act anticipated. (This is somewhat offset by our differing estimates of subventions to schools and community colleges.)
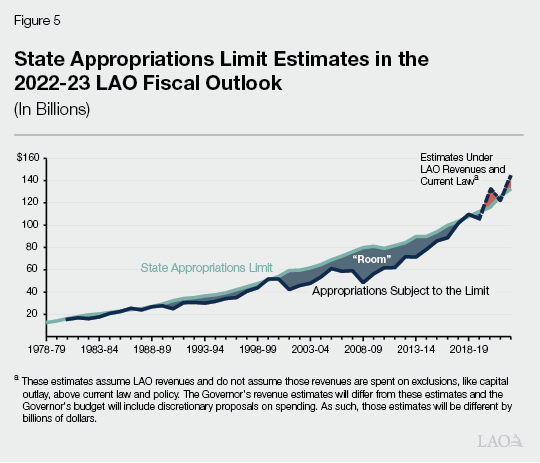
Budget Year SAL Requirements. Using our estimates of General Fund tax revenues and spending under current law and policy, we also project the state’s SAL position for 2022‑23. While there is significant uncertainty in these figures, we estimate the state could have around $12 billion in additional SAL requirements to meet in 2022‑23. In considering the state’s 2022‑23 SAL estimates, we anticipate the state’s SAL position in 2023‑24 to be a major consideration in the budget process and enactment. Our estimates for the state’s SAL position across the budget window are also shown in the insert in Figure 6.
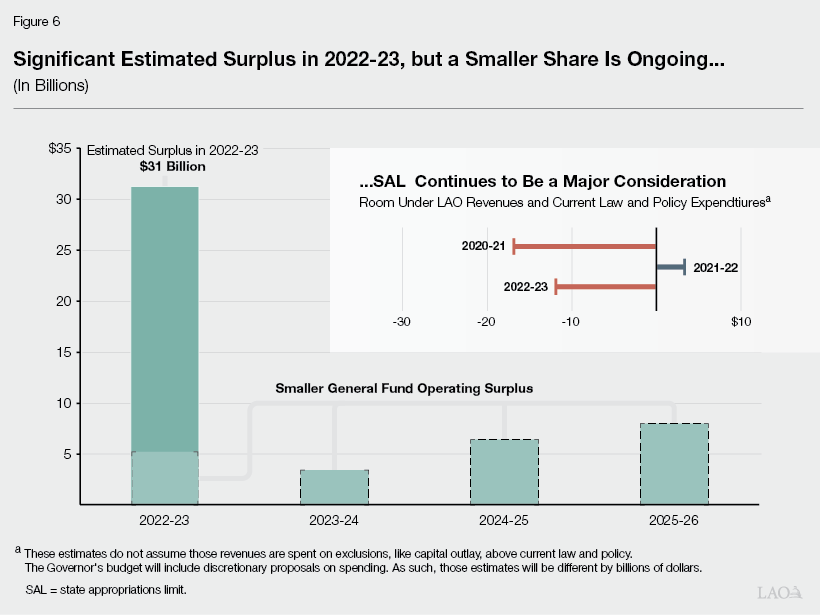
Is There Capacity for New, Ongoing Commitments?
Operating Surpluses of $3 Billion to $8 Billion. Figure 6 displays our estimates of the budget’s condition over the outlook period. As the figure shows, although we estimate the budget has an available surplus of $31 billion to allocate in 2022‑23, the amount available on an ongoing basis—the operating surplus—is lower. This estimate is subject to a number of important caveats, however. Most importantly, the amount of revenues the state collects will be higher or lower than the estimates here. In general terms, our revenue estimates represent the middle of possible outcomes, meaning there is about a 50 percent chance that revenues will be higher (or lower) than our main forecast.
Expenditures Could Be Somewhat Lower, Increasing the Surplus. Across our outlook, there are a number of expenditure areas where costs could be lower than what we have assumed for a variety of reasons, including, for example, decisions by the state government, federal government, and pension boards. If costs are lower than we have estimated, the operating surpluses displayed in Figure 6 would be higher. Some key areas where expenditures could be lower, include:
- Medi‑Cal. For a number of years, the state has imposed a tax on managed care organizations’ (MCOs’) Medi‑Cal and commercial lines of business. We assume the state’s MCO tax expires midway through 2022‑23, consistent with current law. The MCO tax leverages significant federal funding. If the Legislature extended the MCO tax at similar levels, it would result in lower General Fund costs in the Medi‑Cal program by up to $2 billion annually beginning in 2023‑24.
- Medicaid Programs. As described in the box nearby, our outlook assumes the federal public health emergency declaration expires in January 2022, resulting in an increase in General Fund costs of state Medicaid programs beginning in the fourth quarter of 2021‑22. If the federal government extends the declaration, costs would be lower. For example, if the public health declaration remained in place until the end of 2021‑22, we estimate it would result in additional General Fund savings of nearly $1 billion.
- Pensions. As a result of recent performance in asset markets, both of the state’s major pension systems have reported very high investment returns in the last year. These returns were not reflected in the system’s most recent actuarial valuations and so we have not included their impact on state costs in this analysis. Reflecting these return assumptions could result in substantially lower state costs, particularly for the teachers’ pension system. The box nearby has more details on possible future developments in the state’s pension systems.
- California Work Opportunity and Responsibility to Kids (CalWORKs). Recent budgets, including the 2021‑22 Budget Act, have anticipated that caseload‑related costs, for example in Medi‑Cal and CalWORKs, would increase substantially. In the case of CalWORKs, these caseload increases have not yet materialized. While our outlook anticipates caseload‑related costs are lower relative to budget act estimates in CalWORKs, we also project caseload to increase in the program over the next year. If these increases do not materialize, costs in this program would be lower than our estimates by the low hundreds of millions of dollars.
Changes in State Pension Contributions on Horizon
State Contributions to CalSTRS
Forecast Assumes State Contributions to CalSTRS Continue to Increase Over Next Few Years. Our forecast for state contributions to the California State Teachers’ Retirement System (CalSTRS) in the outyears uses the pension system’s most recent actuarial valuation, which reflects CalSTRS’ 3.9 percent investment returns in 2019‑20. Based on that valuation period, actuaries projected the state’s rate would need to continue increasing annually by the maximum allowed 0.5 percent of teacher payroll for the next few years. Accordingly, our forecast assumes the state’s required contribution rate to CalSTRS’ Defined Benefit program will continue increasing, reaching nearly 10 percent of teacher payroll in 2024‑25 and 2025‑26.
CalSTRS Experienced 27.2 Percent Investment Returns in 2020‑21. CalSTRS’ next actuarial valuation—reflecting 2020‑21 investment returns, payroll growth, and other factors impacting CalSTRS’ unfunded liabilities and required contribution rates—will not be available until the spring of 2022, and CalSTRS will set required contribution rates for 2022‑23 at that time. However, CalSTRS announced after the close of the 2020‑21 fiscal year that the system’s assets returned 27.2 percent in that year. This investment return experience is well above CalSTRS’ assumed annual rate of 7 percent.
State’s Contribution Rate Now Projected to Dramatically Decrease, Resulting in Annual General Fund Savings of Billions of Dollars. Based on current law, CalSTRS’ 27.2 percent investment returns will have an outsized impact on the state’s contribution rate. Specifically, CalSTRS actuaries project that the 2020‑21 investment return experience will fully eliminate the state’s share of unfunded liabilities (currently around $31.5 billion) in a few years. Consequently, actuaries now project that the state’s contribution rate could phase down over the next few fiscal years, reaching around 2 percent beginning in 2024‑25. If this occurs, the state’s required contribution rate would be around 8 percentage points lower relative to our forecast by 2024‑25, meaning the state would owe several billions of dollars less to CalSTRS over the forecast period.
State Contributions to CalPERS
Actual Contributions to CalPERS Will Be Different Than We Assume. Our forecast of state employer contributions to the California Public Employees’ Retirement System (CalPERS) uses the projected state employer contribution rates published with the meeting materials for the April 2021 CalPERS board meeting. The actual state contributions during the forecasted period will be different from what we project because (1) the April 2021 projected contribution rates did not take into consideration the 21.3 percent investment return that CalPERS assets experienced during 2020‑21 and (2) the CalPERS board will adopt new actuarial assumptions. Depending on what actuarial assumptions and implementation policies the board adopts, the state’s contributions to CalPERS by the end of the forecast period could be different from what we project.
On the other hand, there are some areas in our outlook that may understate costs. For example, while we do not assume the state faces any major natural disasters—such as a wildfire large enough to receive a state disaster declaration—at least one such disaster will almost certainly occur over the next four years. Nonetheless, on net, we think expenditures are more likely to fall short of our estimates, rather than exceed them.
Proposition 98 General Fund Spending Grows Over the Period. Under our main forecast, General Fund spending to meet the Proposition 98 guarantee grows to $87.8 billion in 2025‑26, an increase of $12.4 billion compared with the revised 2021‑22 level. The average annual increase is $3.1 billion (3.9 percent). Most of this increase is due to growth in General Fund revenue, which increases the Proposition 98 spending requirement about 40 cents for each dollar of additional revenue. A portion of the increase (reaching $2.9 billion by 2025‑26) reflects the agreement by the Legislature and Governor to increase the guarantee for the expansion of Transitional Kindergarten. Local property tax revenue also grows steadily over the period. Accounting for the growth in General Fund spending and local property tax revenue, the total increase in school and community college funding over the period would be $18.6 billion, an average annual increase of $4.7 billion (4.3 percent).
The SAL Will Continue to Impact Budget Choices if Revenues Continue to Grow Faster Than the Limit. From 2015‑16 to our most recent estimates in 2022‑23, SAL revenues have grown an average of 7.4 percent annually. Over the same period, the limit has grown 5 percent annually. If these trends continue, the Legislature will need to spend increasing amounts on excluded purposes, like capital outlay; lower tax revenues on an ongoing basis; or use additional, and increasing, resources to return funds to taxpayers and make additional payments to schools and community colleges. Put another way, despite the operating surpluses we display in Figure 6, the budget might not have much capacity for new, ongoing spending that does not meet the SAL requirements.
Would the Budget Still Break Even if Revenues Are Lower? Revenues could differ substantially from our main forecast—either higher or lower. If revenues fall relative to our outlook, would the budget still break even? As Figure 7 shows, revenues could fall by as much as 4 percent (around $10 billion) in most years of the outlook and the budget would still be balanced. Specifically, the figure shows how the “break even” point—the amount of revenues required to pay for the budget’s current commitments—compares to our main revenue forecast. Our main forecast is intended to fall in the middle of possible outcomes, with a 50‑50 chance of revenues coming in higher or lower than our estimate. Given this, the fact that the breakeven point is close to but somewhat lower than our main forecast suggests there is a somewhat better than 50‑50 chance of the budget staying balanced over the outlook period.
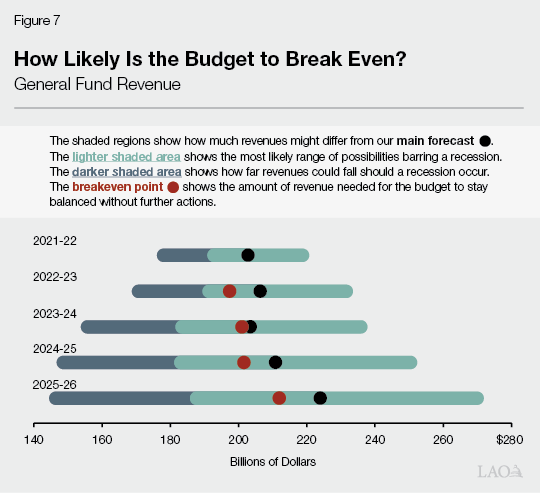
Significantly Lower Breakeven Point for School and Community College Budget. We also can assess what the breakeven revenue point would mean for the school and community college budget. Under the breakeven scenario shown above, the Proposition 98 guarantee would decrease, but would remain roughly $8 billion above the cost of existing school and community college programs over the period. In fact, we estimate that the Proposition 98 guarantee would not drop below the cost of these programs unless the state experienced a recession in which revenues dropped by $25 billion or more relative to our main forecast. Two important factors account for the lower breakeven point for schools and community colleges. First, nearly 30 percent of all Proposition 98 funding consists of local property tax revenue, which tends to grow steadily even during economic downturns. Second, school and community college programs are projected to grow more slowly than underlying program growth in the rest of the budget. There are many reasons for this, including: the timing and amount of federal funds displacing non‑Proposition 98 General Fund spending and low growth in K‑12 average daily attendance.
Comments
Budget Uncertainties
Will Recent Revenue Gains Be Sustained? Even though our forecast assumes that the rapid pace of recent growth will slow in the coming months, wondering whether the recent gains shown in Figure 2 are unsustainable is reasonable. Can the economy and revenues really remain so far above the long‑run trend for an extended period of time? Historically, strong economic and revenue growth more often than not is followed by more growth. Moreover, much of the revenue gains have been in historically more stable revenue streams, such as sales tax and income tax withholding. In a period of such unprecedented growth, however, these historical observations might be less relevant than usual. Ultimately, knowing for certain whether recent gains are sustainable is impossible. Recognizing this, our main revenue forecast takes a middle ground of possibilities, assuming neither that the gains are entirely sustainable nor that they are entirely unsustainable.
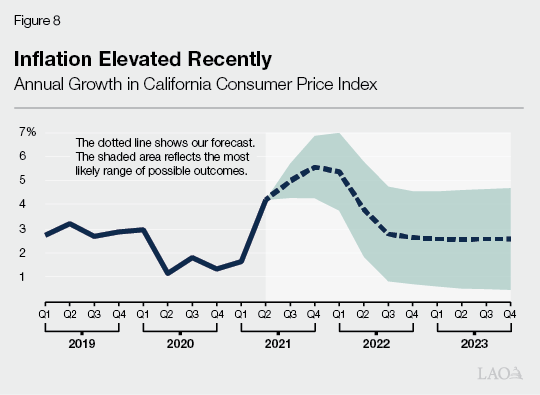
Will Higher Inflation Persist? In recent months, resurgent consumer demand met with continued frictions in production and transport of many goods has led to higher than normal growth in the prices of many goods and services. Annual price inflation has exceeded 5 percent since June, compared to an average of about 2 percent over the last decade. The consensus among economic forecasters (based on the Blue Chip Economic Indicators Survey) is that this uptick in inflation will abate by next year. Our forecast of inflation in California, shown in Figure 8, follows this consensus. This forecast, however, comes with significant uncertainty. The shaded area on Figure 8 shows how far inflation could be expected to differ from our forecast based on the historical accuracy of the economic consensus. Ultimately, despite the consensus expectation, the possibility that elevated inflation persists should not be ruled out. Underscoring this point, very recent data released after the development of our forecast showed further acceleration of inflation in October.
What Are Potential Budget Impacts of Higher Inflation? Higher inflation presents a number of issues for the state budget. On the revenue side, it could lead to increases in collections, for instance due to higher wages. But increased inflation also could create instability in financial markets or the economy broadly, which could depress revenues. On the spending side, higher inflation can result in higher costs, for example for interest on the unemployment insurance loan from the federal government, and bond debt service. In other areas of the budget, higher inflation creates pressure for the state to increase spending, for example on cash assistance or employee compensation.
Budget Choices and Oversight
Administration Will Have Different SAL Estimates… Under our main revenue forecast, the state would have to allocate $14 billion to meet its SAL‑related requirements—for example by spending more on capital outlay or making taxpayer rebates and school and community college payments—across 2020‑21 and 2021‑22. (Additional SAL‑related spending or revenue reductions also could be required for 2022‑23.) The Governor’s budget, however, likely will have different estimates of the state’s SAL position for a couple of reasons. First, the administration’s revenue estimates will differ from ours. Second, whereas our outlook does not allocate the surplus, the Governor’s budget will propose allocations for any discretionary funds, including how to meet the SAL requirements.
…Under Our Revenue Estimates, Actions to Meet the SAL Requirements Would Be Prudent in Early 2022. If current revenue collection conditions persist in December and January, the Legislature may want to seriously consider—early in the year—how it plans to meet the SAL requirements for 2020‑21 and 2021‑22. By identifying how to meet current‑ and prior‑year SAL requirements early, the Legislature largely would avoid needing to make this decision in May, when myriad other budget issues are being deliberated. Given the potential magnitude of the requirement, if the Legislature wishes to meet it with lower tax revenues or spending on excluded purposes, early action would be prudent. If, however, the Legislature preferred to meet the requirement with taxpayer rebates and school and community colleges payments, the state would have two years to make these payments, as allowed by the Constitution, and early action would not be necessary.
Administrative Capacity for New Spending Likely Constrained. The annual budget process provides the Legislature with an opportunity not only to allocate new funding, but also to assess the implementation of existing or recent spending. Given the magnitude of commitments in the 2021‑22 budget and the time it takes to ramp up administrative capacity, the Legislature may want to consider whether additional commitments are feasible or if additional administrative capacity is needed. For example, several departments received one‑time augmentations well in excess of 100 percent of their base budgets in 2021‑22. Including all fund sources, some examples include: the Scholarshare Investment Board, which received $1.9 billion in 2021‑22 (compared to a 2020‑21 budget of $28 million); the Department of Community Services and Development, which received $1.6 billion in 2021‑22 ($340 million in 2020‑21); and the Arts Council, which received $140 million in 2021‑22 ($42 million in 2020‑21). For these departments and others, capacity to carry out policy changes and new or expanded programs could be an ongoing issue, particularly as it takes time for departments to hire and train staff and develop new program rules and guidelines. This consideration could be important as the Legislature determines its budget priorities for 2022‑23.
Reserves
More Reserves Warranted. Under our revenue estimates for 2022‑23, the balance of the state’s constitutional reserve would reach about 10 percent of revenues and transfers by the end of that fiscal year. In order to bring the balance of the state’s total reserves to their pre‑pandemic level of 13 percent of revenues and transfers, the Legislature would need to make additional, discretionary deposits into one of its reserves. Given the historic growth in revenues in recent years and sizeable surplus available for 2022‑23, we suggest the Legislature consider increasing total reserves by more than the constitutionally required level in 2022‑23. That said, such a choice will require trade‑offs. For example, reserve deposits are not excludable from SAL and, under our revenue estimates, the Legislature’s ability to use the surplus for non‑excludable purposes is constrained.
Appendix
Appendix Figure 1
Spending Through 2022‑23
(In Millions)
|
2021‑22 |
Outlook |
||
|
2022‑23 |
Change From |
||
|
Major Education Programs |
|||
|
Schools and community collegesa |
$75,399 |
$76,660 |
1.7% |
|
California State Universityb |
5,601 |
5,083 |
‑9.2 |
|
University of California |
4,676 |
4,293 |
‑8.2 |
|
Financial aid |
3,084 |
3,294 |
6.8 |
|
Major Health and Human Services Programs |
|||
|
Medi‑Calc |
$27,506 |
$31,146 |
13.2% |
|
Department of Developmental Servicesc |
5,853 |
7,213 |
23.2 |
|
In‑Home Supportive Servicesc |
4,074 |
6,587 |
61.7 |
|
SSI/SSP |
2,882 |
3,132 |
8.7 |
|
Department of State Hospitals |
2,593 |
2,391 |
‑7.8 |
|
CalWORKs |
594 |
1,403 |
136.3 |
|
Major Criminal Justice Programs |
|||
|
Corrections and Rehabilitation |
$13,033 |
$12,451 |
‑4.5% |
|
Judiciary |
2,878 |
2,776 |
‑3.5 |
|
Debt service on state bonds |
$5,435 |
$5,343 |
‑1.7% |
|
Other programs |
$47,371 |
$35,286 |
‑25.5% |
|
Totals |
$200,978 |
$197,059 |
‑2.0% |
|
aReflects General Fund component of the Proposition 98 minimum guarantee, including an adjustment for the expansion of Transitional Kindergarten in 2022‑23. bIncludes state contributions for CSU retiree health. cProgram costs in 2022‑23 reflect expiration of enhanced federal shares of cost for some Medicaid‑funded programs, which results in General Fund cost growth that is higher than it would be otherwise. |
|||
Appendix Figure 2
Spending by Major Area Through 2025‑26
(In Billions)
|
Estimates |
Outlook |
Average |
||||||
|
2020‑21 |
2021‑22 |
2022‑23 |
2023‑24 |
2024‑25 |
2025‑26 |
|||
|
Education |
||||||||
|
Schools and community collegesb |
$69.4 |
$75.4 |
$76.7 |
$77.1 |
$81.6 |
$87.8 |
4.8% |
|
|
Other major education programs |
9.5 |
13.4 |
12.7 |
13.1 |
13.8 |
14.3 |
8.5 |
|
|
Health and Human Services |
$37.0 |
$43.5 |
$51.9 |
$53.8 |
$57.2 |
$60.3 |
10.2% |
|
|
Criminal Justice |
$13.7 |
$15.9 |
$15.2 |
$15.3 |
$15.3 |
$15.4 |
2.4% |
|
|
Debt service on state bonds |
$5.1 |
$5.4 |
$5.3 |
$5.4 |
$5.6 |
$5.8 |
2.5% |
|
|
Other programs |
$32.3 |
$47.4 |
$35.3 |
$34.7 |
$29.9 |
$31.3 |
‑0.6% |
|
|
Totals |
$167.1 |
$201.0 |
$197.1 |
$199.5 |
$203.4 |
$214.9 |
5.2% |
|
|
Percent change |
— |
20.3% |
‑2.0% |
1.3% |
2.0% |
5.6% |
— |
|
|
aFrom 2020‑21 to 2025‑26 bReflects General Fund component of the Proposition 98 minimum guarantee, including an adjustment for the expansion of Transitional Kindergarten. Note: Program groups are defined to include departments listed in Appendix Figure 1. |
||||||||