LAO Contact

May 11, 2022
The 2022-23 Budget
Update on K‑12 Student Attendance
Summary. In early March, the California Department of Education (CDE) published the first report of 2021‑22 attendance data. Below, we provide background on the calculation of school attendance, describe findings from the updated data, and discuss a few key issues to provide greater context for the findings.
Background
School Districts Report Attendance Data Three Times Per Year. California requires school districts to track the average daily attendance (ADA) of their students—the average number of students in class each day throughout the school year. School districts report their ADA to the state three times per year. The first time (known as “P‑1”) covers attendance data from the beginning of the school year through December. CDE certifies this data in February. The second time (known as “P‑2”) runs from the beginning of the school year through April 15 and is certified in June. The third time (known as “Annual”) covers the entire school year and is certified in February of the following school year.
Attendance Affects Most State Funding for Schools. The department uses attendance data to allocate state funding for various programs, including the Local Control Funding Formula (LCFF) and the state’s special education categorical program. The role of the P‑1 report is to provide an interim estimate of attendance until better data become available. For most programs, the state finalizes funding based on the P‑2 attendance data. For a few programs—generally those operated by county offices of education (COEs)—the state waits to finalize funding until it receives annual data.
State Temporarily Modified Attendance Policies to Address the Pandemic. For the purpose of determining LCFF allotments, the state credits school districts with their ADA in the current or prior year, whichever is higher. By contrast, charter schools and COEs are funded based on current‑year attendance only. The emergence of the COVID‑19 pandemic in the spring of 2020 resulted in the closure of virtually all schools in the state. For most students, remote learning replaced classroom instruction for a large portion of the 2020‑21 school year. In response to these changes, the state temporarily modified its approach to funding attendance. For 2019‑20, the state provided that attendance levels would depend only on ADA through February 2020. For 2020‑21, the state suspended the collection of attendance data and credited districts and charter schools with their 2019‑20 attendance levels. (Growing school districts and classroom‑based charter schools could receive credit for additional students under certain conditions.) For 2021‑22, the state returned to its previous policy—crediting school districts with the greater of their attendance in 2021‑22 (current year) or 2020‑21 (prior year). Charter schools will be funded based on 2021‑22 attendance levels only (consistent with the previous policy).
Governor’s Budget Proposes Change to Attendance Calculations. In his January budget, the Governor proposed an additional attendance adjustment for school districts with declining attendance, beginning in 2022‑23. Under this proposal, districts would be credited with their ADA over the three prior years if it exceeds their current‑ and prior‑year attendance. (For 2022‑23, attendance would be based on the average of 2019‑20, 2020‑21, and 2021‑22.) The Governor did not propose any specific changes for charter schools, but indicates the administration will explore options for extending a declining attendance adjustment to charter schools in the future. As we discussed in our post, The 2022‑23 Budget: Local Control Funding Formula, we recommend the Legislature adopt the proposed changes to LCFF.
Findings From Recent Data
Attendance Is Tracking Significantly Lower Than Budget Projections. The Governor’s January budget assumed a 0.4 percent decline in statewide attendance from 2019‑20 to 2020‑21 and a 2.7 percent decline in 2021‑22—for a two‑year decline of 3.1 percent. The recent data released by CDE shows statewide attendance for school districts and charter schools is down 8.1 percent (about 473,000 students) from 2019‑20 to 2021‑22—roughly 5 percentage points lower than anticipated.
Overall Attendance Declined for School Districts and Charter Schools. From 2019‑20 to 2021‑22, school district ADA declined by about 468,600 students (9 percent), while charter school ADA declined by roughly 8,800 students (1.4 percent). As Figure 1 shows, although charter school ADA is down overall, nonclassroom‑based attendance grew by about 8,000 students (4.1 percent) during the pandemic. (Nonclassroom‑based ADA includes students using individualized, self‑paced student learning plans.) This increase is likely due to some families choosing to enroll students in nontraditional programs while most school districts were providing instruction remotely.
Figure 1
Attendance Changes for
School Districts and Charter Schools
Change From 2019‑20 to 2021‑22
|
Difference |
Percent |
|
|
School district |
‑468,600 |
‑9.0% |
|
Classroom‑based charter |
‑16,800 |
‑3.8 |
|
Nonclassroom‑based charter |
8,000 |
4.1 |
|
Charter School Total |
(‑8,800) |
(‑1.4%) |
|
Statewide Total |
‑477,400 |
‑8.2% |
About Half of ADA Decline Likely Attributable to Enrollment Declines. One important factor that explains the large drop in attendance is the decrease in student enrollment during the pandemic. The state tracks enrollment annually on the first Wednesday in October (known as census day), to establish a baseline count of the number of students enrolled in each school. The census day enrollment data for 2021‑22 shows the state has experienced a 4.2 percent decline (about 254,300 students) since 2019‑20—roughly half of the rate of decline for attendance.
Remaining Attendance Decline Attributable to Changes in Attendance Rates During the Pandemic. The remaining ADA decline is likely attributable to higher rates of absence during the first few months of the 2021‑22 school year. To measure rates of attendance using statewide data, we use the ratio between ADA and census day enrollment. From 2013‑14 through 2019‑20, the statewide ADA‑to‑enrollment ratio was an average of 95.2 percent and was stable over the period. Preliminary 2021‑22 data show an ADA‑to‑enrollment ratio of 91.4 percent. Lower attendance rates could be explained by a variety of factors, but is likely all or predominately due to the effects of the COVID‑19 pandemic on students and families. Some students may have been absent after testing positive for COVID‑19 or quarantining after exposure. In some cases, parents may have kept kids home from school as a precaution, even if not required.
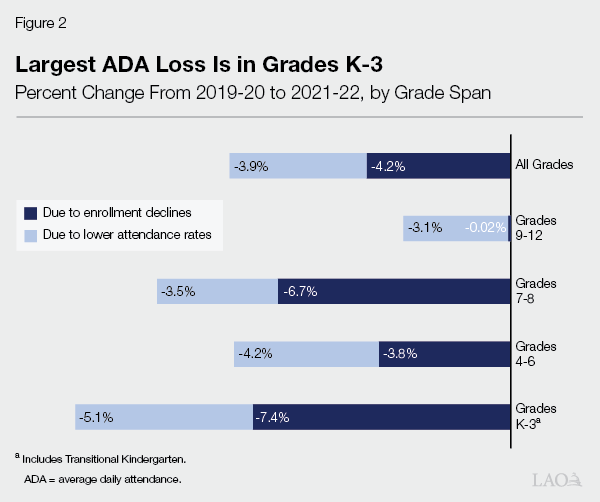
Early Grades Experienced Largest Attendance and Enrollment Declines. As Figure 2 shows, the largest attendance declines during the pandemic were in the kindergarten through grade 3 (K‑3) grade span. (This category also includes Transitional Kindergarten [TK].) K‑3 ADA declined by 12.5 percent (roughly 224,000 ADA) from 2019‑20 to 2021‑22. This represents nearly half of the ADA decline across all grades, despite K‑3 students representing only about 30 percent of the overall student population. As Figure 2 shows, more than half of the decline is related to lower enrollment. The large enrollment decline is likely due in part to some parents choosing to delay enrollment of their children in kindergarten or TK during the pandemic. Conversely, the 9‑12 grade span saw the lowest ADA declines of any grade span (3.1 percent). A major contributing factor may be 12th graders enrolling for a fifth year, as 12th grade enrollment increased by roughly 7,600 students during the pandemic.
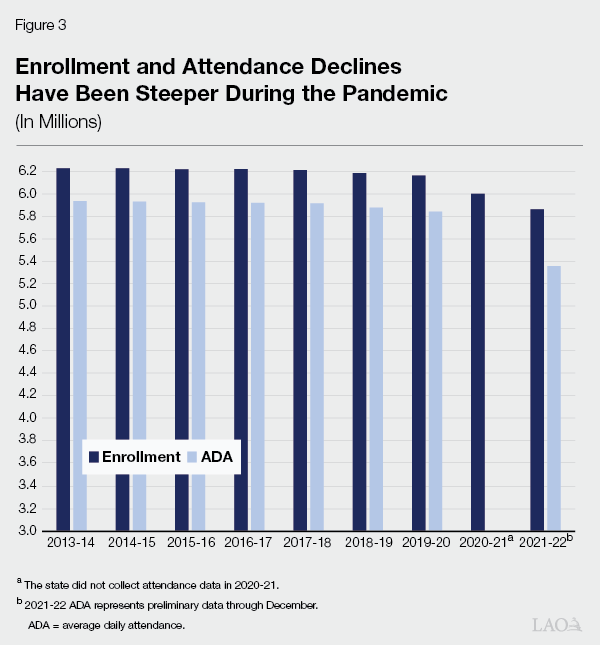
Statewide Attendance and Enrollment Declined at Higher Rates During Pandemic. After a few decades of significant growth, the state has faced declining enrollment and attendance over the last decade. These declines are mainly due to declines in the school‑age population caused by historically low birth rates. As Figure 3 shows, year‑to‑year declines in statewide enrollment and attendance were relatively modest prior to the pandemic. The enrollment declines in 2020‑21 and 2021‑22—2.6 percent and 2.4 percent, respectively—are the largest since 1978‑79 (2.8 percent). Similarly, the ADA decline in 2021‑22 would be the largest decline in the last few decades if final numbers are similar to the preliminary estimates. (The state did not collect ADA data in 2020‑21.) The declines in enrollment during the pandemic are steeper than changes in the school‑age population, which suggests that the pandemic has affected enrollment in 2020‑21 and 2021‑22.
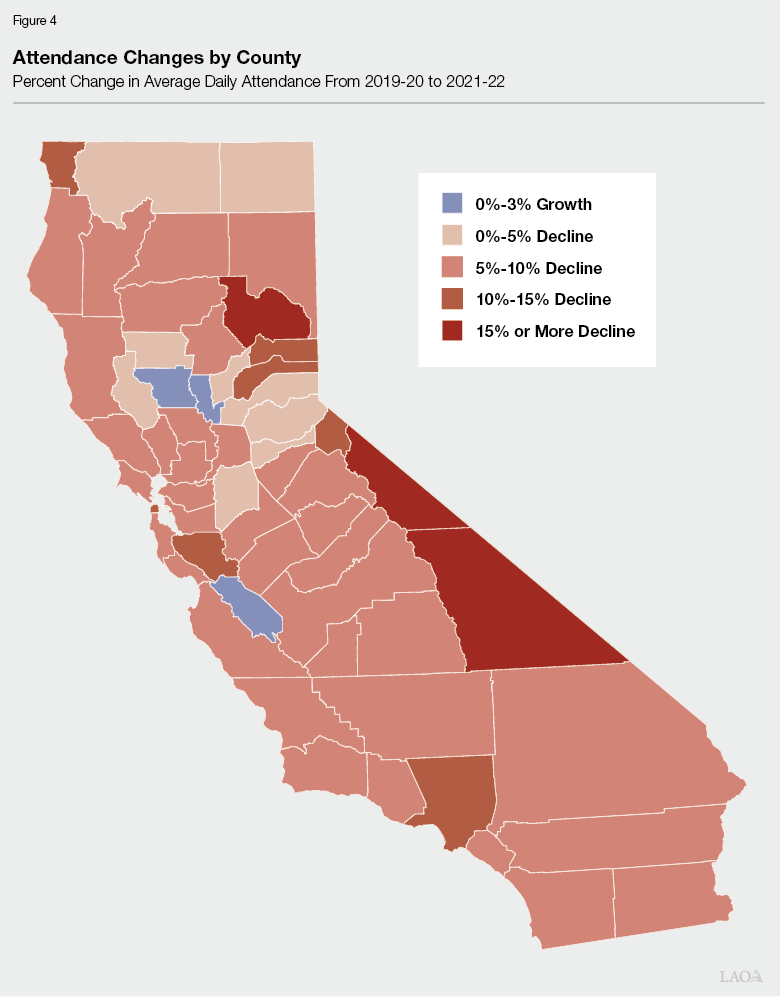
ADA Declines Differ by County. As Figure 4 shows, 55 of the 58 counties in California have experienced ADA declines during the pandemic. Of these 55 counties, 36 experienced two‑year declines between 5 percent and 10 percent. The counties that have experienced the largest ADA declines during the pandemic are small rural counties located in the Sierras and Northern California. Among more populous counties, San Francisco and Los Angeles Counties have had the largest declines (11.4 percent and 11.1 percent, respectively).
Issues for Consideration
In this section, we discuss a few key issues to provide greater context for the findings described above.
Most Recent Attendance Data Does Not Include Omicron Wave. The preliminary P‑1 data we discussed in this post includes attendance data through December, prior to the significant surge in COVID‑19 cases from the Omicron variant. Information from specific school districts suggests that attendance rates in January and February were significantly lower than in the fall due to COVID‑19 cases and associated quarantines. Attendance rates are likely to have rebounded in subsequent months, however, as the number of new COVID‑19 cases in the state returned to pre‑Omicron levels by late February.
Attendance Decline Will Have Different Impact on Districts and Charters. Assuming that attendance does not return to pre‑pandemic levels in 2022‑23, districts with declining attendance will begin to see declines in their LCFF apportionments in 2022‑23, as the attendance hold‑harmless is set to expire at the end of 2021‑22. If the Governor’s three‑year rolling average proposal is adopted, districts would see a smaller decline in funding than under current law. In contrast, charter schools are experiencing declines in their LCFF apportionment in the current year, but could see funding rebound if their attendance improves in 2022‑23.
Enrollment Declines Not Explained by Shift to Private Schools. Preliminary CDE data on 2021‑22 private school enrollment shows that enrollment at private schools increased from 527,500 in 2019‑20 to 540,700 in 2021‑22—a 2.4 percent increase (13,200 students). Although this marks a significant uptick in private school enrollment relative to historical trends, the overall growth in private school enrollment during the pandemic is relatively small compared with the decline in public schools (254,300 students).
Over the Long Term, State Likely to See Continued Declines in Enrollment. As the effects of the pandemic on schools continue to diminish, the state could see short‑term increases in enrollment in 2022‑23. However, the state’s school‑age population will likely continue to decline, as birth rates are projected to remain relatively low. Over the long term, this will likely result in continued declines in K‑12 student enrollment.
Conclusion
The preliminary 2021‑22 attendance data show much steeper declines than anticipated when the 2021‑22 budget was enacted. Lower attendance will likely result in lower baseline 2022‑23 LCFF costs than assumed in the Governor’s January budget. At this point, the Legislature has insufficient information to determine the long‑term trends in attendance. Some factors, such as absences related to COVID‑19, will become less significant over the next few years as the effects of the pandemic continue to subside. The implications of recent enrollment declines are more difficult to determine. Given enrollment declines are particularly large in the early grades, they could be primarily driven by the pandemic. Private school enrollment data also do not suggest large shifts in enrollment from public to private schools. These enrollment declines, however, have now occurred for two consecutive years and may suggest a steeper decline in enrollment than previously anticipated. The Legislature will want to continue to monitor attendance data as it decides how to best allocate school funding and consider whether changes should be made in response to these trends.