LAO Contact

January 9, 2023
The Local Control Funding Formula for
School Districts and Charter Schools
- Summary
- Introduction
- Components of Formula
- LCFF Implementation and Funding
- Local Control and Accountability Plans
- Conclusion
Summary
In 2013‑14, the state created the Local Control Funding Formula (LCFF)—a major change to the school finance system. The LCFF was intended to simplify school funding and distribute funding based on student demographics. School districts and charter schools receive most of their LCFF apportionment through a per‑student formula—based on average daily attendance (ADA)—that provides a base amount of funding by different grade spans. Almost one‑fifth of LCFF funding for school districts and charter schools is provided through two separate calculations based on the proportion of their student population that is an English learner, from a low‑income family, or a foster youth. The formula also includes a few add‑ons that remain from the previous funding system. (The state also retained a few other categorical programs, such as special education and child nutrition.) The 2022‑23 budget package provides $75.5 billion in LCFF funding, which represents about 80 percent of state funding for public schools. In this brief, we provide some historical background on LCFF’s implementation, describe how the formula works for school districts and charter schools, describe how the formula was phased in, and explain requirements for districts to adopt plans that describe how LCFF funding will be spent.
Introduction
Proposition 98 requires the state to annually set aside a minimum amount of General Fund and local property tax revenue for public schools and community colleges. Whereas Proposition 98 establishes a minimum funding level, the Legislature decides how to allocate this funding among school and community college programs. About 80 percent of Proposition 98 funding to public schools is allocated through the LCFF, which was established in 2013. In this brief, we discuss the LCFF for school districts and charter schools. For brevity, we refer to both as school districts throughout this brief unless otherwise noted. (We do not discuss the LCFF for county offices of education.)
LCFF Replaced System of Revenue Limits and Numerous Categorical Programs. Prior to LCFF, the state distributed about two‑thirds of school funding through revenue limits—general purpose grants that could be used for any educational purpose. Revenue limits were allocated to districts based on a per‑student rate (using student ADA), with the specific rate varying significantly by district. This variation was largely based on historical local levels of funding prior to the state becoming more involved in financing K‑12 education in the early 1970s. (The state took several steps to equalize rates in subsequent decades, but some variation in per‑student rates remained.) In addition to revenue limits, the state had more than 50 categorical programs. The level of categorical funding also varied significantly by district, as each categorical program had its own allocation formula and spending restrictions.
LCFF Was Intended to Address Flaws of Previous System. In the years leading up to LCFF, policy makers and researchers had concerns with the state’s K‑12 funding system. Most notably, there was a broad‑based consensus that the system was:
- Overly Complex. The system consisted of a myriad of programs, each with different allocation formulas and different spending requirements, which made tracking difficult for school districts.
- Antiquated. The allocation formulas for numerous programs were based on historical factors that no longer had relevance—which led to variation in funding across districts with no rationale.
- Inequitable. Although some funding was targeted to support specific student groups, such as low‑income students and English learners, the state’s school finance system as a whole was not well‑aligned to student need.
- Inefficient. Due to the multiple funding streams, districts often took a compliance‑oriented approach that did not attempt to coordinate activities across various programs.
- Highly Centralized. State restrictions limited districts’ ability to design educational programs based on local needs and priorities.
During the Great Recession, the state reduced funding for the majority of categorical programs and temporarily exempted districts from most categorical program spending requirements. As the state was coming out of the recession and categorical restrictions were scheduled to return, the Governor, Legislature, and stakeholders began to discuss options for reforming the existing system. In 2013, as part of the 2013‑14 budget package, the state replaced its general purpose grants and most categorical programs with the LCFF. The new funding formula is much simpler than the previous funding system, treats districts similarly, and provides dedicated funding to certain student populations with greater needs. The new system also gives districts more control over how to spend state funding, while also creating a local planning process that is intended to increase transparency and stakeholder engagement.
Components of Formula
As Figure 1 shows, school districts receive virtually all of their LCFF apportionment (about 98 percent) through a per‑student formula, with the remainder provided through several “add‑ons.” Schools pay for most of their general operating expenses (including employee salaries and benefits, supplies, and student services) using these funds. In this section, we describe how the formula works in more detail.
Figure 1
Overview of the Local Control Funding Formula
(In Billions)
|
Components |
Description |
2022‑23 Funding |
|
Base grant |
Provides a uniform level of funding per student in different grade spans. Includes two grade span adjustments—one for smaller class sizes in grades K‑3 and one to acknowledge costs of providing career technical education in high schools. Beginning in 2022‑23, also includes additional funding for students in transitional kindergarten. |
$60.8 |
|
Supplemental grant |
Provides an additional 20 percent of the adjusted base grant rate for each student that is an English learner, low income, or foster youth. |
7.5 |
|
Concentration grant |
Each English learner, low‑income student, and foster youth above 55 percent of enrollment generates an additional 65 percent of the adjusted base rate. |
5.5 |
|
Total, Main Components |
$73.8 |
|
|
Add‑ons |
Includes Targeted Instructional Improvement Block Grant, Home‑to‑School Transportation, Economic Recovery Target, Education Protection Account, and Minimum State Aid. |
$1.7 |
|
Total |
$75.5 |
Main Components
LCFF Is Based on ADA. The state allocates LCFF funding to school districts and charter schools based on their ADA—the average number of students in class each day throughout the school year. For funding purposes, the state credits school districts with their ADA in the current year, prior year, or the average of three prior years, whichever is higher. (The option to fund based on the average of three prior years was established in 2022‑23.) Charter schools, by contrast, are funded according to their ADA in the current year only.
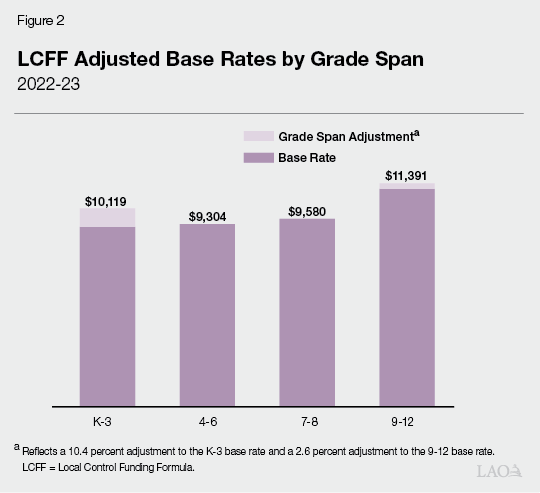
Base Grant Varies by Grade Span. As Figure 2 shows, school districts receive the bulk of their LCFF funding based on their ADA in four grade spans. (This includes two grade span adjustments that will be discussed in the next paragraph.) The base funding rates are higher for students in higher grade spans—reflecting generally higher costs of education at higher grade levels. Districts may use their base funding for any educational purpose. As described in the box below, the base grant calculations differ for attendance associated with certain small schools.
Base Grant Differs for Some School Districts With Necessary Small Schools
What Is a Necessary Small School? The Necessary Small Schools (NSS) program provides an alternative base grant funding methodology for districts with average daily attendance (ADA) of 2,500 or fewer that operate very small schools (less than 96 ADA for an elementary school or less than 286 ADA for a high school). To be classified as an NSS, schools also must demonstrate that (1) students who attend the small school would otherwise be required to travel relatively long distances from their home to attend school, or (2) geographic or other conditions (such as annual snowfall) make busing students an unusual hardship.
How Is Funding Determined for Necessary Small Schools? The NSS allocation uses funding bands based on the combination of a school’s ADA and its staffing levels, whichever provides the lesser amount. The number of full‑time teachers is used for elementary schools that serve students in grades K‑8, while the number of full‑time equivalent certificated employees is used for high schools. The funding bands for elementary schools are shown in the figure below. Districts receive NSS funding for their eligible schools in place of Local Control Funding Formula (LCFF) base grants, but they still receive LCFF base grant funding for all other schools in their district. Supplemental and concentration funding for NSS is calculated in the same way for all other ADA. As with the base grant, the NSS amounts are annually adjusted by the LCFF statutory cost‑of‑living adjustment.
Funding Bands for Necessary Small
Elementary Schools
2022‑23 Rates
|
Number of |
Average Daily |
Funding |
|
1 |
1‑24 |
$247,965 |
|
2 |
25‑48 |
490,709 |
|
3 |
49‑72 |
733,666 |
|
4 |
73‑96 |
976,409 |
Grade Span Adjustments for Early Elementary and High School Grades. The LCFF base rates include two specific grade span adjustments that increase the base rates, with the goal of maintaining some aspects of the previous finance system. The K‑3 adjustment increases the base rate for grades K‑3 by 10.4 percent. To receive this adjustment, districts must maintain average K‑3 class sizes of 24 students or fewer for each of their school sites—unless the district has a collective bargaining agreement for a higher class size. This adjustment reflects a state commitment to have relatively smaller classes in grades K‑3. Prior to the LCFF, the K‑3 Class Size Reduction program provided funding to districts for this purpose. Absent a related collective bargaining provision, a district could lose its entire K‑3 adjustment if at least one school site in the district has an average class size that is greater than 24. (Charter schools receive the K‑3 adjustment but are exempt from the class size requirement.) The adjustment for grades 9‑12 increases the base rate by 2.6 percent and was intended to account for the additional cost of providing career technical education to high school students—though this funding is not explicitly restricted for this purpose.
New Funding for Transitional Kindergarten Staffing Beginning in 2022‑23. As part of the 2021‑22 budget, the state enacted an increase in funding for transitional kindergarten attendance, set to begin in 2022‑23. (Transitional kindergarten is considered the first year of a two‑year kindergarten program and is therefore funded using the K‑3 base rates.) In addition to the funding generated through the base grant and K‑3 grade span adjustment, school districts will receive $2,813 per transitional kindergarten ADA. To receive this funding in 2022‑23, districts must maintain an average of 1 adult for every 12 students in transitional kindergarten classrooms at each school site. Beginning in 2023‑24, districts must maintain an average of 1 adult for every 10 students in their transitional kindergarten classrooms at each school site. Unlike the K‑3 adjustment, districts cannot collectively bargain for higher transitional kindergarten staffing ratios. (Charter schools can receive this adjustment, but unlike the K‑3 adjustment, must meet the transitional kindergarten staffing requirements to receive the funding.)
Supplemental Grant Funding Based on Proportion of English Learners/Low‑Income (EL/LI) Students and Foster Youth. The LCFF provides additional funds to districts based on the proportion of their students who are EL/LI (based on eligibility to receive free or reduced‑price school meals under a federal nutrition program) or foster youth. This proportion is commonly called the unduplicated pupil percentage. The additional funding is intended to recognize that, on average, these student groups typically require additional support to meet grade level standards. For each EL/LI student, a district receives a supplemental grant equal to 20 percent of the base grant (including the K‑3 and 9‑12 grade span adjustments). A student who is both EL and LI generates the same funding rate as a student who belongs to only one of these groups. (Because all foster youth also meet the state’s LI definition, we do not refer to them as a separate subgroup for the remainder of the brief.). For the purposes of calculating LCFF allotments, the state uses a three‑year rolling average of the district’s EL/LI percentage.
Concentration Grant Funding for Districts With Relatively High Shares of EL/LI Students. Districts serving a student population of more than 55 percent EL/LI also receive a concentration grant equal to 65 percent of the adjusted base grant for each EL/LI student above the 55 percent threshold. (A charter school’s concentration grant funding is calculated based on the proportion of EL/LI students in the district in which it resides, if it is lower.) Figure 3 illustrates how the concentration grant is calculated. The state adopted concentration grants in response to numerous studies that showed EL/LI students face greater educational challenges when they are enrolled in higher‑poverty schools. When LCFF was first enacted, the concentration grant amount was equal to 50 percent of the adjusted base grant. The 2021‑22 budget plan increased the concentration grant rate to 65 percent of the adjusted base grant.
Figure 3
Illustration of How Main LCFF Components Are Calculated
For a School District With 10,000 K‑3 ADA and an EL/LI Share of 75 percent
|
Grant Type |
Associated ADAa |
Rateb |
Funding |
Funding Per Total |
|
Base grant |
10,000 |
$10,119 |
$101,190,000 |
$10,119 |
|
Supplemental grant |
7,500 |
2,024 |
15,180,000 |
1,518 |
|
Concentration grant |
2,000 |
6,577 |
13,154,000 |
1,315 |
|
Totals |
$129,524,000 |
$12,952 |
||
|
aTotal ADA for base grant. For supplemental grant, consists of total ADA multiplied by EL/LI share. For concentration grant, consists of total ADA multiplied by 20 percent (the 75 percent EL/LI share minus 55 percent). Base grants reflect adjusted K‑3 base rate, supplemental grants reflect 20 percent of adjusted K‑3 base rate, and concentration grants reflect 65 percent of adjusted K‑3 base rate. |
||||
|
LCFF = Local Control Funding Formula; ADA = average daily attendance; and EL/LI = English learner/low income. |
||||
Districts Must Ensure “Proportionality” When Spending Supplemental and Concentration Grant Funds. A district must use their supplemental and concentration grant funding to proportionally increase or improve services for their EL/LI students, relative to the base amount of funding they receive. Statute also allows districts to use supplemental and concentration funding on a districtwide or schoolwide basis. The State Board of Education (SBE) is required to develop regulations implementing these provisions. The existing regulations allow districts to reflect their increase or improvement in services in quantitative or qualitative ways. Districts must report the total amount of supplemental and concentration funding they expect to receive, as well as describe how they plan to use their supplemental and concentration funding for the benefit of EL/LI students. They also must report how the proportional increase in supplemental and concentration grant meets a proportional increase in services for EL/LI students. If districts choose to use supplemental funding for a schoolwide or districtwide purpose, they must explain how this approach will benefit EL/LI students. Districts demonstrate adherence with these requirements through their Local Control and Accountability Plans (LCAPs), which we discuss in greater detail later in this brief.
Two Recent Changes Related to Supplemental and Concentration Grant Funding. Since the enactment of LCFF, the state made two notable changes related to how supplemental and concentration grant funding must be spent.
- Restrictions on Unspent Supplemental and Concentration Grants. Trailer legislation included in the 2021‑22 budget package introduced a new requirement that districts track their unspent supplemental and concentration grant funding and use the funding to increase or improve services for EL/LI students in future years. Prior to this change, districts could use unspent supplemental and concentration grant funding in subsequent years for any educational purpose.
- Use of Concentration Grant Funding for Staffing at High Needs Schools. When the state increased the concentration grant rate to 65 percent of the base grant, it also specified that the associated increase in funding must be used by school districts to increase the number of staff that provide direct services to students in schools where more than 55 percent of students are EL/LI.
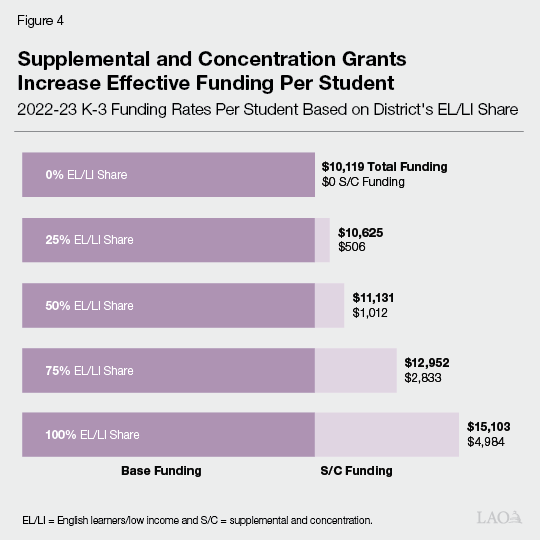
Effect of Supplemental and Concentration Grants on Per‑Student Funding. Supplemental and concentration grant funding provides higher levels of total LCFF funding per ADA for districts with higher proportions of EL/LI students. Figure 4 shows how variation in a districts’ EL/LI share affects their total per‑pupil funding. A district with an EL/LI share of 25 percent will receive an additional $506 per ADA from the supplemental grant (a 5 percent increase from the base rate). Comparatively, a district with an EL/LI share of 75 percent will receive $1,518 per ADA from the supplemental grant and $1,315 from the concentration grant—for a total of $2,833 in additional funding (a 28 percent increase from the base rate). This results in a district with an EL/LI share of 75 percent receiving 22 percent more funding per student than a district with an EL/LI share of 25 percent.
Statute Requires a Cost‑of‑Living Adjustment (COLA) for LCFF. The COLA rate is based on a price index published by the federal government. This index reflects changes in the cost of goods and services purchased by state and local governments across the country. State law provides an automatic COLA for LCFF unless the constitutionally required Proposition 98 funding level is insufficient to cover the associated costs. In these cases, the law reduces the COLA rate to fit within the available funding. The state applies the COLA to LCFF by increasing the grade span base rates, necessary small schools rates, and the transitional kindergarten staffing adjustment. These rate increases also result in proportional increases to the grade span adjustments and supplemental and concentration grants, since the value of these components are funded as a percentage of the base grant.
Add‑Ons to the Formula
In addition to the main components of the LCFF, the state also included several add‑ons to the formula. In this section, we describe three major add‑ons. A certain subset of school districts with relatively high local property tax revenue also benefit from other LCFF add‑ons. We discuss local property tax revenue and the associated add‑ons in the nearby box.
How Local Property Tax Revenue Affects Total LCFF Funding
LCFF Is Funded Through a Combination of State General Fund and Local Property Tax Revenue. The Local Control Funding Formula (LCFF) and add‑ons are used to determine a district’s total LCFF target. To meet each district’s target, the state first credits each district with its share of local property tax revenue. For the vast majority of school districts, local property tax revenue is insufficient to cover their total LCFF target. The state provides funding to cover the remaining amount.
School Districts With Local Property Tax Revenue Above Their LCFF Target Are Known as Basic Aid Districts. The term is derived from the section of the State Constitution guaranteeing all school districts at least $120 per student from the state. The property tax revenue in excess of their LCFF allotments is known as excess property tax revenue. Basic aid school districts can use their excess property tax revenue on their local education priorities. In 2021‑22, the state had 118 basic aid school districts (about 13 percent of all districts), with a statewide total of $1.2 billion in excess property tax revenues.
For Basic Aid Districts, Changes in Funding Are Driven by Property Taxes. For most districts, changes in LCFF funding are driven by changes in their average daily attendance (ADA); the per‑ADA base rates; and the share of their students that are English learners, low income, or foster youth. For basic aid school districts, changes in their LCFF allotments typically have no effect on funding. Rather, changes in funding are driven by changes in local property tax revenue. A district’s status as a basic aid district can change over time. For example, a basic aid district with local property tax revenue slightly above their LCFF target might no longer be basic aid if the state made large increases to the LCFF rates, resulting in the LCFF target exceeding local property tax revenue. Similarly, a school district can become basic aid over time if its local property tax revenue grows at faster rates than its LCFF target.
Basic Aid Districts Also Uniquely Benefit From Two Other Provisions. In addition to receiving excess property tax revenue above their LCFF targets, basic aid districts also receive additional funding due to two other provisions, discussed below.
Minimum State Aid. The legislation creating LCFF includes a provision that specifies no district is to receive less state aid from LCFF than it received in 2012‑13 from the pre‑existing programs that were replaced by LCFF. For most school districts, the state General Fund they receive for their LCFF targets is sufficient to meet this provision. Since basic aid districts do not receive state aid towards their LCFF target, the state must provide additional General Fund to meet this requirement. (Other school districts with relatively high property tax revenue also receive additional funding due to this provision.) In 2021‑22, the state provided $192 million in addition to the LCFF target to meet this provision.
Education Protection Account. Proposition 30 (2012) temporarily increased tax revenues and required the revenue to be deposited into the Education Protection Account (EPA). (Proposition 55 [2016] extended some portion of these tax increases to 2030.) The state allocates EPA funding to schools and community colleges as part of their primary funding formulas—LCFF in the case of school districts. The state must also must provide at least $200 per student from the EPA to all school districts, charter schools, and county offices of education and at least $100 per full‑time equivalent student to community college districts. For most school districts, EPA allocations count toward their LCFF targets and do not affect their individual funding levels. For basic aid school districts (and a few other districts with relatively high property tax revenue), the state must provide additional funding to meet this requirement. In 2021‑22, the state provided $64 million in EPA funding in excess of the LCFF targets.
Two Categorical Programs Remain as LCFF Add‑Ons. With the implementation of LCFF, funds from two pre‑existing categorical programs—the Targeted Instructional Improvement Block Grant (TIIG) and Home‑to‑School (HTS) Transportation program—were treated as add‑ons. Districts that received funding from these programs in 2012‑13 continue to receive that same amount of funding in addition to what the LCFF provides each year. Districts can use their TIIG funding for any educational purpose. Regarding the HTS add‑on, districts must spend at least as much on school transportation as they spent from state funds in 2012‑13. As long as districts meet this requirement, they can spend the HTS add‑on for any purpose. In 2021‑22, the TIIG and HTS add‑ons totaled $1.3 billion statewide.
2022‑23 Budget Included Changes to School Transportation Funding. The 2022‑23 budget package included two major changes to how the state funds school transportation. Beginning in 2023‑24, the existing HTS add‑on will receive the same COLA as the rest of LCFF. The budget also established a new funding stream, beginning in 2022‑23, for school districts and county offices of education (COEs) to be reimbursed for 60 percent of eligible transportation expenditures they reported in the previous year. (Charter schools are not eligible to receive this funding.) A district’s HTS add‑on would count towards meeting the 60 percent threshold. To qualify for this funding, districts and COEs must adopt local plans describing the transportation services they will provide for their students. These plans must prioritize transportation for students in grade 6 or below and LI students. For 2022‑23, the cost of the new transportation increases is estimated to be $637 million.
LCFF Also Provides Economic Recovery Target to Some Districts. Some districts were expected to receive less total LCFF funding than they would have received if the state had maintained its previous funding system and adjusted it for inflation. The state provided some of these districts with an Economic Recovery Target in addition to their base, supplemental, and concentration grants. This funding was phased in over seven years (from 2013‑14 through 2019‑20), and is now a permanent, fixed add‑on. Funding from the Economic Recovery Target can be used for any educational purpose. More than 120 districts (13 percent of districts statewide) receive funding through the Economic Recovery Target, for total costs of $61 million.
LCFF Implementation and Funding
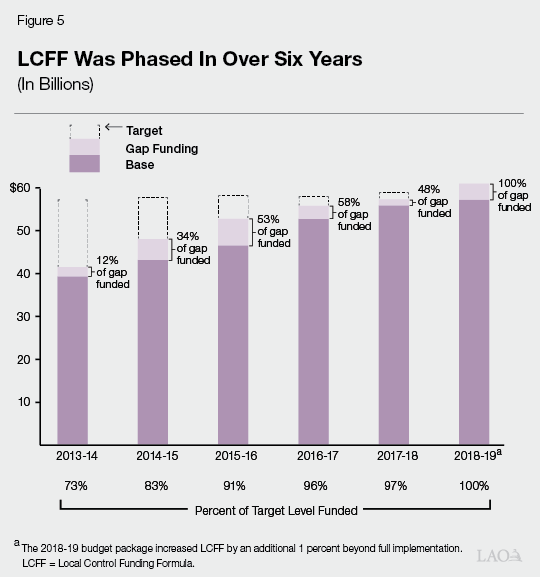
LCFF Was Phased In Over Multiple Years. When first enacted in 2013‑14, LCFF was estimated to cost $18 billion more than the previous funding system. In order to accommodate this increase, LCFF was to be implemented over a multiyear period using a transition formula that increased LCFF rates as more funding became available. The administration projected the state would fully fund LCFF by 2020‑21. As Figure 5 shows, LCFF was fully implemented by 2018‑19—two years ahead of schedule. This was largely due to greater‑than‑anticipated revenue increases during the period. In several instances, the state also has provided increases to the main LCFF components beyond COLA. Specifically, the state provided increases to LCFF beyond COLA of $570 million in 2018‑19, $520 million in 2021‑22, and $4.2 billion in 2022‑23.
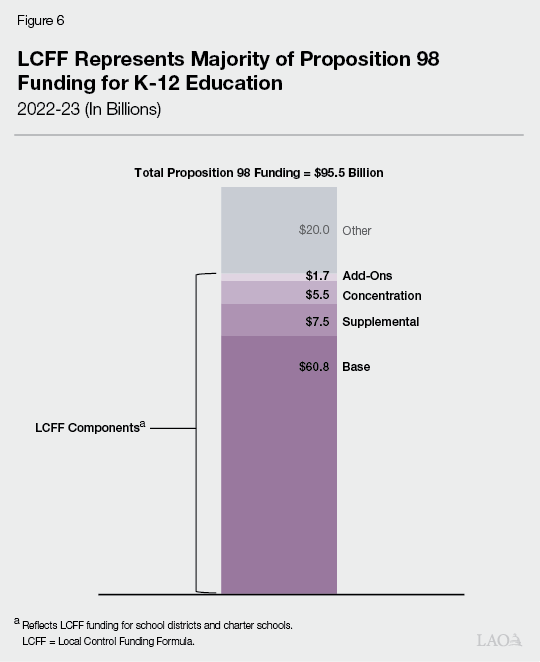
LCFF Now Represents About 80 Percent of School Funding. As Figure 6 shows, out of the $95.5 billion Proposition 98 funding provided to K‑12 education in 2022‑23, $75.5 billion went towards funding the LCFF for school districts and charter schools (about 80 percent). Outside of the LCFF, roughly half of the remaining funding is provided through two large categorical programs for special education ($6.1 billion) and providing before/after and summer school programs ($4 billion). Of the total LCFF funding, the state allocates 81 percent through base grants, 17 percent through supplemental and concentration grants combined, and 2 percent through the add‑ons.
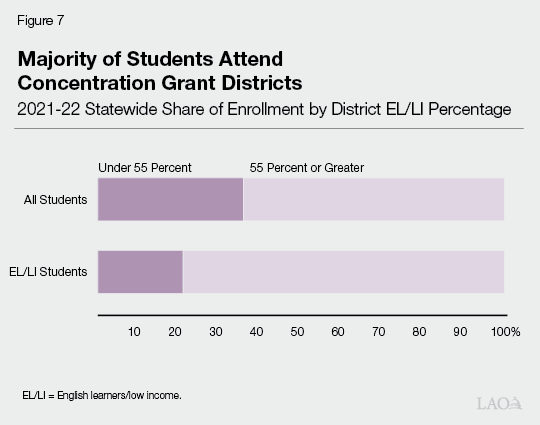
Most Students Attend Districts Receiving Concentration Grant Funding. In 2021‑22, 62 percent of the state’s 5.9 million students enrolled in public schools were classified as EL/LI students. As Figure 7 shows, about 64 percent of statewide enrollment is in districts with an EL/LI share of at least 55 percent. Figure 7 also shows that 79 percent of the state’s EL/LI students attend districts that receive concentration grant funding.
Local Control and Accountability Plans
In conjunction with creating the LCFF, the state established a new system of transparency and accountability centered around eight state priority areas. To provide transparency regarding how LCFF funding is spent, the state requires districts to adopt LCAPs. Districts must develop and adopt their LCAPs with specific requirements for stakeholder engagement. In their LCAPs, districts must set goals in the eight state priority areas and specify actions they will take to meet these goals. In this section, we discuss the specific requirements in more detail. (In this brief, we do not discuss the state’s system of accountability, which was developed in conjunction with LCAPs and is also based around the eight state priority areas.)
LCAPs Based on Eight State Priority Areas and Associated Performance Measures. The legislation enacting LCFF establishes a framework for LCAPs based around goals in eight state priority areas. Statute also directs SBE to address several implementation details, such as developing an LCAP template that all districts must use. As shown in Figure 8, some priority areas focus on academic success (such as student achievement and course access), while others address issues outside of academics (such as parental involvement and school climate). SBE also has established 13 performance measures in the state priority areas intended to monitor districts’ performance. As Figure 8 shows, seven of the performance measures are metrics that districts report to the state and are measured consistently statewide. The remaining six measures are local indicators for which districts report locally developed metrics or qualitative information describing their progress in the priority area. In addition to these required state and local measures, districts may include other performance measures in their LCAPs.
Figure 8
State Priority Areas and
Associated Performance Measures
|
State Measure |
Local Measure |
|
|
Basic Conditions of Learning |
||
|
Access to instructional materials, appropriately assigned teachers, and facility conditions |
X |
|
|
Implementation of State Standards |
||
|
Implementation of academic standards |
X |
|
|
Parent Engagement |
||
|
Parent and family engagement |
X |
|
|
Student Achievement |
||
|
English Language Arts assessment |
X |
|
|
Mathematics assessment |
X |
|
|
English learner progress |
X |
|
|
College and career readiness |
X |
|
|
Student Engagement |
||
|
High school graduation rate |
X |
|
|
Chronic absenteeism |
X |
|
|
School Climate |
||
|
Suspension rate |
X |
|
|
Local climate survey |
X |
|
|
Course Access |
||
|
Access to a broad course of study |
X |
|
|
Other Student Outcomes |
||
|
—a |
X |
|
|
aThe state has not adopted specific indicators that districts must use for this priority area. Districts may choose to include specific measures as part of their local planning process. |
||
Statute Requires Districts to Set Goals in State Priority Areas. For each of the state and local measures, statute requires districts to establish performance targets for all students and student subgroups and schools. (Statute identifies 13 student subgroups—eight racial and ethnic groups as well as English Learners, low‑income students, foster youth, students with disabilities, and homeless students.) Statute requires that districts establish these targets for the coming school year as well as the next two years.
Districts Must Specify Actions They Will Take to Achieve Goals. A district’s LCAP must specify the actions the district plans to take to achieve its goals. The specified actions must be aligned with the school district’s adopted budget. For example, a school district could specify that it intends to provide tutors to all EL students reading below grade level to improve its EL reclassification rate. To ensure the LCAP and adopted budget are aligned, the school district would be required to include sufficient funding for EL tutors in its adopted budget plan.
LCAPs Must Include Information on Services for EL/LI Students. As mentioned earlier in the brief, districts must include information demonstrating that they are increasing or improving services for EL/LI students in proportion to their supplemental and concentration funding. As part of these requirements, districts must provide justification for spending their supplemental and concentration funding for districtwide or schoolwide purposes.
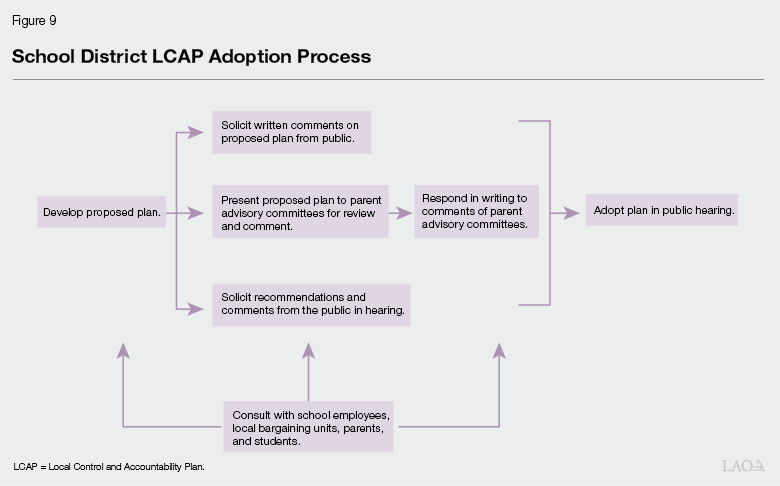
Districts Must Solicit Input From Various Stakeholders in Developing Plan. Figure 9 outlines the process a district must follow in adopting its LCAP. One of the main procedural requirements is that a district consult with its school employees, local bargaining units, parents, and students. As part of this consultation process, districts must present their proposed plans to a parent advisory committee and, in some cases, a separate EL parent advisory committee. (EL parent advisory committees are required if ELs comprise at least 15 percent of the district’s enrollment and the district has at least 50 EL students.) The advisory committees can review and comment on the proposed plan. Districts must respond in writing to the comments of the advisory committees. Consulting with students may include conducting student surveys, holding student forums, or working with student advisory committees. Districts also are required to notify members of the public that they may submit written comments regarding the specific actions and expenditures proposed in the LCAP.
LCAPs Must Include an LCFF Budget Overview for Parents and Guardians. Beginning in 2019‑20, districts must include in their LCAPs a short summary for parents and guardians. This summary must include projected total revenue for the upcoming fiscal year (including LCFF and other state, local, and federal funding), projected expenditures, and budgeted expenditures for planned actions and services. The summary must also break out LCFF funding by component type and provide estimates of current‑year expenditures to increase or improve services for EL/LI students. In addition, the overview must contain a brief description of the activities or programs supported by general fund expenditures that are not included in the LCAP.
Districts Must Adopt LCAPs Every Three Years and Update Them Annually. LCAPs are three‑year plans that school districts must update annually. Through a vote of their local governing board, districts must adopt (or update) their LCAP by July 1 every year, in conjunction with their annual budget adoption. Districts also are required to hold at least two public hearings to discuss and adopt (or update) their LCAPs. The district must first hold at least one hearing to solicit recommendations and comments from the public regarding expenditures proposed in the plan. It then must adopt (or officially update) the LCAP at a subsequent hearing.
COEs Must Review and Approve a School District’s LCAP. Each district must submit its LCAP to its COE for review. The COE must approve a district’s LCAP if it determines that (1) the LCAP adheres to the required template, (2) the district’s budgeted expenditures are sufficient to implement the strategies outlined in the LCAP, and (3) the LCAP adheres to the expenditure requirements for supplemental and concentration funding. As part of its review, the COE can then seek clarification from the district about the contents of its LCAP. If a COE seeks such clarification, a district must respond in writing. Based on a district’s response, the COE can submit recommendations for amendments to the LCAP back to the district. The district must consider any COE recommendations at a public hearing, but the district is not required to make changes to its plan. The annual deadline for approval or rejection of a district’s LCAP by a COE is October 8. Charter schools are not required to have their LCAPs reviewed and approved by a COE.
Conclusion
The state created the LCFF with many goals in mind: to simplify school finance, give more discretion to school districts, distribute funding more equitably based on student needs, and avoid a compliance‑oriented approach to operating programs. As the state approaches ten years since the LCFF was enacted, the Legislature may want to consider whether the LCFF has met these intended goals. Some effects, such as the simplification of the school finance system and greater local control, are easier to assess. Others, such as the effects on student outcomes, are more challenging to determine. Some preliminary studies (using pre‑pandemic data) suggest that the LCFF has resulted in improvements on standardized tests and graduation rates for EL/LI students, most notably in districts with high concentrations of EL/LI students. The Legislature may also want to consider whether changes to the formula could help in further meeting the intended goals. For example, the Legislature could evaluate whether the levels of funding for the main components of the formula (base, supplemental, and concentration grants) are distributed in a way that aligns with best practices for serving EL/LI students.