Ian Klein
November 7, 2024
UC Merced at 20:
Campus Developments and Key State‑Level Takeaways
Executive Summary
UC Merced Was Created to Accomplish Several Key Objectives. In the late 1980s, the University of California (UC) projected that enrollment demand would exceed systemwide enrollment capacity by the late 1990s. In response, the UC Board of Regents began exploring sites for a new campus. After considering several locations in the San Joaquin Valley, the board selected Merced as the location for the tenth UC campus. After years of constructing the campus and hiring personnel, UC Merced opened in fall 2004 for graduate students and fall 2005 for undergraduate students. In addition to expanding enrollment capacity for the UC system, UC Merced was intended to help raise educational and economic outcomes in the San Joaquin Valley. Prior to the opening of UC Merced, regional college‑going rates were low while regional poverty and unemployment rates were high.
Campus Has Grown Over Time. Total enrollment (undergraduates and graduate students combined) at UC Merced crossed the 5,000 student‑marker in fall 2011. By fall 2023, the campus had grown to approximately 9,100 students. Academic offerings have increased in tandem—growing from 9 undergraduate majors and 3 doctoral programs in 2005 to 27 undergraduate majors and 17 doctoral programs in fall 2023. The number of faculty and staff also has grown, with the campus having a total of approximately 2,500 employees in fall 2023. The campus has completed two major physical build‑outs. The initial build‑out resulted in about 1.5 million gross square feet (gsf) of academic and auxiliary space, whereas the second build‑out (occurring from 2016 through 2020) added about 1.3 million gsf of space (intended to support a campus of 10,000 students).
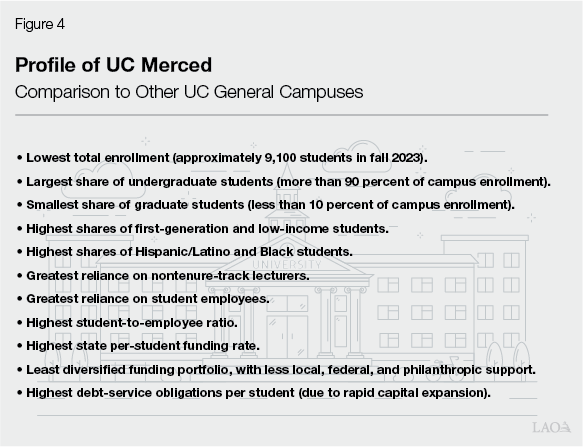
UC Merced Student Body Is Different From Other UC Campuses. UC Merced enrolls a higher share of undergraduates and lower share of graduate students than other UC campuses. Among its undergraduates, UC Merced enrolls the highest share of resident students and lowest share of students from other states and countries. The campus has the highest percentage of first‑generation students (students with at least one parent who does not have a bachelor’s degree) as well as the highest percentage of Pell Grant recipients. UC Merced is the only UC campus with a student body that is majority Hispanic/Latino. The campus also draws more heavily from the San Joaquin Valley than any other UC campus.
UC Merced Staff Differ From UC System. Compared to other UC campuses, UC Merced relies more on nontenure‑track lecturers for academic instruction. Among its tenured/tenure‑track faculty, it relies more on assistant professors (and less on associate and full professors). Relative to other UC general campuses, UC Merced hires substantially fewer academic support staff, whereas it hires substantially more student employees. UC Merced administrators indicate making these hiring decisions because they yield lower associated staffing costs and are thus more fiscally viable for a young campus. As a relatively small campus without the same economies of scale of the larger UC campuses, UC Merced continues to spend a larger share of its budget on institutional support and a smaller share on instruction and research.
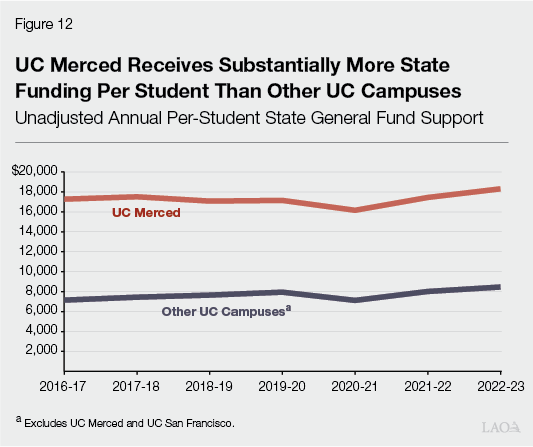
UC Merced Receives More State Funding Per Student Than Other UC Campuses. UC uses a formula known as the “rebenching formula” to allocate General Fund (excluding General Fund set‑asides for specific programs and one‑time allocations) to its campuses. The formula is meant to equalize state per‑student funding across campuses. UC Merced is excluded from this formula, as the campus has not yet reached the point where state support under the rebenching formula, its tuition revenue, and local resources are enough to cover its annual operating expenses. Compared to the other UC general campuses, UC provides UC Merced with approximately $10,000 more in state funding per student. In 2022‑23, UC Merced received $85 million more in state funding than it would have received under the rebenching formula.
Some UC Capacity Has Been Added Due to UC Merced but Growth Has Been Slow and Higher Cost. Since 2005, the UC system has added approximately 44,000 resident undergraduate slots. The 7,500 undergraduate slots created at UC Merced accounts for 17 percent of that growth. While contributing to the increase in UC enrollment capacity, UC Merced has repeatedly failed to meet its campus enrollment targets. Moreover, enrolling additional students at UC Merced comes with a higher state cost than enrolling additional students at the more established UC campuses. The $85 million in UC Merced funding above the rebenching formula equates to roughly an additional 10,000 students that could have been supported at the other UC general campuses, many of which had available capacity.
Certain Educational Outcomes in the San Joaquin Valley Continue to Lag Behind Statewide Averages. While more San Joaquin Valley high school students are now enrolling at a UC campus, with UC Merced accounting for the majority of that growth, certain regional educational outcomes continue to be relatively low. For instance, though college going rates have increased in the San Joaquin Valley, they have not increased as much as the statewide average. Similarly, the percentage of individuals with at least a bachelor’s degree in Merced County has increased, but also by less than the statewide average.
Regional Economic Indicators Show Mixed Results. It is unclear how much the campus has contributed to overall macroeconomic outcomes in the region. Both unemployment and poverty remain higher in the San Joaquin Valley when compared to statewide averages. Average wages for state‑government workers in Merced County, however, have seen a substantial increase since the opening of the campus (growing by nearly 70 percent, notably exceeding statewide wage growth). Employment growth in nonfarm occupations has also increased in Merced County, exceeding the statewide average, but falling behind other regions in the state.
Key State‑Level Takeaways May Be Learned From the UC Merced Experience. In many ways, UC Merced is like new campuses more generally. For at least their first several decades, new public university campuses are likely to experience slower enrollment growth than planned, rely more heavily on state funding, and devote more of their budgets to institutional support and facilities (and less to instruction and research). New campuses, in turn, are unlikely to be able to offer the same overall quality of academic program for decades. Moreover, new campuses are unlikely to generate significant economic impacts in the short term, beyond what might have been accomplished by other major state initiatives. Furthermore, studies have not determined whether the results produced by new campuses could be accomplished in more cost‑effective ways. These takeaways could help inform and guide the Legislature as it undertakes higher education planning moving forward.
Introduction
University of California (UC), Merced is the newest of UC’s ten campuses. It opened in 2004 for graduate students and 2005 for undergraduates. In fall 2023, it enrolled approximately 9,100 students. Located in the San Joaquin Valley, UC Merced is one of the larger employers in the region, with a total of approximately 2,500 faculty, staff, and student employees. The campus was added to the UC system with the intent to expand overall UC enrollment capacity as well as improve educational outcomes and increase economic activity in the San Joaquin Valley. In this report, we first provide relevant background, then review major campus developments to date. Next, we analyze the extent to which UC Merced has achieved its original objectives. Lastly, we highlight key takeaways for the Legislature as it undertakes higher education planning moving forward.
Background
UC Undergraduate Enrollment Grew Considerably From 1965 to 2005. In response to the post‑World War II population boom in California, two UC campuses were added in 1965—UC Irvine and UC Santa Cruz. At that time, the UC system enrolled approximately 53,000 undergraduate students, while the state’s population totaled just over 18.5 million. California’s population increased substantially from 1965 to 2005, growing to 35.8 million (almost doubling). Over the same period, as Figure 1 shows, UC’s undergraduate enrollment also grew substantially, increasing to approximately 158,000 students (almost tripling). It was the significant enrollment growth over this period that spurred interest in the development of an additional UC campus.
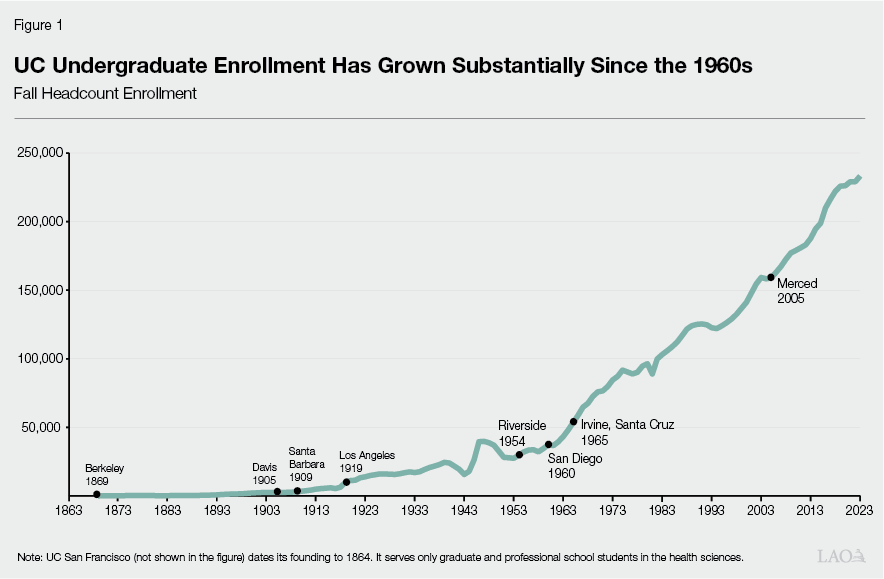
UC Merced Was Created in Part to Expand UC’s Enrollment Capacity. In 1988, the UC Board of Regents received updated campus enrollment plans that showed enrollment demand would exceed UC’s existing capacity by 1999. In response, the UC Board of Regents began exploring possible locations for opening a new campus. In 1993, the state enacted Chapter 567 (AB 47, Dills), which provided $1.5 million in bond funds for the purpose of preparing environmental impact reports related to the selection of a site for a new UC campus in the Central Valley region. After considering multiple locations in the San Joaquin Valley, the board selected the Merced site in 1995 to be the location of the tenth UC campus. To further increase enrollment capacity, the board in 2005 made UC Merced a referral campus for freshmen and transfer students who were not admitted to their UC campus of choice.
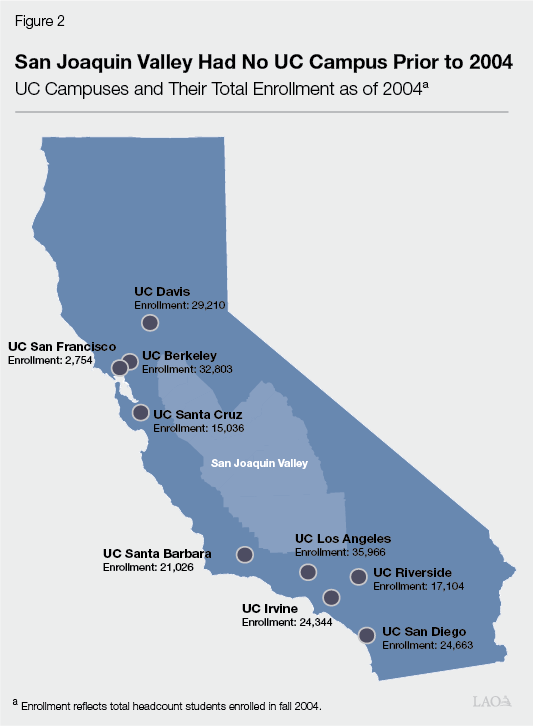
UC Merced Provides a UC Presence in the San Joaquin Valley. In the 1980s and 1990s, population growth in the San Joaquin Valley started to outpace statewide population growth. As a result of this accelerated growth, the San Joaquin Valley went from comprising 8.2 percent of California’s population in 1970 to 9.8 percent of the state’s population in 2000. In 2000, 12 community colleges and 3 California State University (CSU) campuses were located in the San Joaquin Valley. As Figure 2 shows, prior to UC Merced opening, the closest UC campuses to the San Joaquin Valley were located in the Bay Area, the greater Sacramento region, and Southern California.
UC Merced Is Intended to Raise Educational Outcomes in the Region. Having a UC presence in the San Joaquin Valley, in turn, was intended to improve overall college going, UC enrollment, and education attainment in the region. In the decades leading up to the creation of UC Merced, all of these educational outcomes in the San Joaquin Valley were relatively low. Based on data from 1999‑2002, college going (the percent of recent public high school graduates entering colleges and universities) in the San Joaquin Valley was 45 percent—5 percentage points lower than the state average. Even more notable, San Joaquin Valley public high school graduates were about half as likely to enroll in a UC campus compared to high school graduates statewide (3.5 percent compared to 8 percent). Similarly, in 2000, the percentage of San Joaquin Valley residents age 25 and older with a bachelor’s degree (as their highest degree) was far below the state average (9.7 percent compared to 17 percent), as was the percentage of San Joaquin Valley residents age 25 and older with a graduate or other advanced degree (4.5 percent compared to 9.5 percent). Providing another higher education campus—specifically a research institution—in the San Joaquin Valley was meant to address these regional gaps.
UC Merced Is Intended to Raise Economic Outcomes in the Region. Economic and employment outcomes in the San Joaquin Valley, which has an agricultural‑based economy impacted by seasonal variations, were also low in the decades leading up to the creation of the UC Merced campus. The unemployment rate for the San Joaquin Valley was nearly double the state’s average in the decade prior to the opening of the campus (averaging 11.9 percent compared to 6.3 percent). The unemployment rate specifically for Merced County was even higher (13.2 percent)—averaging more than double the state’s rate over that decade. The poverty rate for the San Joaquin Valley also exceeded that of the state average the decade prior to the opening of UC Merced (20 percent compared to 14 percent).
Growth Expectations for UC Merced Are Set Forth in Its Long Range Development Plan (LRDP). Every UC campus maintains an LRDP, which guides campus development by identifying enrollment, staffing, and space targets. An LRDP typically covers a 10‑ to 20‑year planning period, remaining in effect until it is replaced by an updated LRDP. As Figure 3 shows, UC Merced has been guided by three LRDP’s since its inception. The first LRDP guided the initial campus build‑out. The second LRDP centered around a doubling of campus space to accommodate a projected doubling of enrollment. The third LRDP is the active plan now guiding campus developments. UC Merced’s most recent LRDP projects that campus enrollment will reach 15,000 full‑time equivalent (FTE) students by 2030.
Figure 3
Growth of UC Merced Has Been Guided by Three Long Range Development Plans
Select Projections for Development of UC Merced
|
Year Plan Adopted |
2002 |
2009a |
2020 |
||
|
Initial Campus Build‑Out |
Merced 2020 Project |
Post‑2020 Development |
|||
|
Enrollment Projectionsb Aimed to reach approximately: |
|
|
|
||
|
Staff Projections |
|
|
|
||
|
Space Additions and Projectionsc |
1.5 million gross square feet (gsf), with capacity to support the first 5,000 students. |
An additional 1.3 million gsf, for total space of 2.8 million gsf, with capacity to support 10,000 students. |
An additional 1.7 million gsf, for total space of 4.5 million gsf, with capacity to support 15,000 students. |
||
|
aThe 2009 plan was amended in 2013, 2016, and 2017. bAll three of the Long Range Development Plans (LRDPs) set forth an enrollment level of 25,000 students at full implementation. cSpace projections are taken from the LRDPs as well as from a UC Merced Physical Operations report. Space additions in 2002 and 2009 include all completed projects from their respective LRDPs. Space projections for 2020 identifies the additional campus space to be added upon full development of the 2020 LRDP. |
|||||
Campus Developments
In this section, we review major developments over the past 20 years relating to UC Merced’s enrollment, student outcomes, faculty and staff, campus facilities, and finance. Figure 4 provides an overall profile of the campus drawing on the highlights of this section. Throughout this section, we provide various comparisons of UC Merced to the rest of the UC system. When making comparisons to the UC system, we exclude UC Merced, such that we are reflecting the average of all of the other UC campuses. For comparisons involving undergraduates, we compare UC Merced to the average of the other eight general UC campuses, excluding UC San Francisco (which serves only graduate and professional school students in the health sciences). For comparisons involving graduate students, we compare UC Merced to the average of all of the other UC campuses, including UC San Francisco.
Enrollment
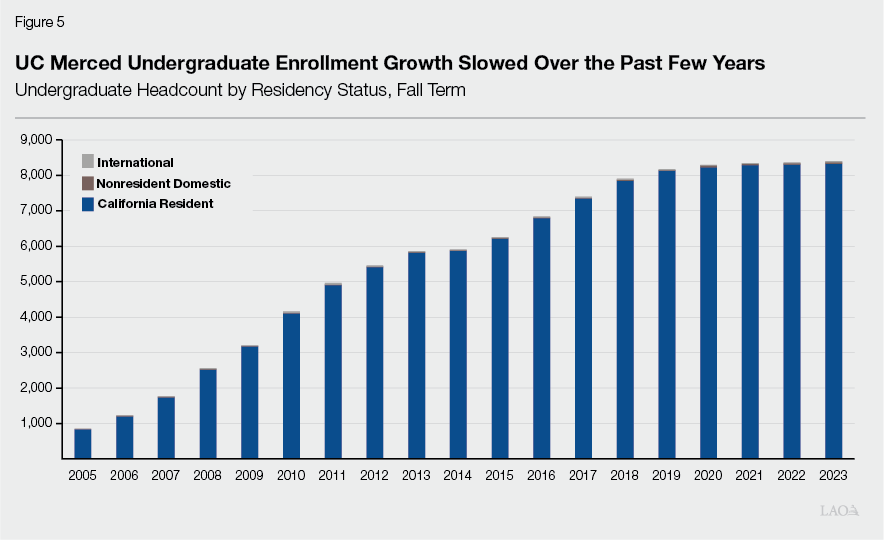
Campus Had Initial Undergraduate Growth Spurt, Followed by Slower Growth Over Past Decade. Figure 5 shows that UC Merced experienced rapid undergraduate enrollment growth from 2005 through 2013. Undergraduate enrollment also grew noticeably from 2013 through 2019, though the rate of growth was slower. Over the past five years, undergraduate enrollment has been nearly flat. Whereas it took the campus seven years for its undergraduate enrollment to reach 5,000 students, it still has not reached the 10,000 mark after nearly 20 years.
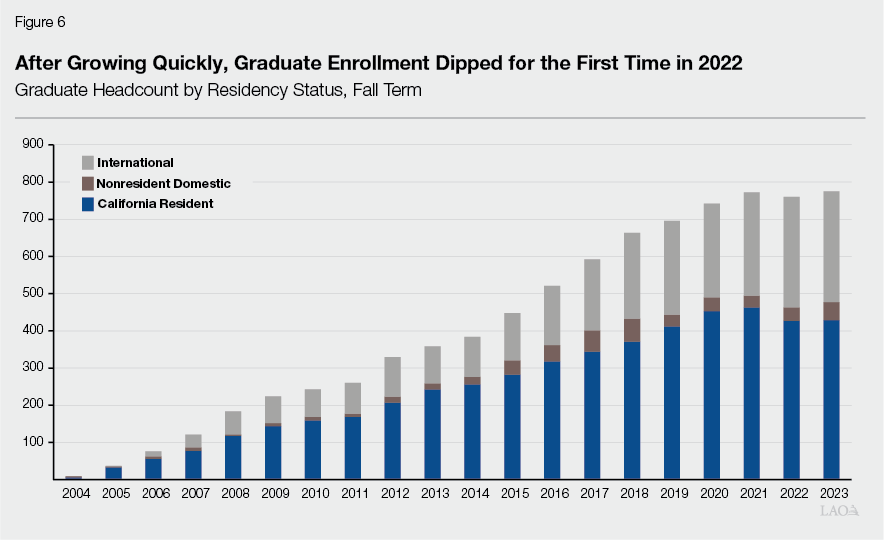
Graduate Enrollment Grew Steadily Until Past Few Years. Figure 6 shows that graduate enrollment at UC Merced grew notably from 2004 through 2021. In fall 2022, graduate enrollment dropped for the first time (from its previous peak of 772 students), though the drop was small. Graduate enrollment rebounded in fall 2023. The campus continues to aspire to have its graduate enrollment reach 10 percent of its total enrollment. In fall 2023, graduate enrollment comprised 8.5 percent of its total enrollment. Across the rest of the UC system, graduate enrollment exceeds 20 percent of total enrollment.
UC Merced Undergraduates Differ From UC System. As Figure 7 shows, the undergraduate student body at UC Merced differs in marked ways from the rest of the UC system. Compared to the UC system, UC Merced’s student body has much higher shares of California residents, first‑generation students (that is, students with at least one parent who does not have a bachelor’s degree), and Pell Grant recipients. A deeper look at students by household income shows that UC Merced’s student population has the lowest income distribution. For example, in 2022‑23, 46 percent of UC Merced undergraduates had household incomes less than $60,000, compared to a UC system average of 31 percent. Fifteen percent of UC Merced undergraduates had household incomes greater than $180,000, compared to a UC system average of 29 percent. UC Merced also has a much higher shares of Hispanic/Latino students and Black students. Additionally, San Joaquin Valley participation is much higher at UC Merced compared to the rest of the UC system.
Figure 7
UC Merced Undergraduates Differ Considerably
From Rest of UC System
Undergraduate Student Profile, Fall 2023
|
UC Merced |
Other UC Campusesa |
|
|
Student Demographics |
||
|
California residents |
99% |
84% |
|
First‑generation students |
64 |
36 |
|
Pell Grant recipientsb |
61 |
33 |
|
Student Race/Ethnicity |
||
|
Hispanic/Latino |
54% |
26% |
|
Asian |
27 |
36 |
|
White |
9 |
21 |
|
African American |
9 |
5 |
|
International |
— |
9 |
|
Otherc |
2 |
4 |
|
San Joaquin Valley Participationd |
||
|
Applications |
14% |
5% |
|
Admissions |
14 |
6 |
|
Enrollees |
30 |
6 |
|
aReflects average of other UC campuses, excluding UC Merced and UC San Francisco bFall 2022 data (most recent data available). cIncludes American Indian and Pacific Islander as well as those who did not identify their dReflects data for freshmen. Shows the share of applications, admissions, and enrollees |
||
Small Percentage of Students From Referral Pools Enroll at UC Merced. As a referral campus, freshman applicants not admitted to any of their UC campuses of choice are admitted to UC Merced. Only a small fraction of freshman applicants referred to UC Merced end up enrolling at the campus. From fall 2014 through fall 2022, a total of more than 150,000 students were placed into the freshman referral pool, and only 2,165 students (1.4 percent) from that pool enrolled at UC Merced. The trend has been similar for transfer referral students. Since 2005, 3.8 percent of the transfer referral pool has enrolled at UC Merced. (Whereas UC Merced is the only referral campus for freshmen, UC Riverside and UC Santa Cruz also serve as referral campuses for transfer students. Since 2005, 11 percent of the transfer students referred to UC Riverside enrolled at that campus and 27 percent referred to UC Santa Cruz enrolled at that campus.)
UC Merced Graduate Student Body Also Differs From UC System. The racial/ethnic composition of the graduate student body at UC Merced also differs from the rest of the UC system. Like UC Merced’s undergraduate student body, its graduate student body also has larger shares of Hispanic/Latino and African American students. In fall 2023, UC Merced’s graduate student body was 23 percent Hispanic/Latino and 8 percent were African American, compared to 15 percent Hispanic/Latino and 5.9 percent African American across the rest of the UC system. UC Merced’s graduate student body had a smaller share of white students and about the same share of Asians as the rest of the UC system.
Student Outcomes
Undergraduate Persistence Rates Are Lower at UC Merced Than UC System. Persistence rates for freshmen are lower at UC Merced compared to the UC system average. From 2005 through 2022, the persistence rate from freshman‑to‑sophomore year averaged 83 percent at UC Merced, compared to a UC system average of 93 percent. First‑year persistence rates for transfer students were higher than for freshmen at UC Merced, averaging 87 percent over this period. This rate, however, still fell below the UC system average transfer persistence rate of 93 percent. (At the end of this section, we identify a few factors that might explain why student outcomes at UC Merced are worse than the UC system averages.)
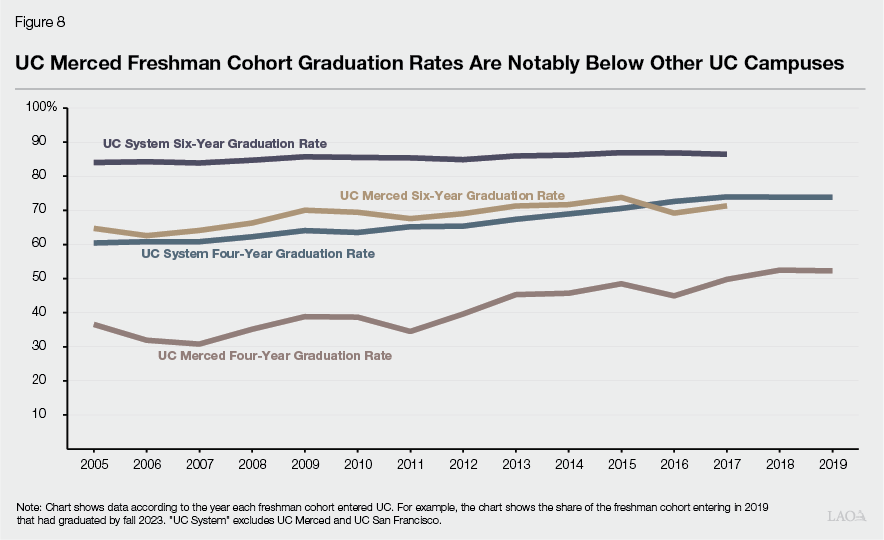
Undergraduate Graduation Rates at UC Merced Are Lower Than UC System. As Figure 8 shows, freshman cohort graduation rates at UC Merced also fall below the UC system average. While the four‑year graduation rate for freshman cohorts at UC Merced generally has improved over time, it is still more than 20 percentage points below the UC system average (52 percent compared to 74 percent for the 2019 cohort). UC Merced’s six‑year graduation rate has modestly improved since the campus opened, but it too is still substantially lower than the UC system average (71 percent compared to 86 percent for the 2017 cohort). For a few years, graduation rates of transfer students at UC Merced compared favorably to other UC campuses. For the transfer cohorts entering in 2013 through 2017, the three‑year transfer graduation rate for UC Merced nearly equaled the average of other UC campuses. Transfer graduation rates at UC Merced, however, have dropped below the UC system average for more recent transfer cohorts. For the most recent transfer cohort (entering in fall 2020), the three‑year graduation rate was 68 percent at UC Merced, compared to a UC system average of 83 percent.
Time‑to‑Degree for Undergraduates Is Shortening but Is Still Longer Than UC Average. At UC Merced, freshman cohorts on average take longer to graduate than their peers across the rest of the UC system (4.3 years compared to 4.1 years for the 2016 freshman cohort). Since the campus opened in 2005, time‑to‑degree for freshmen at UC Merced has consistently been longer than the UC system average. The same basic trend holds for transfer students, with the 2016 transfer cohort taking an average of 2.5 years to graduate at UC Merced, compared to 2.4 years across the UC system. In addition to taking longer to graduate, both freshmen and transfer students at UC Merced accumulate more academic units than their UC peers. For the 2017 freshman cohort, students accumulated an average of 8.1 more units at UC Merced than the UC average. For the 2017 transfer cohort, students accumulated 13 more units at UC Merced than the UC average.
Students of All Racial/Ethnic Groups Have Worse Outcomes at UC Merced Than UC System. As Figure 9 shows, freshmen and transfer students across racial/ethnic groups on average perform worse at UC Merced compared to their UC peers. For example, Asian students have a lower first‑year retention rate at UC Merced (87 percent) than they have across the rest of the UC system (95 percent). Similarly, among freshman cohorts, white students have lower four‑year graduation rates at UC Merced (44 percent) than they have across the rest of the UC system (71 percent). Among transfer cohorts, Hispanic/Latino students have lower two‑year graduation rates at UC Merced (42 percent) than the UC average (52 percent). African‑American freshman cohorts at UC Merced also perform worse across all the measures shown in the figure than their African‑American peers across the UC system.
Figure 9
All Student Racial/Ethnic Groups Perform Worse at
UC Merced Than at Other UC Campuses
Select Outcomes by Student Race/Ethnicity
|
First‑Year Retentiona |
Four‑Year Graduationb |
Six‑Year Graduationc |
||||||
|
UC Merced |
UC System |
UC Merced |
UC System |
UC Merced |
UC System |
|||
|
Freshmen Students |
||||||||
|
Asian |
87% |
95% |
46% |
76% |
75% |
89% |
||
|
White |
82 |
93 |
44 |
71 |
69 |
87 |
||
|
Hispanic/Latino |
81 |
89 |
39 |
55 |
65 |
78 |
||
|
African‑American |
81 |
90 |
38 |
52 |
65 |
76 |
||
|
First‑Year Retentiona |
Two‑Year Graduationd |
Three‑Year Graduatione |
||||||
|
UC Merced |
UC System |
UC Merced |
UC System |
UC Merced |
UC System |
|||
|
Transfer Students |
||||||||
|
Asian |
90% |
94% |
38% |
54% |
74% |
84% |
||
|
White |
87 |
93 |
38 |
59 |
73 |
84 |
||
|
Hispanic/Latino |
87 |
92 |
42 |
52 |
70 |
80 |
||
|
African‑Americanf |
n/a |
91 |
n/a |
46 |
n/a |
74 |
||
|
aAverage from 2005 through 2022. bAverage for 2005 through 2019 freshman cohorts. cAverage for 2005 through 2017 freshman cohorts. dAverage for 2005 through 2021 transfer cohorts. eAverage for 2005 through 2020 transfer cohorts. fUC Merced’s cohort sizes for this group were too small for comparative analysis. |
||||||||
|
Note: “UC System” excludes UC Merced and UC San Francisco. |
||||||||
|
n/a = not available. |
||||||||
Pell Grant Recipients Also Have Worse Outcomes at UC Merced Than UC System. Of all UC campuses, UC Merced’s undergraduate student body has the highest share of Pell Grant recipients. In the 2021‑22 academic year, 61 percent of UC Merced’s undergraduates were Pell Grant recipients, whereas the UC campus with the next largest share was UC Riverside at 49 percent. Since the opening of the campus, Pell Grant recipients at UC Merced have had a first‑year retention rate that is 9 percentage points lower, a four‑year graduation rate that is 20 percentage points lower, and a six‑year graduation rate that is 17 percentage points lower than the UC Pell Grant recipient system average.
Graduate Student Outcomes at UC Merced Are Improving but Still Generally Are Lower Than UC System. Doctoral students entering UC Merced from 2008 through 2010 had a two‑year retention rate of 83 percent, a four‑year retention rate of 68 percent, and an eight‑year completion rate of 62 percent. All of these rates have improved for subsequent cohorts of doctoral students. Doctoral students entering UC Merced in 2014 and 2015 (the most recently reported cohort), however, still had rates that were lower than the rest of the UC system. For this cohort, UC Merced had a two‑year retention rate of 90 percent, compared to a UC system average of 93 percent; a four‑year retention rate of 75 percent, compared to a UC system average of 83 percent; and an eight‑year completion rate of 66 percent, compared to a UC system average of 71 percent. Despite these rates falling below the UC average, doctoral students at UC Merced have been completing their degrees in less time. For students graduating in 2019, 2020, and 2021, time‑to‑doctorate at UC Merced averaged 5.6 years compared to 6.1 for the other UC campuses.
Student Outcomes Likely Are Worse Due to Student and Institutional Factors. UC Merced likely has worse student outcomes than UC system averages in part because of the composition of its student body. Research across higher education settings generally finds that the average educational outcomes of certain student groups, including first‑generation students and low‑income students, are worse compared to their peers. UC Merced has particularly high shares of these student groups. Student demographics (and related underlying issues), however, are unlikely to tell the full story. Some institutional factors, such as fewer student support staff, also could contribute to worse outcomes. (We discuss institutional factors in the next few sections.)
Faculty and Staff
UC Merced Has Increased Its Academic Offerings Over Time. When UC Merced launched undergraduate instruction in fall 2005, it offered nine undergraduate majors across three schools: the School of Engineering; the School of Natural Sciences; and the School of Social Sciences, Humanities and Arts. As the campus’s undergraduate enrollment has grown, the number of majors offered has increased, with the campus offering 20 undergraduate majors in 2013 and 27 majors in 2023. The campus plans to offer four new majors beginning in fall 2024, bringing the total number of undergraduate majors offered to 31. Similar to the growth of undergraduate academic offerings, the campus has been increasing the number of graduate degree programs it offers. Over the past ten years, the campus has grown from 6 to 17 doctoral program offerings. The campus also has some master’s degree programs, though many of those programs are offered only to matriculated doctoral students (effectively allowing students to earn a master’s degree while working toward their doctoral degree).
UC Merced Has Increased Its Faculty and Staff Over Time. As the student population at UC Merced has increased, there has been a corresponding increase in the number of faculty and staff. When UC Merced opened for undergraduate instruction in fall 2005, the campus employed 45 FTE tenured/tenure‑track faculty members and 19 nontenure‑track faculty members (mostly lecturers). By fall 2023, the campus employed 275 FTE tenured/tenure‑track faculty members and 153 nontenure‑track faculty members. In fall 2023, slightly more than half of all FTE faculty taught in the School of Social Sciences, Humanities and Arts; nearly 30 percent taught in the School of Natural Sciences; and the rest taught in the School of Engineering. Over the past 20 years, faculty growth has been greatest in the School of Social Sciences, Humanities and Arts. Beyond faculty, other campus staff have also increased in number over time. Whereas the campus employed approximately 1,120 FTE staff in 2011‑12, it employed nearly double that number in 2022‑23 (approximately 2,200 FTE staff).
Composition of Faculty Differs From UC System. As Figure 10 shows, one notable difference is that the percentage of tenured faculty at UC Merced is roughly half that of the UC system (based on data from fall 2011 through fall 2022). Moreover, UC Merced employs a higher share of professors at the assistant level (rather than the associate or full professor level) compared to the UC system, as doing so is more financially viable for a young campus. Beyond these trends, UC Merced employs a much higher share of nontenure‑track lecturers—roughly triple that of the UC system (from fall 2011 through fall 2022). Lecturers also have the budgetary benefit of costing less than tenured/tenure‑track professors. (In the “Finance” section of this report, we discuss why UC Merced faces greater fiscal challenges than other UC campuses.)
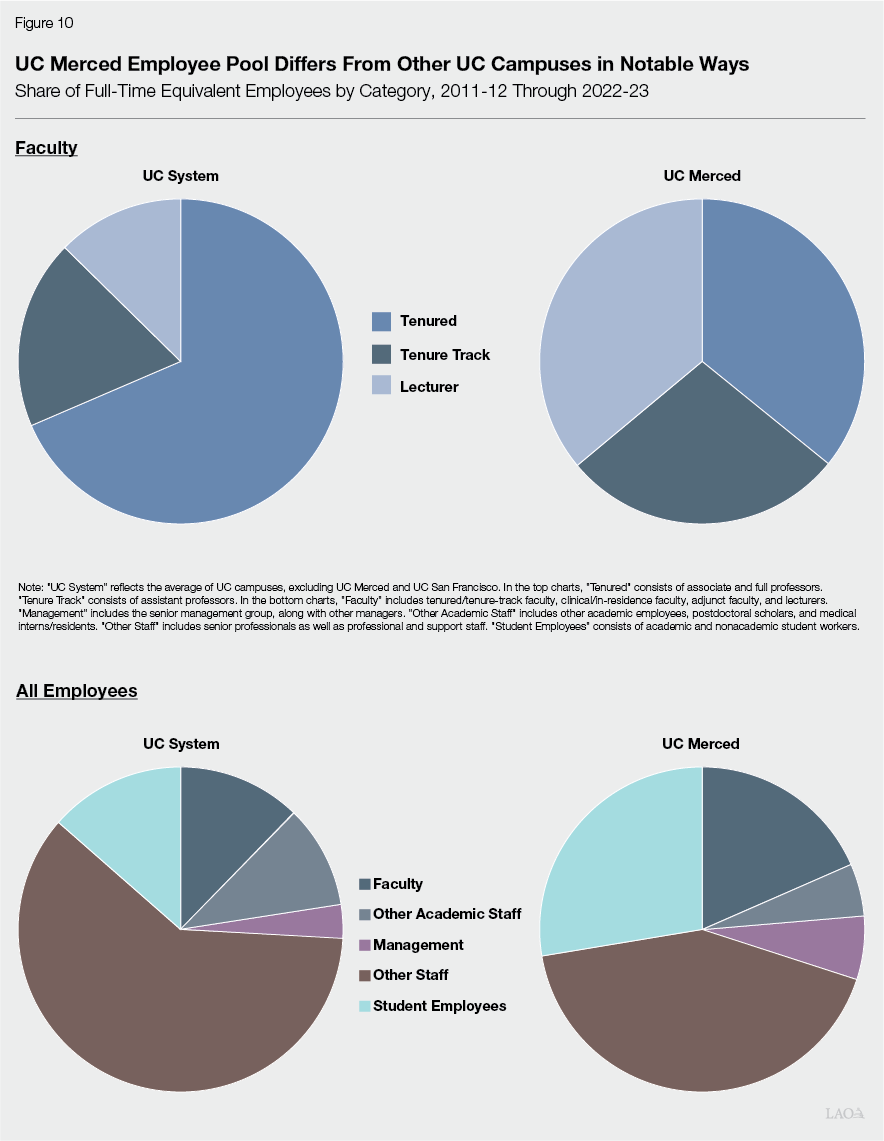
Composition of Staff Also Differs From UC System. Compared to the rest of the UC system, UC Merced relies more heavily on student employees in lieu of professional personnel. UC Merced administrators indicate that relying on student employees has the dual benefits of providing income to students to help them cover their college expenses while also helping reduce the campus’s operating expenditures given student employees are lower cost.
Student‑Employee Ratios Differ From System Averages. From 2011‑12 through 2022‑23, UC Merced maintained a noticeably higher student‑to‑employee ratio for several employee categories. The student‑to‑faculty ratio at UC Merced (19:1) exceeded that of the UC system (15:1) over this period. Among other employee groups, the greatest difference was for academic support staff (nonfaculty, nonstudent staff). UC Merced’s student‑to‑employee ratio in this category was 69:1 compared to 18:1 for the UC system. UC Merced administrators indicate that its notably higher student‑to‑employee ratio also is due to its fiscal challenges.
Employee Retention at UC Merced Is Similar to UC System. For faculty, the annual voluntary turnover (resignation) rate at UC Merced has averaged just under 2 percent over the last five years. UC Merced administrators indicate this rate is slightly above that of the UC system over the same period. One reason cited for its higher faculty separation rate is its greater reliance on assistant professors, which tend to have higher separation rates than associate and full professors. UC Merced administrators also indicate that it regularly loses some of its faculty to other institutions with greater name recognition. For career staff positions, UC Merced retains staff at about the same rate as the overall UC system. From 2012 through 2021, UC Merced averaged an 8.6 percent separation rate compared to a 9 percent separation rate across the rest of the UC system.
UC Merced Administrators Highlight Some Recruitment Issues. UC Merced administrators indicate the campus has both recruitment advantages and challenges. One recruitment advantage is the Merced region’s relatively affordable housing rates. The U.S. Department of Housing and Urban Development produces an annual report on market rents that shows Merced County remains one of the more affordable housing areas in California. Administrators also indicate the campus tends to be able to fill its vacancies with little difficulty as a result of the UC name brand. They mention the lack of certain amenities in the region, however, as recruitment drawbacks. Specifically, they cite the region’s lack of high‑quality elementary and high schools, limited access to high‑quality health care, and limited access to recreational and cultural amenities as reasons why some candidates chose to not accept employment offers at UC Merced.
Campus Facilities and Utilization
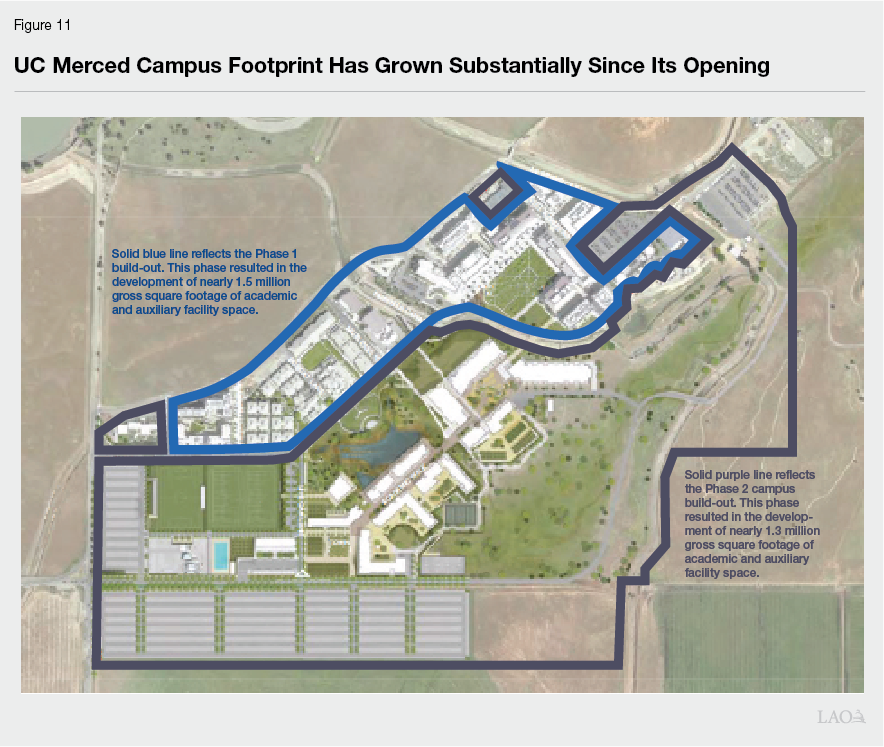
UC Merced Has Undergone Two Major Phases of Campus Build‑Out to Date. Figure 11 shows the areas of campus developed under each of these first two phases. Stage 1 represented the initial campus build‑out as outlined in the 2002 LRDP. The construction of these facilities took place from before the campus opened in 2004 through 2016. During this period, the campus added nearly 1.5 million gross square footage (gsf) of space, accounting for state‑supported and auxiliary facilities combined. (Auxiliary facilities include student housing, parking, and dining facilities.) The initial campus build‑out cost $737 million ($530 million for academic facilities and $207 million for auxiliary facilities). Stage 2 was set forth in the 2009 LRDP, with construction occurring from 2016 through 2020. The expansion during this period resulted in a near doubling of the campus’s gsf—adding 1.3 million gsf of academic and auxiliary space combined. This second phase of growth cost an estimated $1.2 billion ($772 million for academic facilities and $395 million for auxiliary facilities).
Facility Utilization Currently Is Below Legislative Standards. Prior to the second phase of the campus’s build‑out, UC Merced’s utilization of its classroom spaces was generally close to reaching legislative standards whereas its utilization of teaching laboratory spaces exceeded those standards. With the major build‑out that occurred between 2016 and 2020, the campus’s facility utilization has fallen below legislative standards. The most recent facility utilization report (2022) reported average classroom utilization at 79 percent of legislative standards and average teaching laboratory utilization at 87 percent of legislative standards.
UC Merced Housed Nearly Half of Its Student Population in Fall 2023. In 2005, UC Merced brought eight student housing facilities online, providing accommodations to a total of 874 students. By fall 2023, the campus had 18 housing facilities with a total of 4,367 beds, housing 45 percent of its student population. Nearly all of the students living on campus are undergraduates, with fewer than 20 graduate students living on campus. As of spring 2023, UC Merced housed a larger share of its students than the average of the other UC general campuses (38 percent). Like other UC campus housing programs, UC Merced’s housing program was entirely self‑supported (that is, funded from user fees) from its inception through 2022‑23.
State Recently Approved Funding for Additional Academic and Student Housing Projects. The state recently approved funding for three major new capital projects at UC Merced. All three projects are to be financed using UC bonds, with the state covering the associated debt service payments over the next approximately 30 years. One project, authorized by Chapter 23 of 2019 (AB 74, Ting), is construction of a medical education facility. This project is estimated to have a total cost of $300 million (covered by $243 million state General Fund and $57 million nonstate funds). Beginning in 2024‑25, the state is providing $14.5 million to make associated annual debt service payments. A second project, authorized by Chapter 38 of 2023 (AB 102, Ting), is construction of a new classroom and office building. This project costs a total of $95 million (all state support), with the state providing $6.3 million annually to make associated debt service payments. The project is estimated to add 60,000 gsf, with space designated for larger lecture halls as well as student support and faculty spaces. The third project, authorized by Chapter 50 of 2023 (SB 117, Committee on Budget and Fiscal Review), is an intersegmental student housing project involving UC Merced and Merced College. It cost a total of $100 million (all state support). This project will result in an additional 478 affordable beds, with 60 percent of these beds reserved for UC Merced students and the rest reserved for Merced College students. Associated debt service is estimated at $7.1 million annually.
Finance
Most UC Campuses Receive a Uniform Amount of State Funding Per Student. UC uses a formula to allocate state General Fund among most of its campuses (excluding General Fund set‑asides for specific programs and one‑time allocations). Designed to equalize per‑student funding across campuses, the current approach, known as the “rebenching formula,” was phased in over six years (from 2012‑13 through 2017‑18). The formula allocates funding based on the number and type of students that campuses educate, with the same amount per type of student provided to every campus. The rebenching formula currently applies to all UC campuses except the UC San Francisco and UC Merced campuses. UC excludes the San Francisco campus due to its unique student population and mission, whereas it excludes UC Merced because it cannot yet cover its annual operating costs without additional state support.
UC Funds Merced Campus at a Higher Per‑Student Funding Rate. As Figure 12 shows, UC Merced receives approximately $10,000 more per student than the amount of per‑student funding provided by the rebenching formula used for the other general campuses. UC has indicated that once UC Merced reaches “self‑sufficiency,” the campus will transition to being funded according to the rebenching formula. UC Merced will remain funded using the current add‑on approach until at least 2031, at which time UC will reassess the campus’s progress toward self‑sufficiency. The UC Office of the President (UCOP) indicates that it will deem UC Merced self‑sufficient when the campus’s enrollment has grown such that its tuition revenue together with state support under the rebenching formula and any local resources are sufficient to cover its annual operating expenditures.
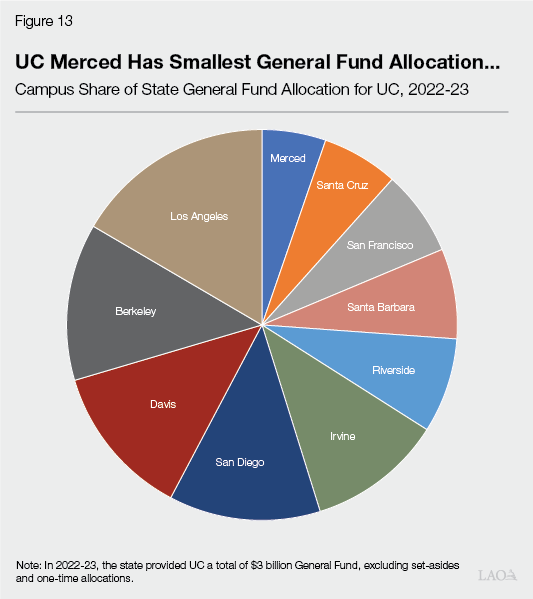
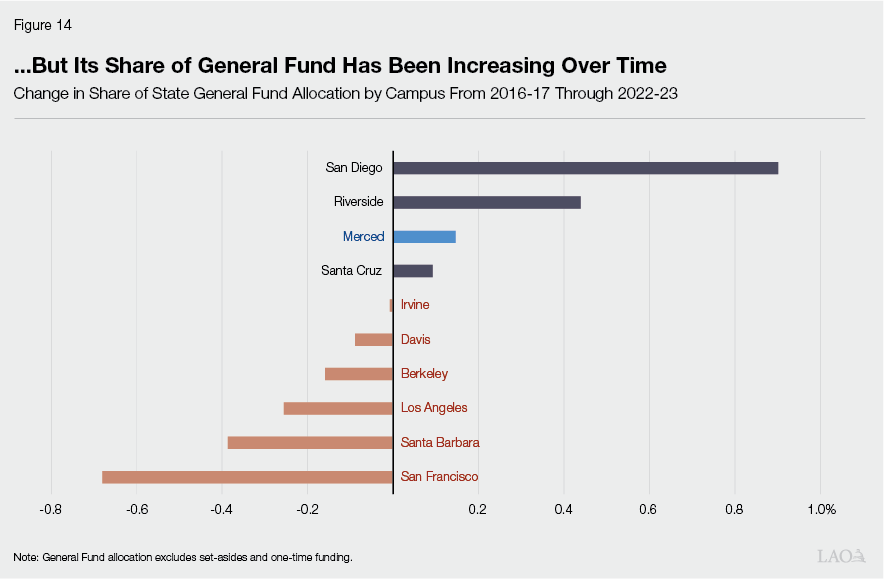
UC Merced’s Share of General Fund Is Smallest of All UC Campuses but Is Growing. Despite UC Merced receiving a notably higher per‑student funding rate, its General Fund allocation is the smallest of all UC campuses given its small size and disproportionate reliance on undergraduate education. As Figure 13 shows, UC Merced received just over 5 percent of UC’s General Fund appropriation (excluding set‑asides for specific programs and one‑time allocations) in 2022‑23. Though having the smallest General Fund allocation, UC Merced’s share of UC’s General Fund appropriation has been increasing slightly over time, as Figure 14 shows.
UC Merced Relies More Heavily on State Funding Than Other UC Campuses. We compared UC Merced’s mix of revenue streams over the past decade to other UC campuses that do not have a medical center (Berkeley, Riverside, Santa Barbara, and Santa Cruz). UC Merced’s largest revenue stream continues to be from the state, with state General Fund averaging 48 percent of all its revenue over this period. By comparison, state funding comprised an average of 20 percent of total revenue at the other UC campuses without a medical school. In contrast to this trend, aggregate tuition and fee revenue over the past decade has been 11 percentage points lower at UC Merced than the average of other UC campuses without a medical center (21 percent compared to 32 percent). A major reason aggregate tuition revenue is lower at UC Merced is because it has fewer professional degree programs, which charge much higher tuition levels than undergraduate and academic doctoral programs. Additionally, compared to other UC campuses without a medical center, UC Merced receives less funding from grants and contracts as well as less private giving.
A Smaller Share of UC Merced’s Expenditures Are for Instruction and Research. In 2022‑23, 24 percent of UC Merced’s expenditures were for instruction and research (combined). By comparison, other UC campuses without a medical school reported much higher shares of spending on instruction and research (an average of 46 percent). This differential has remained about the same over the past decade, with UC Merced consistently spending notably less on instruction and research.
UC Merced Spends Proportionally More on Institutional Support. “Institutional support” includes various costs entailed in operating a campus, including general administrative services, executive staff, legal and fiscal operations, space management, and public relations, among others. Institutional support has comprised, on average, 18 percent of UC Merced’s expenditures since it opened. This share has declined slightly over the past five years—averaging 17 percent. This rate remains substantially higher—more than double—other UC campuses that lack a medical facility. Over the past five years, institutional support expenditures at those campuses averaged 8 percent of total expenses.
UC Merced Spends Proportionally More on Its Buildings and Infrastructure. As a newer campus that has constructed many new buildings and infrastructure within a relatively short amount of time, UC Merced has higher associated spending as a share of its total spending than other UC campuses. In 2022‑23, 8.2 percent of UC Merced’s expenditures were for interest payments on its bonds for capital projects, compared to 3 percent for other UC campuses without a medical center. UC Merced anticipates that it will continue spending a relatively high share of its annual budget on interest payments for at least a few more decades as much of its debt for capital projects is being financed over about 30 years.
Assessing Extent Key Objectives Were Met
In this section, we analyze the extent to which UC Merced has fulfilled its original objectives relating to expanding UC enrollment capacity, improving regional educational outcomes, and improving regional economic outcomes. Overall, the evidence is not strong that UC Merced had a major role in expanding UC enrollment capacity and improving regional educational and economic outcomes. Though some regional educational and economic outcomes in the San Joaquin Valley are better today than prior to the opening of UC Merced, other regions of the state have experienced comparable or greater improvements. The evidence is stronger that UC Merced has made a positive impact in two particular areas—perhaps unsurprisingly. First, as the paragraphs in this section detail, more students from the San Joaquin Valley are attending UC, with a large share of those student enrolling at the UC Merced campus. That is, the campus has increased access to UC for students in that area. Second, UC Merced likely has contributed to higher employment in certain sectors and higher wages for state government employees living in that area.
Enrollment Capacity
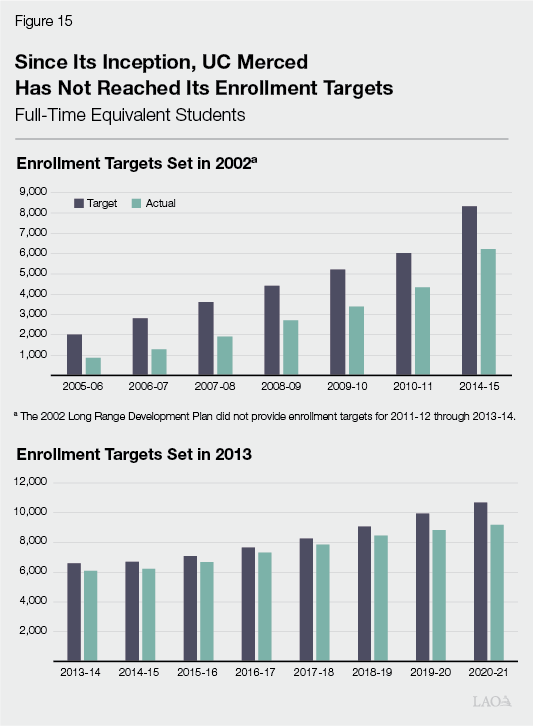
UC Merced Has Not Met Its LRDP Enrollment Targets. Across all three of its LRDPs, UC Merced has fallen short of its enrollment targets. Its 2002 LRDP, for example, projected FTE enrollment to reach 8,316 students by 2014‑15. After falling short in meeting its enrollment targets in the mid‑2000s, UC Merced revised the target for 2014‑15 down to 6,630 FTE students in its 2009 LRDP. Despite the downward revision, UC Merced still fell short of meeting the revised 2014‑15 target—missing it by 414 FTE students. As Figure 15 shows, UC Merced also has fallen short of the enrollment targets it established in 2013. The 2020 LRDP further lowered the campus’s enrollment targets. (Unlike earlier LRDPs which tended to set annual targets, the 2020 LRDP set enrollment targets for only 2020‑21 and 2030‑31.) UC Merced fell short of its 2020‑21 target (9,700 FTE students) by 515 FTE students.
Other Young Campuses Also Have Missed Their Enrollment Targets. UC Merced’s enrollment challenges are not unique for a new campus. CSU Channel Islands, the most recently constructed CSU campus (opened in 2002), anticipated enrollment to grow to 12,000 FTE students by 2020, but its peak to date has been only roughly half that amount (6,406 FTE students in 2019). UC Irvine and UC Santa Cruz, the two most recently constructed UC campuses prior to UC Merced (both opening in 1965), were also unable to meet initial enrollment projections. For example, UC Irvine’s first LRDP (approved in 1963) projected total enrollment to reach 27,500 students by 1990, but it fell short, reaching only 16,151 students. UC Irvine did not cross the 27,500 mark until 2014‑15—25 years later than initially planned. UC Santa Cruz’s first LRDP (also approved in 1963), projected enrollment to reach 7,500 students by 1975 and 27,500 by 1990. Its enrollment reached 6,103 students by 1975 and grew to only 10,052 by 1990. UC Santa Cruz is still far below its initial LRDP goal of 27,500 students (enrolling 18,770 FTE students in 2022‑23). UC Santa Cruz’s most recently approved LRDP (2021) projects enrollment will not cross the 27,500 mark until 2040—50 years later than initially planned.
UC Access and Capacity Has Increased but Small Share Is Due to UC Merced. As a system, UC capacity for educating resident students has increased since 2005. Whereas UC enrolled an estimated 7.4 percent of California public high school graduates in 2005‑06, it enrolled an estimated 8 percent in 2022‑23. Since 2005, UC has added approximately 44,000 resident undergraduate slots. UC Merced accounts for 17 percent of this growth. UC Merced added the greatest number of resident undergraduate students of any UC campus, with it growing by approximately 7,500 students since 2005. UC Riverside and UC San Diego, however, each added nearly as many students over the same period, growing by about 7,300 and 7,100 resident undergraduate students, respectively.
Adding Capacity at UC Merced Has Been Relatively Costly. Over the last several years, UC Merced has received approximately $10,000 more in state per‑student operating funds compared to the other UC general campuses. Consequently, adding enrollment slots at UC Merced has been costlier than adding slots at the other UC campuses. In 2022‑23, UC Merced received $85 million in state per‑student funding above the level it would have generated under the rebenching formula had it been any other UC general campus with a comparable student body. Had that funding been allocated to the other general education campuses instead, the state could have supported an additional 10,060 UC students.
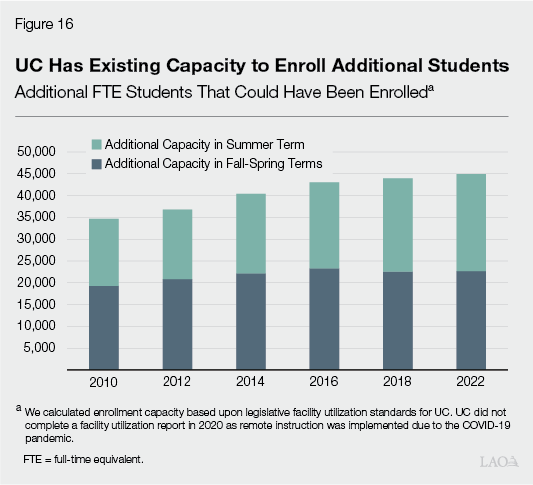
UC Has Capacity to Enroll Additional Students at Established Campuses. One reason to establish a new higher education campus is in response to capacity constraints—specifically, having existing campuses at or exceeding their physical capacity. While some campuses have exceeded legislative facility utilization standards for certain‑sized classrooms and laboratories at times over the last decade, systemwide facility utilization has been below legislative standards. Figure 16 shows that UC has academic facility space at its existing general campuses to enroll thousands of additional students. For each year shown, the amount of space available at the other UC campuses would have been more than sufficient to support UC Merced’s entire student population.
Regional Educational Trends
Regional College Going Rates Have Increased but Still Lag Behind State Average. Since UC Merced opened, college going among high school graduates has increased both regionally and statewide. As of 2021‑22, the college‑going rate of high school graduates from the San Joaquin Valley was 54 percent, up from 45 percent before UC Merced opened. The college‑going rate in Merced County was 39 percent, up slightly from 36 percent. Though both of these rates are up, college going statewide increased more markedly. Statewide, college going was 62 percent in 2021‑22, up from 50 percent over the same period.
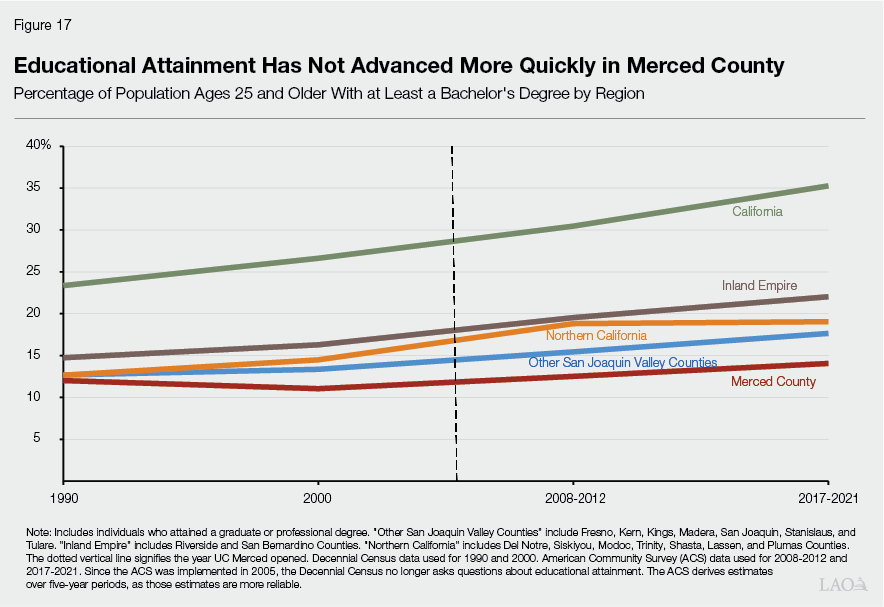
Educational Attainment in Region Has Increased but by Less Than State Average. As Figure 17 shows, the percentage of individuals with at least a bachelor’s degree has increased in Merced County since UC Merced opened but by less than the statewide average. Whereas the share of individuals with at least a bachelor’s degree in Merced County increased from 11 percent in 2000 to 14 percent based on the most recent data collection (2017‑2021), the share increased from 27 percent to 35 percent statewide over the same period. The other counties in the San Joaquin Valley (Fresno, Kern, Kings, Madera, San Joaquin, Stanislaus, and Tulare) similarly have experienced growth in the shares of individuals holding at least a bachelor’s degree (growing collectively from 13 percent in 2000 to 18 percent across 2017‑2021). Other areas of the state, however, have shown similar improvement. Counties in Northern California (Del Notre, Siskiyou, Modoc, Trinity, Shasta, Lassen, and Plumas), for example, saw their share of individuals with at least a bachelor’s degree collectively increase from 14 percent in 2000 to 19 percent across 2017‑2021.
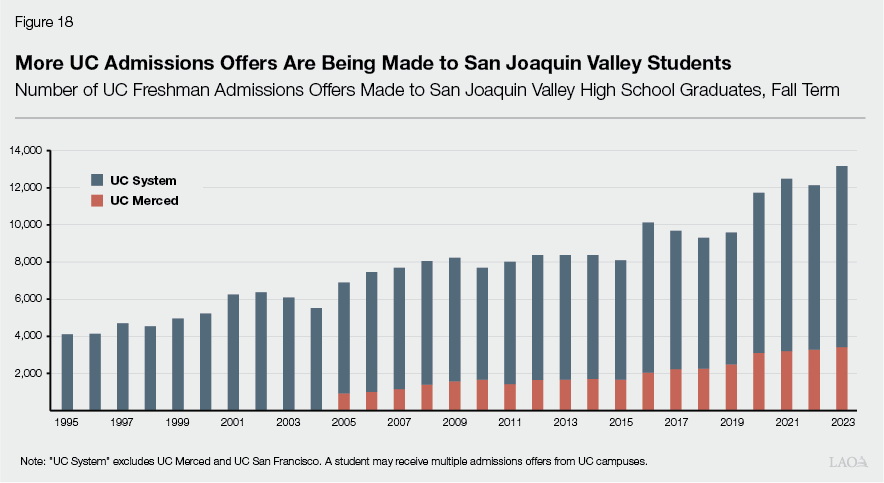
UC Freshman Admissions From San Joaquin Valley Have Nearly Doubled Since Opening of UC Merced. Though the evidence is weak that UC Merced has had a uniquely positive impact on college going or educational attainment in the region (when compared to gains made statewide), the evidence is stronger that the campus has improved access to UC for students from the area. As Figure 18 shows, since 2005 there has been a substantial increase in the number of UC admissions offers received by San Joaquin Valley high school graduates. While an offer of admission does not guarantee that a student will enroll at a particular campus, it ensures that a student will have a spot reserved should they wish to enroll. In this sense, an offer of admission is a proxy for access to a campus. In fall 2023, the number of UC admissions offers received by San Joaquin Valley high school graduates was nearly double the amount received in fall 2005 (about 6,900 compared to about 13,200). The increase in admissions offers far exceeds the growth in the college‑age population from the San Joaquin Valley, which grew by 11 percent from 2005 to 2022.
More Students From San Joaquin Valley Are Enrolling at UC. Data also show that more students from the area are choosing to enroll at UC, particularly at the UC Merced campus. In the decade prior to the opening of UC Merced to undergraduate students (1995‑2004), public and private high school graduates in the San Joaquin Valley accounted for 4.9 percent of UC’s resident freshman class. By 2023, this percentage had grown to 7 percent of UC’s total resident freshman class. Merced County in particular has experienced substantial growth in UC attendance. From 1999‑2002, only 3 percent of high school graduates enrolled at a UC campus. By 2021‑22, 17 percent of Merced County high school graduates who enrolled at a college or university enrolled at a UC campus. Of the San Joaquin Valley counties, Merced now produces the most UC enrollees per capita. In 2023, UC systemwide enrolled 2,940 freshman students from public and private high schools in the San Joaquin Valley, with 25 percent of that total (722 students) enrolled at UC Merced.
Regional Economic Trends
Unemployment Rate Remains Higher in Region Than State Average. As it was before the opening of UC Merced, the unemployment rate in Merced County continues to exceed the average of the other San Joaquin Valley counties as well as the statewide average. This is the case whether measured since the campus’s opening or just over the past decade. From 2014 through 2023, for example, the unemployment rate in Merced County averaged 10.1 percent, compared to 9 percent in other San Joaquin Valley counties and 5.9 percent statewide.
Poverty Rate Remains Higher in Region Than State Average. As it was before the opening of UC Merced, the poverty rate in the region has continued to exceed the statewide average. From 2005 through 2022, poverty rates in the region were slightly higher compared to the decade prior to the opening of UC Merced (1995‑2004). Over this period, poverty rate averaged 20.2 percent in San Joaquin Valley and 21.8 percent in Merced County (up from 19.9 percent and 21.2 percent, respectively.) Over the same period, the statewide poverty rate fell slightly, to 14 percent (from 14.4 percent).
Wages of Private‑Sector Employees Remain Lower in Region Than State Average. One benefit of a UC campus could be stimulating activity throughout the regional economy, such that wages in the private sector increase more than otherwise expected. As the left‑hand side of Figure 19 shows, the evidence is not strong that this has happened in the case of UC Merced. San Joaquin Valley counties (excluding Merced) saw inflation‑adjusted average weekly wages from private establishments increase by 5 percent from 2005 to 2023, but these wages grew 12 percent statewide. Merced County’s wage growth among private establishments fell behind both the state and San Joaquin Valley averages, increasing by 2 percent over this period.
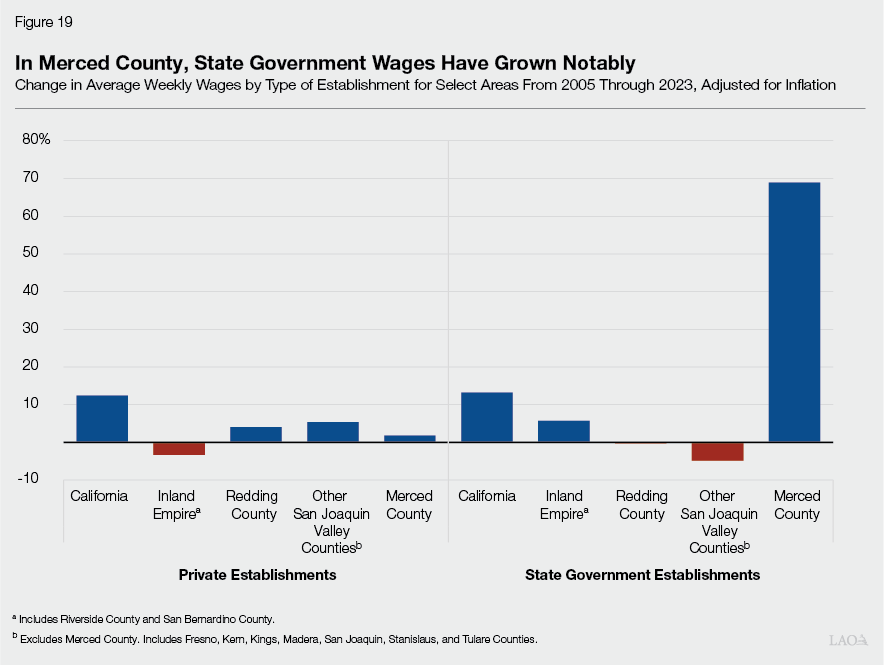
Wages of State‑Sector Employees Have Increased in the Region. Though UC Merced does not appear to have helped accelerate wage growth in the private sector, the region has seen substantial growth in average wages for state‑government workers since the campus was opened. The right‑hand side of Figure 19 shows that wage growth in the state government sector (including UC Merced) has been strong. Merced County’s growth in state government wages (69 percent) vastly exceeds the growth at the state level (13 percent) over this period. This increase in average wages is consistent with what one might expect when the state adds a substantial number of relatively high paying government jobs to a region.
Employment Growth in the Region Has Been Higher Than State Average. Merced County also has seen above‑average growth in the number of individuals employed in nonfarm occupations. From 2005 through 2022, the number of individuals employed in nonfarm establishments grew by 24 percent in Merced County, compared to 18 percent statewide. (Over the same period, the population in Merced County grew by 19 percent, with the state population growing by 9 percent.) Though employment growth in Merced County and the San Joaquin Valley more broadly have been above‑average, they are somewhat below other regions. For example, employment growth in the Inland Empire (Riverside and San Bernardino Counties) increased by double the state average (36 percent) over the same period.
Economic Impact Reports Emphasize Greater Employment and Spending in Region. We reviewed three economic impact reports about UC Merced. Specifically, we reviewed an academic study by Lee (2019), the most recent study UC Merced commissioned (2020), and the most recent study UCOP commissioned (2021). Findings from the Lee study suggest that UC Merced contributed to a 13 percent increase in jobs in the local services sector (with students and campus employees increasing demand for things like restaurants, haircuts, and health care). The economic impact reports commissioned by UC Merced and UCOP also note that UC Merced has been a significant regional employer. Additionally, those reports found UC Merced had been a large‑scale buyer of goods and services in the region. The report commissioned by UC Merced estimated that campus spending accounted for 0.3 percent of total gross regional product in the San Joaquin Valley in 2018‑19. Campus spending was concentrated in the areas of campus payroll and construction.
Key Takeaways
In this section, we highlight key state‑level takeaways that could help inform and guide the Legislature as it undertakes higher education planning moving forward. As this section shows, the UC Merced experience is largely a cautionary tale. On many fronts, new campuses are likely to take much longer than expected to fulfill central goals. For several decades, despite their focused efforts, new campuses are likely to see their enrollment increase more slowly than planned, while also having higher per‑student costs, fewer funding sources, less extensive academic offerings, and smaller auxiliary programs compared to larger, more established campuses. The UC Merced experience also suggests that overall college going and educational attainment in the vicinity of a new campus might not advance more quickly than in many other areas of the state, at least within the initial 20 years. Moreover, the UC Merced experience suggests that new campuses are unlikely to generate pronounced economic effects in the near term beyond those that might have been achieved by other large state projects.
New Campuses Take Longer to Grow Than Many Expect. As exemplified by the experiences of UC Merced, along with other new UC and CSU campuses over the past 50 years, new campuses have not reached their initial enrollment targets. One reason could be that initial enrollment targets are unrealistic, with campus planners generally thinking enrollment can grow more quickly than is practical. Another reason could be that the location of new campuses are not ideally situated, lacking sufficient regional population growth or statewide attraction to meet campus enrollment targets.
Higher Relative Costs of New Campuses Are Likely to Linger for Decades. All new campuses share certain challenges reflected in the UC Merced experience. To gain students and build their enrollment levels, new campuses need to offer high‑demand academic programs. To be able to offer those programs, new campuses need to be able to recruit faculty and staff. To educate students and accommodate faculty and staff, new campuses typically need physical spaces, including classrooms, laboratories, and offices. Growing these three areas in tandem—students, staff, and space—is a significant challenge. Building space or hiring staff before students enroll means added costs without as much underlying revenue, yet not having space and staff in place means students have no programs in which to enter. Until a campus reaches a certain level—with a certain number of students, type of students, and revenue streams—nearly all aspects of campus development not only are more daunting logistically, but they cost more per student. Until economies of scales are reached, campus developments come at a higher cost per student than supporting the same number of students at larger, more established campuses.
New Campuses Likely Will Not Be Able to Offer Same Quality of Program for Decades. Despite their higher per‑student costs, new campuses likely cannot offer the types of programs and support that more established campuses offer. With lower enrollment, new campuses need to direct a higher share of their spending toward institutional support and capital outlay. In turn, new campuses spend less on instruction and student support. New campuses also typically take many decades to diversify their funding streams. For example, it may take several decades before a new campus has sufficient faculty established in their fields to attain substantial federal research funding. It may also take years to develop graduate professional degree programs that can bring in additional revenue through supplemental tuition charges. Similarly, building up alumni support and cultivating philanthropic donors could take a few decades. With a less diversified funding portfolio, new campuses are not as likely to direct as much funding toward their instructional and research programs. Additionally, new campuses will need about three decades to begin retiring debt service on their first round of capital projects (including their residential housing facilities, parking facilities, and other auxiliary enterprises). Once debt service is retired, existing funds not only can be freed up for programmatic activities but new revenue generated from housing and parking charges can be used for associated capital improvements and expansions. Given these dynamics, new campuses will tend to have smaller auxiliary programs for many decades before being able to bring them to the scale of larger, more established campuses.
New Campuses Make More Fiscal Sense When Existing Campuses Are Nearing Their Physical Capacities. UC has substantial untapped physical capacity to enroll additional students at its long‑established campuses. From 2010 through 2022, capacity at other UC general campuses was more than sufficient to enroll all of the students who enrolled at UC Merced. UC and CSU also are facing other factors that would tend to reduce justification for new campuses or centers. Importantly, California’s college‑age population is projected to decline by 15 percent over the next decade. Such a decline would typically translate into smaller new freshman cohorts, potentially relieving enrollment pressure. Moreover, both segments have goals to expand their online offerings. More online offerings would also help slow the need for expansion of physical campus space.
New Campuses Could Have Mixed Impacts on Regional Educational Outcomes. Data from the UC Merced experience suggest that a new campus can increase access to UC in the affected area. A new campus, however, might not result in higher educational attainment in the area. One reason why a new UC campus might not result in higher educational attainment in a region is that UC degree holders may feel that they have more advantageous employment opportunities elsewhere in the state. Absent other strategies to retain college‑educated workers in an area, a new university campus might have an unintended effect on the out‑migration of college‑educated workers.
Direct Economic Activity of New Campus Is Likely Similar to Other State Projects. A substantial amount of the estimated economic activity associated with UC Merced is directly related to campus employment (payroll spending) and construction activity. Similar impacts might be expected for any state agency that employs a large staff and constructs new facilities. For example, the move or expansion of a large state department (such as the Employment Development Department or California Environment Protection Agency) or a large new courthouse also would translate into higher employment and more construction activity in the selected area. Theoretically, a university campus might yield higher economic benefits related to research, but such benefits could take many decades to materialize. After 20 years, the Merced area is not seeing pronounced economic benefits due to its research activities.
Key Information About Relative Cost‑Effectiveness Is Lacking. UC Merced appears to have made its most positive impacts in two areas—providing more access to UC for students in the San Joaquin Valley and increasing employment in certain sectors in the San Joaquin Valley. To date, studies have not determined whether these results could have been obtained in more cost‑effective ways. The state, for example, might have sought to increase access to UC for students in the San Joaquin Valley by creating targeted outreach programs (such as sending more college recruiters into the area) or financial aid programs (such as providing more grant assistance to students coming from that area). Strategies like these conceivably could have increased access to UC at lower cost. Similarly, the state might have sought to increase economic outcomes in the San Joaquin Valley through other means, such as providing businesses with tax credits for hiring workers in the region who face certain economic disadvantages or funding a geographically targeted expansion of the California Competes program. Opportunities exist for researchers to further study the relative cost‑effectiveness of these and other state policy options.
