Seth Kerstein
December 10, 2024
Recent Trends in Young Adult Mortality
- Introduction
- Overview of Recent Trends
- Which Causes of Death Are Driving These Trends?
- A Closer Look at Substance Use Deaths
- A Closer Look at Motor Vehicle Deaths
- Issues for Legislative Consideration
- Appendix
Executive Summary
California’s Age 15 to 44 Death Rate Still Much Higher Than Before Pandemic. In this report, we describe a worrisome trend: overall mortality among Californians between the ages of 15 and 44 is still much higher than it was before the COVID‑19 pandemic. In 2023, 15‑to‑44‑year‑old Californians (to whom we refer as “young adults” in this report) died at a rate of 128 per 100,000 people, compared to just 99 per 100,000 in 2019—representing an increase of nearly 30 percent.
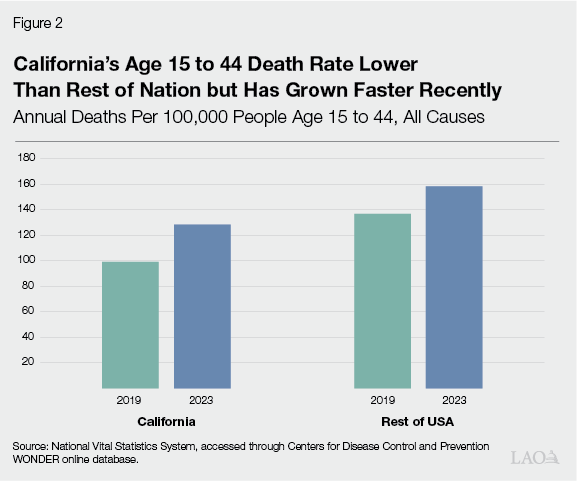
State’s Age 15 to 44 Death Rate Lower Than Rest of Nation, but Has Grown Faster Recently. California has long had a lower age 15 to 44 mortality rate than the rest of the United States. As in California, young adult deaths in the rest of the nation grew rapidly in 2020 and 2021 and remain well above pre‑pandemic levels. Notably, however, young adult mortality in California has not fallen as quickly from the 2021 peak as it has in the rest of the nation.
Striking Demographic, Geographic, and Socioeconomic Disparities in Mortality Trends. Recent growth in age 15 to 44 mortality has been especially pronounced for men, Native American and Black Californians, and residents of rural northern counties and the state’s lowest‑income zip codes.
Trend Driven Largely by Drugs, Alcohol, and Motor Vehicle Crashes. Drug overdoses account for 60 percent of the recent growth in age 15 to 44 mortality. Alcohol‑induced deaths and motor vehicle crashes each account for 10 percent. Firearm homicides, COVID‑19, and other causes of death account for smaller portions of the mortality trend.
Growth in Overdose Deaths Driven by Fentanyl. Age 15 to 44 drug overdose deaths were growing before the pandemic, but this growth accelerated substantially in early 2020. Since then, this growth has slowed but not reversed, so young adults are still dying from overdoses at a much higher rate than before the pandemic.
One of the major factors driving this trend has been the growing presence of fentanyl—a synthetic opioid—in California’s illicit drug markets. In 2019 and 2020, growth in young adult overdose deaths was driven mainly by overdoses that involved synthetic opioids but not psychostimulants (such as methamphetamine). Since 2020, however, growth in these deaths has been driven mainly by overdoses involving both synthetic opioids and psychostimulants.
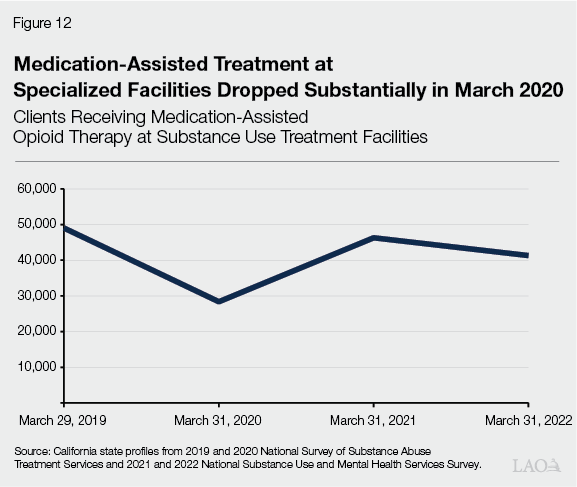
Disruptions to substance use treatment also might have contributed to the early‑pandemic growth in overdose deaths. Enrollment in medication‑assisted treatment for opioid use disorder at treatment facilities was 42 percent lower in March 2020 than in March 2019.
Growth in Alcohol Deaths Likely Driven by Group With Preexisting High Risk. As with drug overdose deaths, growth in alcohol‑induced young adult deaths accelerated substantially in early 2020, and this death rate remains much higher than before the pandemic. A couple of indicators suggest that this growth likely has consisted largely of relapses or other disruptions that affected a particularly vulnerable population with long‑standing alcohol use disorders. First, deaths from alcoholic liver disease grew quickly in 2020, but this disease generally develops only after several years or more of heavy drinking. Second, total statewide alcohol consumption changed only modestly in 2020.
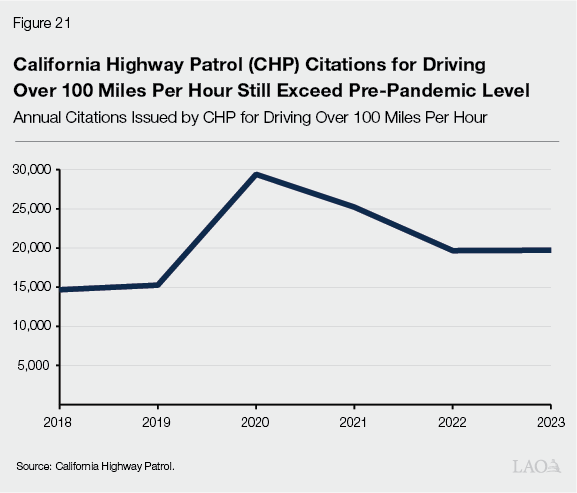
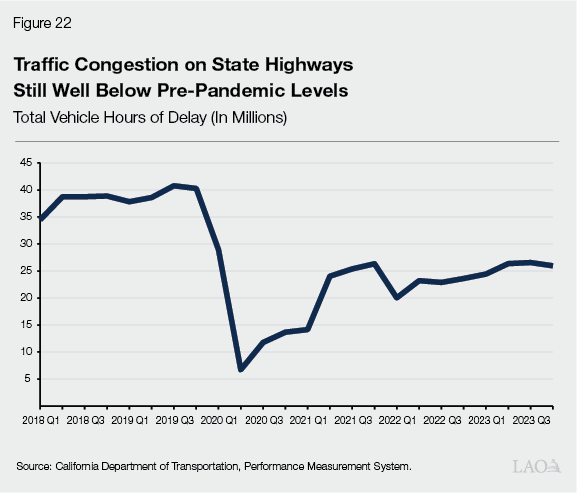
Extreme Speeding and Other Risky Driving Likely Contributing Significantly to Growth in Motor Vehicle Deaths. Age 15 to 44 motor vehicle deaths grew substantially in 2020 and remain elevated despite a persistent decline in the total amount of driving on California roads. California Highway Patrol citations for driving over 100 miles per hour nearly doubled between 2019 and 2020. In 2023, the number of such citations was still nearly 30 percent higher than in 2019, indicating a persistent increase in extreme speeding. Perhaps more people are speeding because they are not constrained by traffic. Consistent with this explanation, traffic congestion dropped sharply in early 2020 and remains well below pre‑pandemic levels. When we examine the “primary collision factors” reported by law enforcement, however, the growth in young adult fatalities appears to be spread across many different types of traffic violations. Some of these violations have a plausible connection to speeding, but others do not—suggesting a broader change in risky driving behaviors. Despite this apparent growth in dangerous driving, the largest state and local law enforcement agencies are stopping fewer drivers for moving violations than they were before the pandemic.
Explore Options in Key Policy Areas, but Also Consider Issue More Broadly. These mortality trends present major challenges for the Legislature to tackle through policies and programs related to drugs, alcohol, and traffic safety. A key purpose of this report, however, is to illustrate a broader picture than those we can see through specialized policy lenses. The Legislature also could look for opportunities to address young adult mortality through other areas of health policy and public safety policy.
Introduction
In this report, we describe a worrisome trend: overall mortality among Californians (and Americans more generally) between the ages of 15 and 44 is still much higher than it was before the COVID‑19 pandemic. The purpose of this report is to provide information to help the Legislature and the public understand various aspects of this trend. While this report includes a description of some factors that could be contributing to the problem, a comprehensive investigation of such factors is beyond our scope here. We hope that this report will prompt further research along those lines.
We bring this problem to the Legislature’s and the public’s attention due to its relevance to several major areas of state and local public policy. That said, the report does not cover specific responses that policymakers might consider. We hope that this analysis will serve as a broad foundation for further discussions about such responses.
The first section of the report provides a broad overview of recent trends in age 15 to 44 mortality. The second section breaks out this growth by underlying causes of death. Subsequent sections take a closer look at some of the major causes of death and discuss some key issues for legislative consideration.
Overview of Recent Trends
Overall Statewide Trend
California’s Age 15 to 44 Death Rate Still Much Higher Than Before Pandemic. Over the first couple years of the COVID‑19 pandemic, the state’s overall death rates (encompassing all causes of death) for adults of all age groups grew substantially. By 2023, death rates for most age groups had dropped back to pre‑pandemic levels. As shown in Figure 1, however, the 15‑to‑44‑year‑old age group (to whom we refer as “young adults” in this report) is an exception. Although the death rate for these Californians is down from its 2021 peak, it remains much higher than its pre‑pandemic level. In 2023, California’s young adults died at a rate of 128 per 100,000 people, compared to just 99 per 100,000 in 2019—representing an increase of nearly 30 percent.
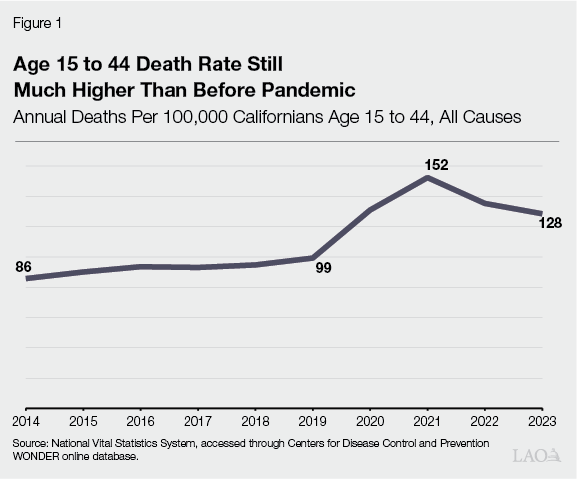
To put these death rates into perspective, we briefly describe the state’s longer‑term young adult mortality trends. The age 15 to 44 death rate declined from the mid‑1990s through the first decade of the 2000s. After hitting an all‑time low in 2010, young adult mortality started growing. That change was worrisome in its own right, but in hindsight, the growth rate was relatively modest. As shown in Figure 1, the growth in the initial years of the COVID‑19 pandemic far outpaced the prior trend. Even after a couple of years of substantial declines, California’s young adult death rate in 2023 was around the same level as in 1996.
State’s Age 15 to 44 Death Rate Lower Than Rest of Nation, but Has Grown Faster Recently. California has had a substantially lower young adult death rate than the rest of the United States for at least a quarter‑century. From 2016 through the first couple years of the pandemic, this difference in death rates was even bigger than it had been historically.
Figure 2 compares age 15 to 44 mortality trends between California and the rest of the nation from 2019 to 2023. These trends have been similar in some respects. For example, both rates grew fast in 2020 and 2021. Despite recent declines, both remain well above pre‑pandemic levels. Notably, however, young adult mortality in California has not fallen as quickly from the 2021 peak as it has in the rest of the nation. As a result, the difference between California’s death rate and the rest of the nation’s has narrowed. The current size of this gap is similar to what it was from the late 1990s through 2015.
From this comparison, we see that elevated young adult mortality is not a problem unique to California. As we discuss later in this report, however, a closer look at this trend suggests that California’s state and local governments could play an important role in addressing the problem. Before we turn to that part of the discussion, we first examine differences in mortality trends across genders, races, and geographic areas.
Trends by Gender and Race
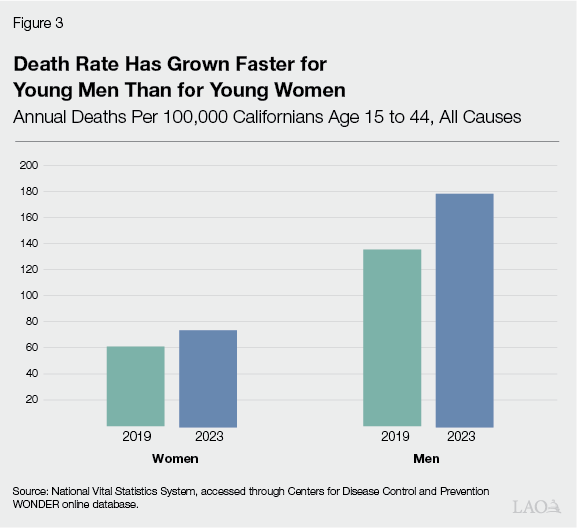
Deaths Have Grown Faster for Young Men Than for Young Women. Figure 3 displays recent changes in age 15 to 44 mortality rates by gender. From 2019 to 2023, the annual death rate for young men grew by 44 deaths per 100,000 people, while the annual death rate for young women grew by 13 deaths per 100,000. As shown in the figure, this difference in growth exacerbated an existing large gender gap. The death rate for 15‑to‑44‑year‑old men is now 140 percent higher than the rate for women in that age range.
Growth in Young Adult Deaths Disparate Among Racial/Ethnic Groups. Figure 4 displays recent changes in young women’s mortality rates by race, while Figure 5 displays recent changes by race for young men. Taken together, the two figures illustrate striking racial differences in mortality trends both within each gender and overall. Black and Native American young men’s death rates have grown by more than 100 annual deaths per 100,000 people—faster than any other race‑gender groups. Although women’s overall age 15 to 44 death rate has grown much more slowly than men’s, death rates for some groups of young women have grown very fast. In particular, age 15 to 44 mortality has grown faster for Native American women than for most groups of men, let alone other groups of women.
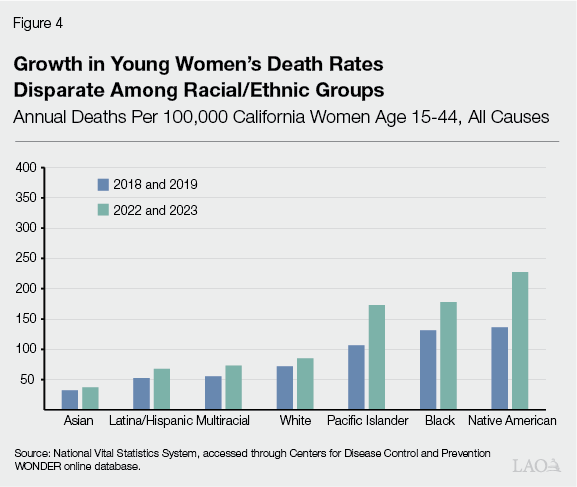
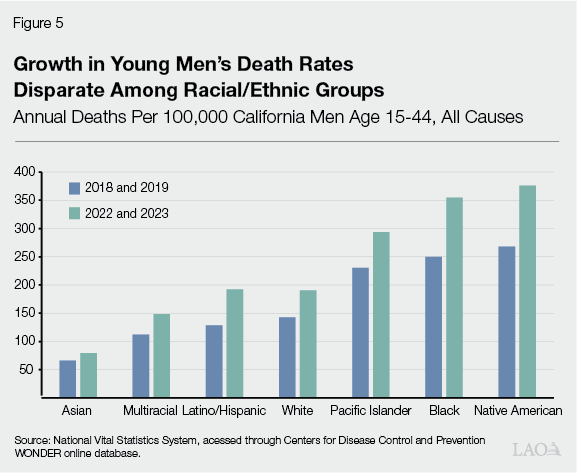
These racial differences in mortality trends largely have mirrored pre‑existing disparities in death rates. One notable exception is the gap between white and Latino/Hispanic men. Before the pandemic, Latino/Hispanic young men were dying at substantially lower rates than white men, but their death rate has grown faster in recent years.
Trends by County
Young Adult Deaths Have Grown Fastest in North Coast, San Francisco, and Parts of Inland California. The map portion of Figure 6 groups California counties by the recent growth in their young adult death rates. Among these, the fastest growth—increases of more than 60 annual deaths per 100,000 people—has occurred in five counties in the northwestern corner of the state: Del Norte, Siskiyou, Humboldt, Trinity, and Mendocino. Death rates in San Francisco and some inland parts of the state have grown by 45 to 50 annual deaths per 100,000. Most other parts of the state have experienced substantial but less extreme growth. Most of the counties with relatively modest growth—less than 25 annual deaths per 100,000—are concentrated in the Sierra Nevada region and parts of the Bay Area.
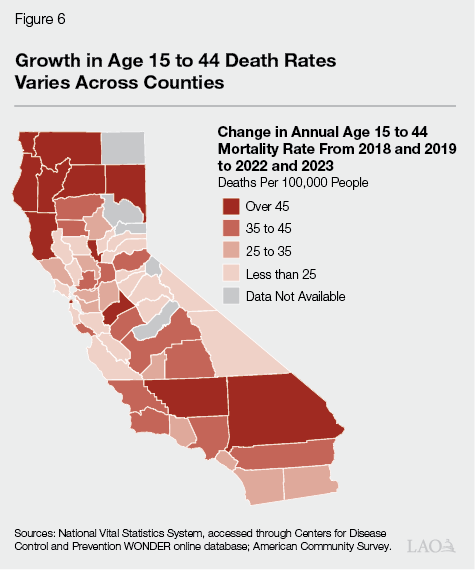
Rural Northern Counties Have Highest Young Adult Death Rates. The table portion of Figure 6 lists the most recent age 15 to 44 mortality rate for each county. The counties with the highest young adult death rates are all in the rural northern part of the state. This group includes not just the five counties where deaths have grown fastest recently, but the inland northern counties as well. At the other end of the spectrum, the counties with the lowest young adult death rates are concentrated in or near the Bay Area. Overall, these geographic gaps, though quite substantial, generally are smaller than the racial gaps noted above.
Figure 6
Rural Northern Counties Have Highest
Young Adult Death Rates
|
Counties |
Annual Deaths Per 100,000 |
|
Del Norte, Siskiyou, Trinity |
281 |
|
Mendocino |
230 |
|
Humboldt |
219 |
|
Lassen, Shasta |
218 |
|
Colusa, Glenn, Lake, Tehama |
217 |
|
Kern |
196 |
|
Inyo, Mariposa, Mono, Tuolumne |
187 |
|
Sutter |
182 |
|
Yuba |
179 |
|
Stanislaus |
177 |
|
San Bernardino |
170 |
|
Solano |
164 |
|
San Joaquin |
162 |
|
Amador, Calaveras, Fresno |
160 |
|
Merced |
157 |
|
Butte, Tulare |
156 |
|
El Dorado, Sacramento |
155 |
|
Nevada |
152 |
|
Riverside |
145 |
|
Madera |
144 |
|
Kings |
139 |
|
Imperial |
135 |
|
Los Angeles |
131 |
|
Santa Cruz |
127 |
|
Sonoma |
126 |
|
Contra Costa |
124 |
|
San Luis Obispo |
123 |
|
Ventura |
122 |
|
San Francisco |
120 |
|
Santa Barbara |
119 |
|
Monterey |
115 |
|
Alameda |
111 |
|
Placer |
109 |
|
San Diego |
108 |
|
Orange |
107 |
|
Marin |
94 |
|
Napa |
87 |
|
Yolo |
82 |
|
San Mateo, Santa Clara, San Benito |
79 |
|
Sources: National Vital Statistics System, accessed through Centers for |
|
Death Rates by Local Income Level
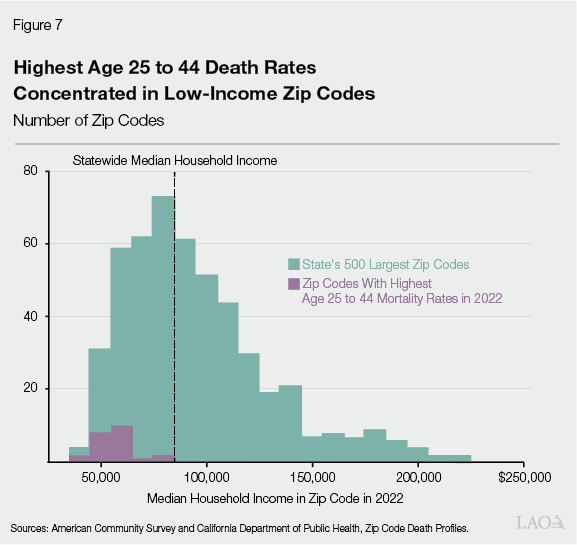
Highest Young Adult Death Rates Concentrated in Low‑Income Zip Codes. The demographic and geographic breakdowns discussed above come from publicly available vital statistics. Unfortunately, this data source does not give us much other socioeconomic information about people who die. By combining multiple sources of data, however, we can learn something about the distribution of young adult deaths across local communities that face different economic conditions.
For this exercise, our key measure of local economic conditions is the median household income in a zip code. In Figure 7, the green bars show the distribution of median household incomes for the state’s 500 largest zip codes. The purple bars show the distribution of median household incomes for the zip codes with the highest age 25 to 44 death rates. As shown in the figure, most of the highest‑mortality zip codes are among the lowest‑income zip codes in the state.
Which Causes of Death Are Driving These Trends?
Having documented California’s persistent, unequal growth in young adult deaths, we now explore potential explanations for this trend. As a starting point, we break down the recent increase in mortality by the underlying causes of death identified on death certificates.
Of course, this discussion of pandemic‑era causes of death must start with COVID‑19 itself. The virus killed many young adults in 2020 and 2021. Looking back at Figure 1, the overall age 15 to 44 death rate grew quickly over that period, and COVID‑19 deaths accounted for a large share of that growth. By 2023, however, deaths from the virus had become much less common, especially for this age group. As shown in Figure 8, COVID‑19 deaths account for just 3 percent of the growth in young adult mortality from 2019 to 2023. For the rest of this report, we turn our attention to the other underlying causes of death shown in the figure.
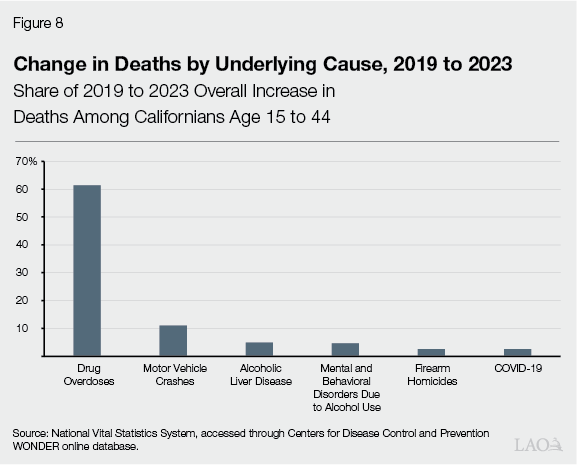
Drug Overdoses Account for 60 Percent of Growth in Age 15 to 44 Deaths. The most striking feature of Figure 8 is the large share of growth driven by drug overdoses. By now, the Legislature and much of the public are well aware that California and the rest of the nation are facing a drug overdose crisis. Even so, Figures 1 and 8 together paint a sobering picture: the overall rate of young adult mortality is much higher than it was in 2019—indeed, higher than at any point from 1997 through 2019—and overdose deaths are the main reason for this. Drug overdoses also are the main driver of disparities in the race‑specific and gender‑specific trends described in the previous section.
Motor Vehicle Crashes and Alcohol‑Induced Deaths Each Account for 10 Percent of Growth. Although drug overdoses are the biggest contributor to recent growth in age 15 to 44 mortality, they are far from the only one. As shown in Figure 8, motor vehicle crashes and alcohol‑induced deaths also account for substantial shares of the growth. Compared to the drug overdose crisis, these problems seem to be less well known among broad policy audiences.
As shown in the figure, the growth in alcohol‑induced deaths is split evenly between two categories. The first category is alcoholic liver disease, a condition that generally results from heavy drinking over many years. The second category is “mental/behavioral disorders due to alcohol use,” a broad term covering various types of deaths that can result from chronic alcohol use disorders or shorter‑term episodes of binge drinking.
Although the relative contributions of motor vehicle and alcohol deaths are similar overall, this varies substantially by race and gender. Age 15 to 44 motor vehicle crash deaths have grown four times as much for men as for women, while young men’s alcohol deaths have grown twice as much as young women’s. For motor vehicle deaths, the fastest‑widening racial disparity has been the Latino‑white gap, as this type of death has grown 4.4 times as fast for Latino young adults. For alcohol deaths, the fastest‑widening racial disparity has been the Black‑Asian gap, as this type of death has grown 4.4 times as fast for Black young adults.
Notable Trend in Firearm Deaths. After the causes of death discussed above, the next‑biggest contributor to growth in age 15 to 44 deaths has been firearm homicides. This is not a large part of the overall trend—like the COVID‑19 virus, it accounts for 3 percent of the growth. That said, it is part of a notable pattern. As shown in Figure 9, firearm homicides and firearm suicides both increased between 2019 and 2023. In contrast, over the same period, non‑firearm homicides were flat, and non‑firearm suicides declined.
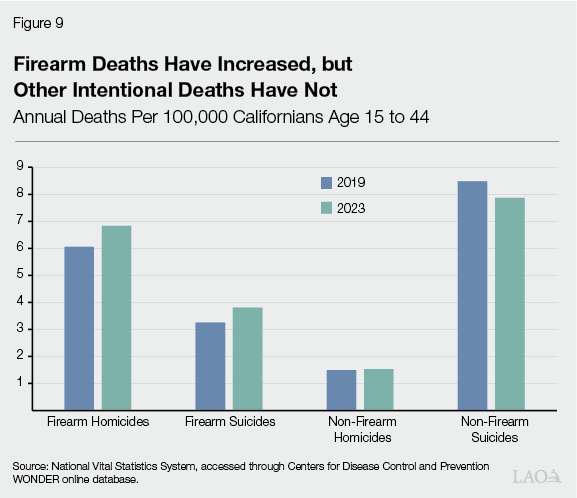
Different Types of “Deaths of Despair” Following Different Trends. Nearly a decade ago, a couple of researchers coined the term “deaths of despair,” a category that combines drug overdoses, alcohol‑induced deaths, and suicides. This term evokes various forms of social, economic, and emotional stress that can lead to such deaths. As discussed above, drug and alcohol deaths both have grown very fast among young adults, and this trend has been especially pronounced for socioeconomically disadvantaged groups. As shown in Figure 9, however, overall suicides in this age group have not grown, as the growth in firearm suicides has been fully offset by a decline in non‑firearm suicides.
In light of the flat suicide trend and the large role played by motor vehicle deaths, the applicability of the “deaths of despair” concept is unclear. Instead, this trend might be driven by pandemic‑era social and policy changes that earlier research did not anticipate. Research that tries to disentangle the effects of these myriad changes would be quite valuable. In the next couple of sections of this report, we take some initial steps to shed light on the nature of these deaths.
A Closer Look at Substance Use Deaths
In this section, we examine trends in young adult drug‑ and alcohol‑related deaths. We also explore some potential explanations for these trends and highlight some aspects of the trends that might be of particular interest to policymakers.
Trend in Young Adult Drug Overdose Deaths
Shortly Before Pandemic, Young Adult Drug Overdose Deaths Were Growing Substantially. Figure 10 displays total quarterly drug overdose deaths among Californians age 15 to 44 over the last six years. These deaths were growing at a fast rate even before the COVID‑19 pandemic. On average, they grew 5 percent per quarter from early 2018 to late 2019.
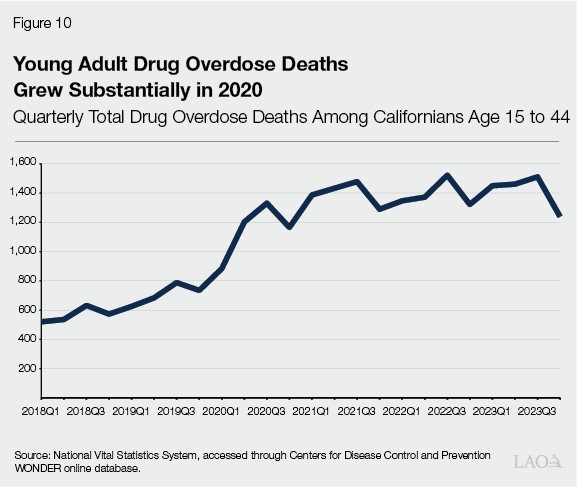
Growth Accelerated in Early 2020. As shown in the figure, the upward trend in young adult overdose deaths accelerated substantially in the first quarter of 2020. In early‑to‑mid‑2020, these deaths grew at an average quarterly rate of 21 percent.
Overdose Deaths Still Much Higher Than Before Pandemic. Since the third quarter of 2020, growth in young adult overdose deaths has slowed but not reversed, with an average quarterly growth rate around 0.8 percent. As a result, the number of deaths remains highly elevated, roughly double the 2019 level.
Fentanyl Overdoses
Fentanyl is a synthetic opioid. Compared to other commonly used illicit opioids like heroin, fentanyl is more potent and also is cheaper to produce and distribute.
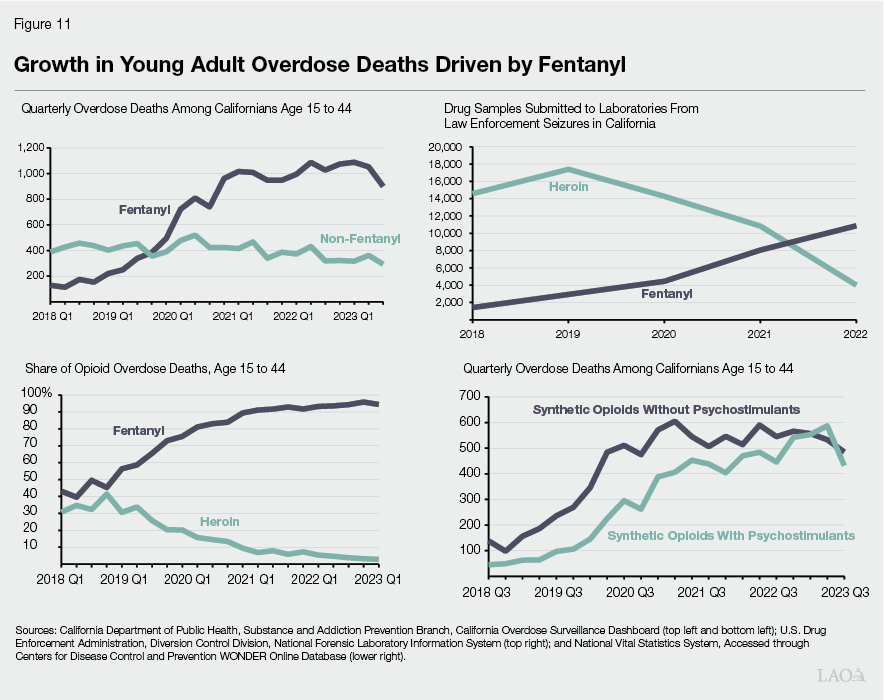
Growth in Drug‑Induced Deaths Driven by Fentanyl Overdoses. The top left panel of Figure 11 breaks down the quarterly trend in age 15 to 44 overdose deaths into overdoses involving fentanyl (often along with other drugs) and overdoses not involving fentanyl. Non‑fentanyl overdose deaths did not change much from 2018 to 2021, and they have been declining since 2021. In contrast, fentanyl overdose deaths grew fast from 2019 through 2021 and have remained elevated since then.
Fentanyl, Not Heroin, Now Dominates California’s Illicit Opioid Markets. Our review of research and discussions with experts have indicated a general consensus that fentanyl has taken over California’s illicit opioid markets in recent years, displacing heroin and other drugs. Measuring illegal activity, however, is very difficult, so we use a couple of indirect approaches to try to gauge how fentanyl’s market presence has evolved over time.
First, like other researchers, we look at the number of samples of heroin and fentanyl sent to testing labs after being seized by law enforcement. The results appear in the top right panel of Figure 11. Before the COVID‑19 pandemic, California law enforcement seized heroin much more often than they seized fentanyl. Over time, however, seizures of fentanyl grew and seizures of heroin declined. By 2022, the two drugs’ relative positions had reversed, and seizures of fentanyl far exceeded seizures of heroin. This is especially striking because fentanyl’s potency makes an equivalent amount much easier to conceal.
Our second indirect approach relies on mortality data—in particular, the shares of age 15 to 44 opioid overdose deaths involving heroin and fentanyl respectively. The results appear in the bottom left panel of Figure 11. In 2018, slightly less than half of young adult opioid overdose deaths involved fentanyl, and one‑third involved heroin. Now, 95 percent of those deaths involve fentanyl, and around 3 percent involve heroin.
Recent Growth Largely Driven by Overdoses Involving Both Synthetic Opioids and Psychostimulants. Due to fentanyl’s low cost, high potency, and ubiquity in drug markets, people often intentionally or unintentionally use it along with other drugs. As a result, many fentanyl overdose deaths involve other drugs as well. One of the most common pairings consists of fentanyl and a psychostimulant, typically methamphetamine. As shown in the bottom right panel of Figure 11, this pairing of drugs has played a large and growing role in the fentanyl overdose crisis. In 2019 and 2020, growth in young adult overdose deaths was driven mainly by overdoses that involved synthetic opioids (a category dominated by fentanyl) but not psychostimulants. Since 2020, however, growth in young adult overdose deaths has been driven mainly by overdoses involving both synthetic opioids and psychostimulants. Since the second half of 2020, deaths involving synthetic opioids without psychostimulants have grown by 0.3 percent per quarter, while deaths involving both types of drugs have grown by more than 5 percent per quarter.
Some Potential Explanations Are Difficult to Quantify. As described above, fentanyl overdose deaths among young adults grew very fast in 2020 and have remained elevated since then. Some plausible explanations for this mortality trend are very hard to verify directly. For example, using drugs alone is a major risk factor for overdose death, as other people are not well‑positioned to respond quickly if the user overdoses. Although many observers believe that solitary drug use grew substantially during the early phases of the COVID‑19 pandemic, we have not found a way to assess this quantitatively. Similarly, we can speculate that other key risk factors like anxiety and social isolation might have contributed to the early‑pandemic growth in overdose deaths, but we have not found any systematic evidence that could enable us to evaluate these possibilities. In the next two parts of this section, we explore potential explanations that are more quantifiable: (1) participation in medication‑assisted treatment and (2) homelessness.
Medication‑Assisted Treatment for Opioid Use Disorders
Medication‑Assisted Treatment. In the context of opioids, the term “medication‑assisted treatment” refers to ongoing treatment for opioid use disorder with buprenorphine, methadone, or naltrexone. Naltrexone blocks the effects of opioids, whereas buprenorphine and methadone reduce cravings and withdrawal symptoms. Only federally registered treatment programs may dispense methadone. The other two medications are available in a wider range of clinical settings.
Participation in Facility‑Based Treatment Dropped Substantially in Early 2020. Figure 12 displays statewide enrollment in medication‑assisted treatment from a survey of treatment facilities, which we discuss in more detail in the Appendix. As shown in the figure, enrollment in these programs was 42 percent lower in March 2020 than in March 2019. These enrollment numbers rebounded by March 2021 but still remain noticeably below pre‑pandemic levels. This pattern suggests that early‑pandemic changes in access to medication‑assisted treatment might have contributed to the rapid growth in overdose deaths in 2020. On the other hand, the rebound in enrollment, while incomplete, suggests that access to this type of treatment is less likely to explain the persistently high level of overdose deaths.
Buprenorphine Prescriptions Likely Did Not Offset Decline in Facility‑Based Treatment. A substantial amount of medication‑assisted treatment—particularly treatment with buprenorphine—occurs in other clinical settings besides the treatment facilities described in Figure 12. We examine buprenorphine prescription trends in these settings using two different data sources, which we discuss in more detail in the Appendix. Although the two sources provide conflicting information about many aspects of this trend, they both indicate that buprenorphine prescriptions did not rise in 2020. This means that the early‑pandemic decline in facility‑based treatment likely was not offset by rising buprenorphine use in other settings.
Overdose Deaths Among People Experiencing Homelessness
In recent years, the state’s growing homelessness problem has been a highly salient issue for the Legislature and for the public more broadly. Many people experiencing homelessness struggle with substance use disorders, so one might wonder about potential relationships between homelessness and the rise in young adult overdose deaths. We use data from Los Angeles County to explore this issue below.
Mortality Estimates for People Experiencing Homelessness Available for Some Counties, but Not Statewide. Neither the national vital statistics system nor administrative data from the state track homelessness mortality systematically, so we cannot provide a statewide summary of deaths among young adults experiencing homelessness. That said, researchers who examine death certificates closely can reasonably infer whether the decedent likely was experiencing homelessness. Some California counties have investigated this issue thoroughly enough to publish aggregate statistics on deaths among people experiencing homelessness. As described below, Los Angeles County has done so in a way that helps shed some light on the relationship between homelessness and overall drug overdose mortality.
Much of the Growth in Los Angeles County Overdose Deaths Occurred Among People Experiencing Homelessness. As a first step, we look at the role of homelessness in overall drug overdose mortality trends in Los Angeles County. From 2019 to 2022, Los Angeles County drug overdose deaths grew by 97 percent. Drug overdose deaths among people experiencing homelessness account for 42 percent of this growth. (We cannot narrow the homeless mortality data to the 15 to 44 age range, so these numbers are not age‑specific.) People experiencing homelessness face a particularly high risk of overdose death, and they are numerous enough to contribute very substantially to the overall countywide trend.
In Los Angeles County, Homeless Overdose Death Rate Has Grown Much Faster Than Homeless Population. Among people experiencing homelessness in Los Angeles County, the total number of overdose deaths grew from 341 in 2019 to 826 in 2022—an increase of 142 percent. To better understand this growth, we break it into two pieces: (1) growth in the size of the homeless population and (2) increasing risk of overdose mortality among people experiencing homelessness. Over this period, the estimated number of people experiencing homelessness in Los Angeles County grew by 17 percent, but their per capita overdose death rate doubled. These numbers suggest that most of the county’s growth in overdose deaths has not occurred simply because more people are living on the streets. Rather, other factors that affect the risk of overdose death both for housed and unhoused people—such as the pervasive presence of fentanyl—appear to be more important.
Alcohol Trends
Continuing the discussion of substance use, we now turn our attention to alcohol‑induced deaths. Compared to drug overdoses, these deaths have played a smaller but nevertheless significant role in recent age 15 to 44 mortality trends.
Before Pandemic, Alcohol‑Induced Young Adult Deaths Were Growing. As shown in Figure 13, alcohol was killing a growing number of California young adults even before the COVID‑19 pandemic. On average, these deaths grew 2 percent per quarter in 2018 and 2019.
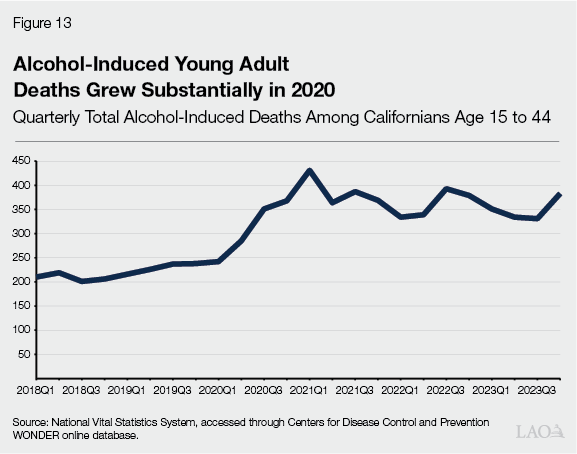
Growth Accelerated in 2020. The growth rate in alcohol‑induced young adult deaths accelerated substantially in early 2020 and continued to grow quickly throughout that year. The quarterly growth rate in 2020 was around 9 percent.
Alcohol‑Induced Deaths Still Much Higher Than Before Pandemic. Since 2020, alcohol‑induced young adult deaths have fluctuated from one quarter to the next, but have remained elevated. As a result, the number of such deaths in 2023 was 53 percent higher than in 2019.
Trend in Alcoholic Liver Disease Likely Driven by Group With Preexisting High Risk. As discussed earlier in this report, alcoholic liver disease and mental/behavioral disorders due to alcohol use each account for roughly equal parts of the growth in alcohol‑induced young adult deaths. Figure 13 clearly shows the growth rate in these deaths accelerating abruptly in early 2020. Notably, however, people generally do not develop alcoholic liver disease until they have been drinking heavily over the course of several years or more. As such, this portion of the mortality trend likely was not related directly to broad changes in alcohol consumption across the general population. Instead, we suspect that it consisted of relapses or other disruptions that affected a particularly vulnerable population who already had serious liver problems going into the pandemic. To get to this point by early adulthood, these individuals must have started drinking heavily when they were relatively young.
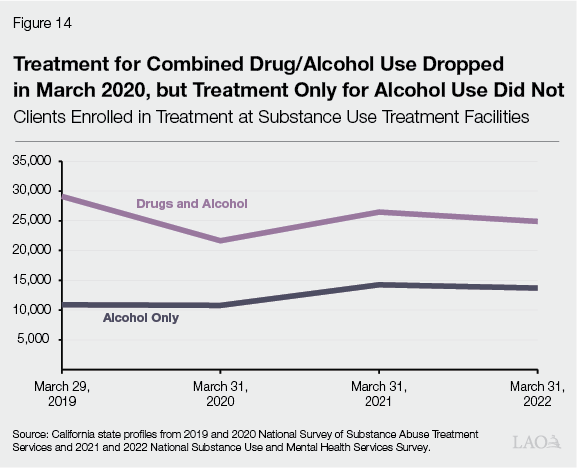
Treatment for Combined Drug/Alcohol Use Dropped in Early 2020, but Treatment Only for Alcohol Use Did Not. Among potential explanations for the alcohol mortality trend, one that could be especially relevant for this group is access to treatment for alcohol use disorders. Earlier in this report, we used data from federal surveys of treatment facilities to look at trends in treatment for opioid use. Now we use the same data source to look at trends in treatment for alcohol use. The results appear in Figure 14. Enrollment in treatment for combined drug and alcohol use has followed a pattern reminiscent of the opioid treatment trend: a large drop in 2020 followed by a partial rebound in subsequent years. Enrollment in treatment only for alcohol use, however, has followed a very different trend. The number of patients enrolled in this type of treatment held steady from 2019 to 2020, then grew substantially from 2020 to 2021.
Overall Alcohol Consumption Did Not Change Much in 2020. As discussed earlier in this section, we would not necessarily expect the rapid 2020 growth in alcohol‑induced deaths to be related to broad changes in aggregate statewide alcohol consumption. Indeed, as shown in Figure 15, overall alcohol consumption (through all channels, including stores and bars/restaurants) changed only modestly in 2020. Sales of beer and distilled spirits rose a bit higher than their 2019 levels, while wine sales dropped a bit.
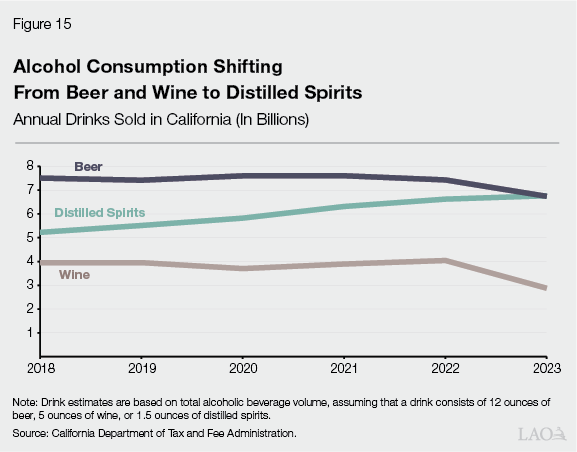
Over Time, Alcohol Consumption Shifting From Beer and Wine to Distilled Spirits. Although we see no indication that aggregate alcohol consumption contributed to the early‑pandemic mortality trend, Figure 15 does show a noteworthy trend. Over time, alcohol consumption appears to be shifting away from beer and wine towards distilled spirits. Distilled spirits consumption has risen consistently every year, with 2023 consumption exceeding 2018 consumption by 30 percent. Beer and wine consumption were roughly flat from 2018 to 2022, but both declined substantially in 2023: beer by nearly 10 percent and wine by nearly 30 percent. These striking trends are worth monitoring as the state considers potential changes to its alcohol policies.
A Closer Look at Motor Vehicle Deaths
In this section, we discuss the remaining cause of death that has contributed substantially to the age 15 to 44 mortality trend: motor vehicle crashes.
Trend in Young Adult Motor Vehicle Deaths
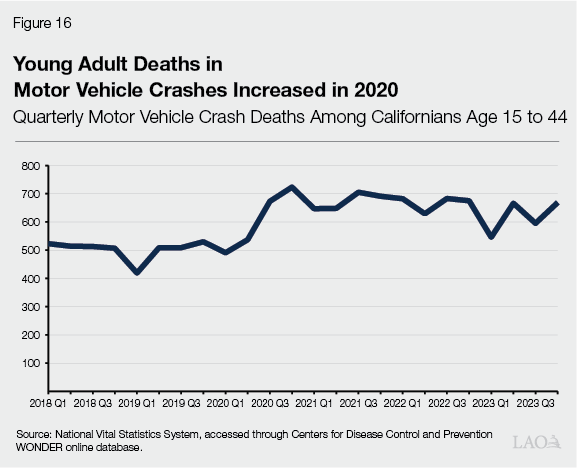
Age 15 to 44 Deaths in Motor Vehicle Crashes Increased in 2020. Figure 16 displays total quarterly motor vehicle crash deaths among Californians age 15 to 44 over the last six years. From 2018 through the first half of 2020, the trend was roughly flat around 500 deaths per quarter. These deaths jumped to 673 in the third quarter of 2020, then to 723 in the fourth quarter of 2020. Since then, they have been declining gradually but remain in the range of 600 to 700 per quarter, far above the pre‑pandemic level.
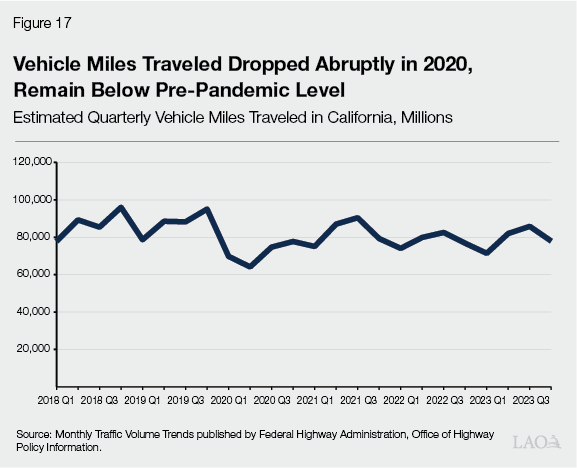
Deaths Increased Despite Substantial Decline in Driving. Strikingly, the rapid growth in motor vehicle deaths occurred shortly after a rapid drop in the total amount of driving. As shown in Figure 17, vehicle miles traveled (VMT) on California roads dropped 18 percent in 2020 compared to 2019. Although road travel has rebounded a bit since 2020, it remains well below pre‑pandemic levels. In 2023, statewide total VMT were still 10 percent lower than in 2019. (Age‑specific VMT are not available.)
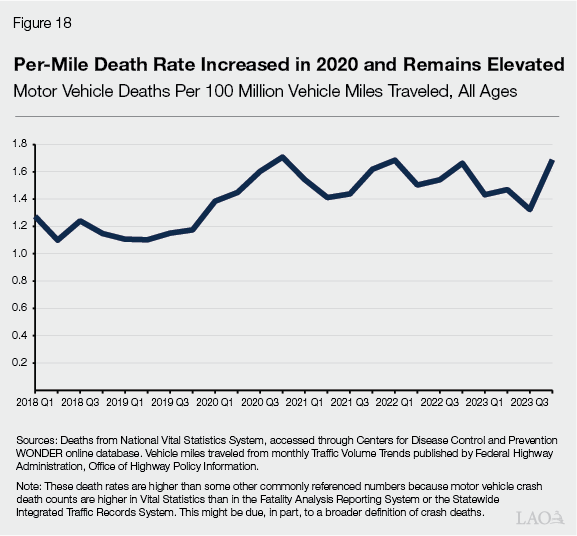
Per‑Mile Death Rate Increased in 2020 and Remains Elevated. An increase in deaths and a drop in driving means the per‑mile death rate has increased significantly, as shown in Figure 18. From early 2018 through late 2019, crash deaths per 100 million VMT were roughly flat around 1.2. The death rate per 100 million VMT started growing fast in the first quarter of 2020—coinciding with the initial drop in driving—and peaked at 1.7 in the fourth quarter of 2020. This rate has been roughly flat around 1.5 since 2021. (This measure looks at deaths across all ages because, as noted above, age‑specific VMT are not available.)
Growth Roughly Evenly Split Between State Highways and Local Roads. Many transportation policies and programs make a major distinction between the state highway system and local roads. Using data from the Fatality Analysis Reporting System, we estimate that 54 percent of California’s pandemic‑era growth in age 15 to 44 motor vehicle deaths has occurred on the state highway system. The other 46 percent of the growth has occurred on local roads. This nearly even split indicates that the mortality trend is a substantial concern for both systems.
Trends by Mode of Transport
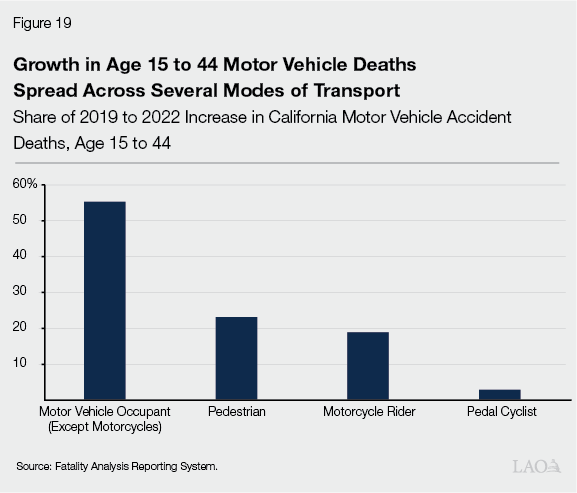
Growth in Deaths Spread Across Several Modes of Transport. In Figure 19, we break down California’s pandemic‑era growth in age 15 to 44 motor vehicle deaths by the mode of transport of the person who died. Motor vehicle occupants (except motorcyclists) account for 55 percent of this growth. Motorcyclists, pedestrians, and pedal cyclists account for 19 percent, 23 percent, and 3 percent respectively.
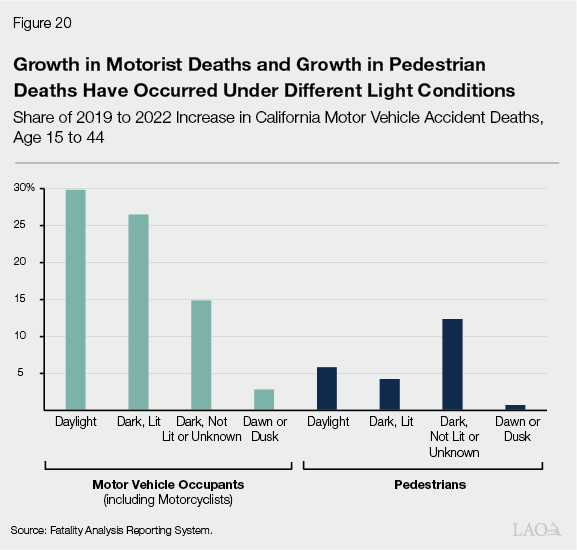
Growth in Motorist Deaths and Growth in Pedestrian Deaths Have Occurred Under Different Light Conditions. Visibility is a key issue in transportation safety, especially in relation to walking and biking. For this reason, we further examine mode‑specific mortality trends under various light conditions. The results appear in Figure 20. Overall, nighttime crashes—including both lit and unlit roadways—account for nearly 60 percent of the state’s pandemic‑era growth in young adult motor vehicle deaths. Crashes under the poorest light conditions account for a particularly large share of the growth in pedestrian deaths. Specifically, 53 percent of the growth in young adult pedestrian deaths has occurred under dark skies without street lighting. In contrast, crashes under these conditions account for just 20 percent of the growth in young adult motorist deaths.
Has Driving Behavior Changed?
Next, we explore some potential explanations for California’s pandemic‑era growth in age 15 to 44 motor vehicle deaths. In general, traffic safety depends on vehicle characteristics, the design and maintenance of the road system, driving behavior, and various other factors. Looking back at Figures 16 and 18, however, the trends we are trying to explain are not gradual changes. We are looking for factors that can account for rapid growth in motor vehicle fatalities over the course of several months to a year. As such, this section explores potential explanations related to various aspects of driver behavior.
California Highway Patrol (CHP) Citations for Extreme Speeding Grew During Pandemic. Driving speed is a major risk factor for motor vehicle fatalities. We have seen some indications that extreme speeding has grown substantially. As shown in Figure 21, citations issued by CHP for driving over 100 miles per hour nearly doubled between 2019 and 2020. CHP citations for driving over 100 miles per hour declined a bit after 2020, but the number of such citations was still 29 percent higher in 2023 than in 2019.
Traffic Congestion Declined During Pandemic. Why are so many people speeding? Perhaps it could be related to traffic congestion. The presence of many vehicles on the road can force drivers to slow down, while the absence of such vehicles can have the opposite effect. We explore this possibility in Figure 22. As shown in the figure, quarterly total vehicle hours of delay (a key measure of traffic congestion) on state highways plummeted by more than 75 percent in the middle of 2020. Much like the trend in overall driving, highway traffic congestion experienced only a partial rebound. Although vehicle hours of delay rose after the initial months of the pandemic, they were still 34 percent lower in 2023 than in 2019. This persistent decline in traffic congestion potentially could be contributing to higher rates of speeding and higher death rates.
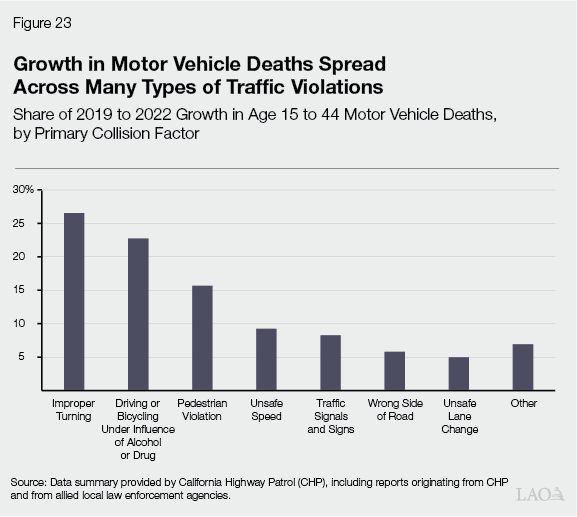
Growth in Motor Vehicle Deaths Spread Across Many Types of Traffic Violations. After every fatal crash, law enforcement agencies determine which type of traffic violation was the “primary collision factor” leading to the crash. As noted above, many factors can contribute to crashes, some of which fit neatly into this framework and some of which do not. Nevertheless, this information can help us make some progress towards understanding the trend in motor vehicle deaths.
As shown in Figure 23, California’s pandemic‑era growth in age 15 to 44 motor vehicle fatalities is spread across many different primary collision factors. The one that lines up most clearly with the discussion above is “unsafe speed,” which accounts for 9 percent of the growth. Additionally, driving at unsafe speeds could be a secondary factor contributing to many of the other deaths. For example, improper turning—such as failing to navigate a curve properly or swerving to avoid an object in the roadway—accounts for the biggest share of the growth, 27 percent. Higher speeds plausibly could increase the risk of a fatality from improper turning. Likewise, even when pedestrian violations—such as jaywalking—are the primary collision factor, faster‑moving vehicles presumably have a harder time stopping or slowing down to avoid fatalities. That said, looking at the overall pattern, the growth appears to be spread across many different primary collision factors, including some whose connection to speeding is tenuous at best. The most straightforward interpretation is that a broad increase in various types of risky driving behaviors likely accounts for a substantial portion of the mortality trend.
Law Enforcement Stopping Fewer Drivers for Moving Violations Since the Pandemic. As we explore potential explanations for the rise in age 15 to 44 motor vehicle deaths, another key factor to consider is traffic enforcement. Law enforcement agencies’ strategies for enforcing traffic laws involve various activities that interact with each other in complex ways, so any attempt to quantify enforcement will have some serious limitations. That said, trends in stops for moving violations can give us a reasonable starting point for understanding changes in traffic enforcement activities over time.
Figure 24 displays trends in the total number of stops for moving violations by CHP and by the state’s seven largest local law enforcement agencies. CHP stops dropped 25 percent in the second quarter of 2020 but mostly rebounded in the third quarter of 2020. Since then, stops have been trending slightly downward and were about 10 percent below pre‑pandemic levels in 2022 (the most recent year for which data are available).
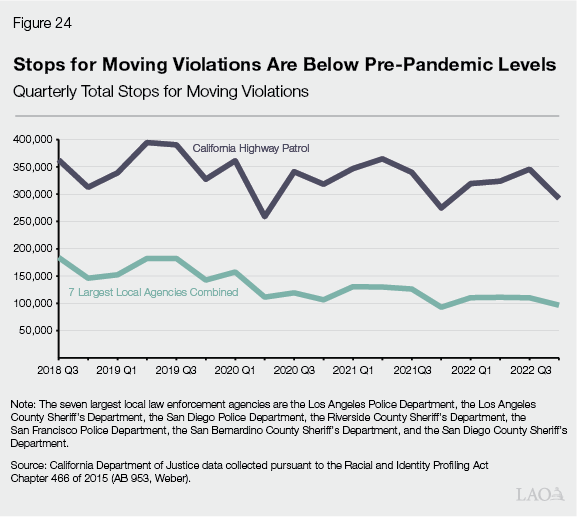
Stops for moving violations made by the state’s seven largest local law enforcement agencies dropped 32 percent in the second quarter of 2020. Unlike the CHP trend, however, stops by local law enforcement did not rebound after this mid‑2020 dip, with stops remaining at a depressed level through 2022. These persistent declines in stops are particularly striking given that the mortality data do not seem to suggest any decline in dangerous driving—if anything, the opposite. The declines could be driven by various factors, including staffing levels or policy changes.
Trends in Stops Vary Across Local Law Enforcement Agencies. Moving violation stops by five of the seven agencies (Los Angeles Police Department, San Diego Police Department, San Francisco Police Department, San Bernardino County Sheriff, and San Diego County Sheriff) declined over this period, with the declines ranging from 23 percent to 86 percent. Moving violation stops by two of the agencies (Los Angeles County Sheriff and Riverside County Sheriff) grew over this period.
Enforcement Among Several Factors Potentially Driving Mortality Trend. At the beginning of this section, we observed that young adult motor vehicle deaths rose abruptly in 2020 and have been roughly flat since. This trajectory lines up rather closely with the trend in local stops for moving violations, so changes in enforcement activities conceivably could be contributing to the trend in motor vehicle deaths. That said, there are a couple of reasons to think that enforcement might not be the primary explanation for these trends. First, various other factors—such as the decline in traffic congestion noted earlier—also have coincided with the mortality trend and likely have played a substantial role. Second, crashes on state highways—where CHP is responsible for traffic enforcement—account for a slight majority of the growth in motor vehicle deaths. Most of the increase in motor vehicle deaths occurred in the second half of 2020, when CHP stops were around the same level as before the pandemic.
Issues for Legislative Consideration
Young Adult Mortality Warrants Substantial Attention From State Leaders and Researchers. In California and the rest of the nation, age 15 to 44 mortality is still much higher than before the COVID‑19 pandemic. This trend has been especially pronounced for men, Native American and Black Californians, and residents of rural northern counties and the state’s lowest‑income zip codes. This report presents information about some potential explanations for these trends, but developing a full understanding of its origins will require substantial additional research. At the same time, the urgency of the problem compels us to recommend that state leaders start to consider potential policy responses immediately.
Explore Options in Key Policy Areas… Breaking down the mortality trend by causes of death, we have highlighted the importance of drug overdoses, alcohol‑induced deaths, and motor vehicle crashes. One of the major factors driving the overdose trend has been the growing presence of fentanyl in California’s illicit opioid markets. Extreme speeding and other risky driving behaviors likely have played significant roles in the trend in motor vehicle deaths. These trends present major challenges for the Legislature to tackle through policies and programs related to drugs, alcohol, and traffic safety. In the 2025‑26 session, we encourage the Legislature to explore options in these areas both through the budget and policy processes.
…But Also Consider Issue More Broadly. The specific areas listed above are a natural starting point for responses to the young adult mortality problem. A key purpose of this report, however, has been to illustrate a broader picture than those we can see through specialized policy lenses. By taking this view, we hope that readers have gotten a sense of the size and seriousness of the overall problem and of the stark disparities between groups.
For researchers, we note that changes in several seemingly disparate types of risky behavior have persisted several years past the onset of the pandemic. Future research could explore potential connections among these behaviors, as well as the extent to which they could be due to the COVID‑19 virus itself, policy responses to the pandemic, or other social changes that have occurred in 2020 and beyond.
For policymakers, we note that responses to young adult mortality need not be limited to the areas listed above. The Legislature also could look for opportunities to address this problem through other areas of health policy and public safety policy.
Appendix
Data Describing Medication‑Assisted Treatment
Data From Two Complementary Sources. To analyze trends in medication‑assisted treatment, we explore data from two sources. These sources describe two different parts of the treatment landscape, with largely complementary strengths and weaknesses.
Surveys of Treatment Facilities. The federal Substance Abuse and Mental Health Services Administration (SAMHSA) conducts an annual survey that elicits information from all dedicated substance use treatment facilities. Before 2021, SAMHSA collected this information through the National Survey of Substance Abuse Treatment Services. Starting in 2021, SAMHSA combined this survey with another one to form the National Substance Use and Mental Health Services Survey. Among other things, these surveys ask facilities about the number of patients enrolled in substance use treatment in late March of each year. Notably, these surveys do not capture treatment provided in other types of clinical settings (for example, by primary care physicians). They also do not specify patients’ ages, so our analyses of medication‑assisted treatment are not age‑specific.
As with all survey data, the reliability of these measurements depends heavily on the accuracy and representativeness of responses. One encouraging sign is that response rates for this survey tend to be high. Although the survey response rate dipped a bit in 2021 (to 74 percent), the response rates in 2020 and 2022 were very similar to 2019 (all 85 to 86 percent). Consequently, we think that changes in survey nonresponse likely are not driving the overall pattern shown in Figure 12.
State Prescription Database. The state maintains a prescription database known as the Controlled Substance Utilization Review and Evaluation System (CURES). In many cases, pharmacists and other health care practitioners must report their dispensing of controlled substances to be included in this database. These reporting requirements do not apply when health care practitioners administer the drugs directly, rather than dispensing them to patients. They also do not apply when patients receive drugs from a SAMHSA‑funded substance use treatment facility. Given these limitations, our CURES analysis focuses on buprenorphine, which we understand to be more widely used for opioid use disorder than naltrexone and available in a wider range of clinical settings than methadone. We review aggregate CURES data on buprenorphine prescriptions from two sources: (1) the California Department of Public Health’s (CDPH) Overdose Surveillance Dashboard and (2) a paper by Wang et al. (2024).
Conflicting Evidence on Buprenorphine Prescription Trends
Different Trends Despite Same Underlying Data. CDPH’s Overdose Surveillance Dashboard and a paper by Wang et al. (2024) present conflicting information about statewide trends in buprenorphine prescriptions. The substantial differences in the trends presented by these two sources are puzzling given than they both use the same underlying data source: the state’s CURES database. We describe the disparate trends and some technical data issues below.
Dashboard Indicates Large Jump in Buprenorphine Prescriptions in Early 2021. CDPH’s Overdose Surveillance Dashboard summarizes quarterly statewide total buprenorphine prescriptions from CURES. The most prominent feature of this summary is a large jump in the first quarter of 2021. According to the Dashboard, buprenorphine prescriptions rose 35 percent from the fourth quarter of 2020 to the first quarter of 2021. We have not found a satisfactory explanation for this abrupt increase. Several policy changes plausibly could have expanded access to buprenorphine substantially in recent years, but the timing of these changes does not line up very well with this jump in the data. Additionally, a state law (Chapter 677 of 2019 [AB 528, Low]) changed some CURES reporting requirements effective January 1, 2021, but we would not expect this law to have major effects on buprenorphine reporting.
Aside from the sharp increase described above, notable features of the Dashboard summary include:
- Growth throughout 2018.
- A decline in 2019.
- Stagnation from late 2019 through 2020.
- Growth throughout 2021 and beyond.
Study Using Same Data Source Displays Very Different Trend. Figure 1, Panel C in Wang et al (2024) displays monthly buprenorphine prescriptions from CURES. This figure shows no abrupt increase in early 2021. Furthermore, it shows:
- Growth in 2019.
- A period of decline from late 2019 through early 2020.
- Stagnation through much of 2020, then a decline at the end of the year.
- Stagnation through 2021.
These patterns are strikingly different from the ones presented on the Dashboard. That said, as noted in the main text of the report, the two sources both indicate that buprenorphine prescriptions did not increase in 2020 to offset the decline in facility‑based treatment.
What Could Explain These Differences? The underlying CURES data include various specific products that health care practitioners prescribe. Researchers must exercise some discretion as they decide which specific product names should count as buprenorphine for the purpose of tracking aggregate trends in medication‑assisted treatment. From follow‑up discussions with both sets of researchers, we understand that the Wang et al. (2024) analysis includes a broader set of buprenorphine products than the CDPH dashboard. To investigate this issue, CDPH examined an alternative version of their Dashboard summary using a definition of buprenorphine much closer to the one provided by Wang et al. (2024). Unfortunately, however, this alternative analysis still did not come very close to matching the patterns shown in the Wang et al. (2024) figure. The reason for the discrepancy remains elusive.
Selected References
Ahmad, Farida, Jodi Cisewski, Lauren Rossen, and Paul Sutton (2024). “Provisional Drug Overdose Death Counts.” National Center for Health Statistics.
Badger, Emily, Ben Blatt, and Josh Katz (2023). “Why Are So Many American Pedestrians Dying at Night?” The New York Times, December 11, 2023.
California Department of Public Health, Office of Policy and Planning (2024). California State of Public Health Report, 2024.
Case, Anne and Angus Deaton (2015). “Rising Morbidity and Mortality in Midlife Among White Non‑Hispanic Americans in the 21st Century.” Proceedings of the National Academy of Sciences 112(49):15078‑15083.
Fowle, Matthew and Giselle Routhier (2024). “Mortal Systemic Exclusion Yielded Steep Mortality‑Rate Increases In People Experiencing Homelessness, 2011‑20.” Health Affairs 43:226‑233.
Humphreys, Keith, Chelsea Shover, Christina Andrews, Amy Bohnert, Margaret Brandeau, Jonathan Caulkins, Jonathan Chen, Tom Coderre, Mariano‑Florentino Cuellar, Yasmin Hurd, David Juurlink, Howard Koh, Erin Krebs, Anna Lembke, Sean Mackey, Lisa Larrimore Ouellette, Brian Suffoletto, and Christine Timko (2022). “Responding to the Opioid Crisis in North America and Beyond: Recommendations of the Stanford‑Lancet Commission.” Lancet 399:555‑604.
Spencer, Merianne and Farida Ahmad (2016). “Timeliness of Death Certificate Data for Mortality Surveillance and Provisional Estimates.” National Center for Health Statistics.
Wang, Yun, Alexandre Chan, Richard Buettler, Marc Fleming, Todd Schneberk, Michael Nicol, and Haibing Lu (2024). “Real‑World Dispensing of Buprenorphine in California During Prepandemic and Pandemic Periods.” Healthcare 12, 241.
