Helen Kerstein
January 7, 2025
Assessing California's Climate Policies—Residential Electricity Rates in California
- Introduction
- What are the Main Components of the Electricity System?
- Which Entities Provide Electricity Services?
- What Do Electricity Rates Pay For?
- How Are Electricity Rates Set?
- How Are Residential Rates Currently Structured?
- How Do Electricity Rates in California Compare?
- Why Are California’s Electricity Rates High?
- Why Do Some IOU Customers Pay More Than Others?
- What Are Potential Implications of High Electricity Rates?
- What are Emerging Issues That May Affect Rates?
- Conclusion
Summary
Residential Electricity Rates Are High and Growing. California’s electricity rates are among the highest in the country. On average, residential electricity rates in California are close to double those in the rest of the nation, mostly driven by high rates charged by the state’s three large investor‑owned utilities (IOUs). California electricity rates also have been increasing rapidly in recent years—not only growing faster than inflation but also outpacing growth in other states. These trends currently are on track to continue.
Various Reasons for High and Growing Rates. Although the specific reasons for California’s relatively high rates have not been precisely quantified, some of the key factors include: significant and increasing wildfire‑related costs, the state’s ambitious greenhouse gas (GHG) reduction programs and policies, and differences in utility operational structures and services territories. Many of these factors are particularly significant for customers of IOUs (as compared to those served by publicly owned utilities [POUs]). Additionally, within a given utility, the rates that residential customers pay can vary widely. This is largely due to California’s relatively robust cost‑reduction programs for low‑income households and rooftop solar customers, which are subsidized by other ratepayers who do not qualify for those discounts.
High Electricity Rates Put Strains on Residents and Impede Efforts to Meet Climate Goals. High and increasing electricity rates add cost burdens to ratepayers across the state. Many residents who earn lower incomes or live in hotter regions of the state are feeling these growing costs even more acutely. High electricity rates also impede the state’s efforts to meet its ambitious climate goals by discouraging households from pursuing electrification through switching out their fossil fuel‑powered cars and appliances.
Legislature Faces Difficult Choices Around Electricity Rates. Various emerging issues have the potential to affect residential electricity rates in California. These include the increasing stringency of the state’s GHG reduction goals, growing demands for electricity in the state, and increasing wildfire‑related costs. To the extent that these factors raise electricity rates, that will increase already high cost burdens on Californians and make meeting the state’s ambitious climate goals through electrification even more difficult. Accordingly, the Legislature likely will confront difficult decisions about how to approach electricity rates in order to best support its varied goals, including balancing the desires to both mitigate and adapt to climate change as well as preserve affordability.
Introduction
Report Addresses Key Questions About Residential Electricity Rates. California’s electricity rates are among the highest in the country. On average, residential electricity rates in California are close to double those in the rest of the nation. California electricity rates also have been increasing rapidly in recent years and are projected to continue to outpace inflation over the next few years. In this report, we explore key questions that frequently emerge around residential electricity rates in California, discussing issues such as why electricity rates are high in the state and some resulting implications, including for the state’s climate change‑related goals.
Report Intended to Provide Basic Information, Develop Common Understanding. This report is intended to help the Legislature and others better understand the basics of electricity rates, including their relationship to climate policies. This information can, in turn, help provide context to the Legislature as it considers its policy options for addressing its multiple goals, including those related to both climate change and affordability. Because this report is intended to serve as an initial “primer” for developing a common understanding around how rates work and related issues, it does not include an in‑depth analysis of those issues and their potential impacts, nor specific policy recommendations.
Report Meets Statutory Requirement. This report is submitted pursuant to Chapter 135 of 2017 (AB 398, E. Garcia), which requires our office to report annually on the economic impacts and benefits of the state’s GHG emissions reduction targets. Consistent with the statutory direction, this report discusses the potential economic impacts and benefits of the state’s GHG targets, focusing on residential electricity rates. The report also describes certain other important issues related to residential electricity rates, such as explaining the structure of rates and factors apart from the state’s GHG emission targets that contribute to the amounts that Californians pay for electricity.
What are the Main Components of the Electricity System?
A basic familiarity with the electricity system is key to understanding electricity rates. As discussed below, the electricity system includes the infrastructure that generates electricity and delivers it to customers.
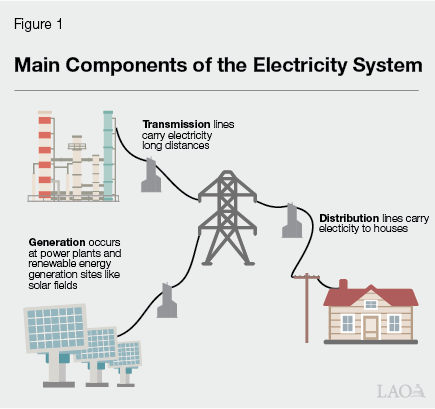
Electricity System Includes Three Main Components. The primary components of the electricity system are shown in Figure 1 and summarized below:
- Generation. Most electricity is generated at large power plants (such as natural gas, coal, or nuclear power plants) or “renewable energy” generation sites (such as wind farms or solar fields). (Renewable energy typically includes sources of energy that are replenished naturally and regularly, such as by the sun, wind, or water.) Some electricity generation also occurs at a smaller scale, such as solar panels installed on the rooftops of residences or businesses (known as “rooftop solar”) or in other community locations.
- Transmission. Electricity generated at power plants and renewable energy generation sites is transported through high‑voltage power lines known as transmission lines.
- Distribution. Generally, electricity is transferred from high‑voltage transmission lines to low‑voltage distribution lines before it is delivered to customers. Distribution lines are often visible on wooden poles that run through cities and neighborhoods but sometimes they are placed underground.
Which Entities Provide Electricity Services?
A wide variety of entities—both public and private—play roles in operating the electricity system and providing services to households across the state.
Load Serving Entities (LSEs) Procure Electricity and Deliver It to Customers. LSEs are responsible for generating or purchasing electricity and ensuring it is delivered to households through the transmission and distribution systems. Historically, utilities have been the primary LSEs and have been granted nearly exclusive authority to provide electricity within designated areas (known as service territories). Figure 2 shows the service territories of the various utilities that provide service throughout the state. As shown in the figure and discussed below, the state’s utilities fall within two main categories: IOUs and POUs.
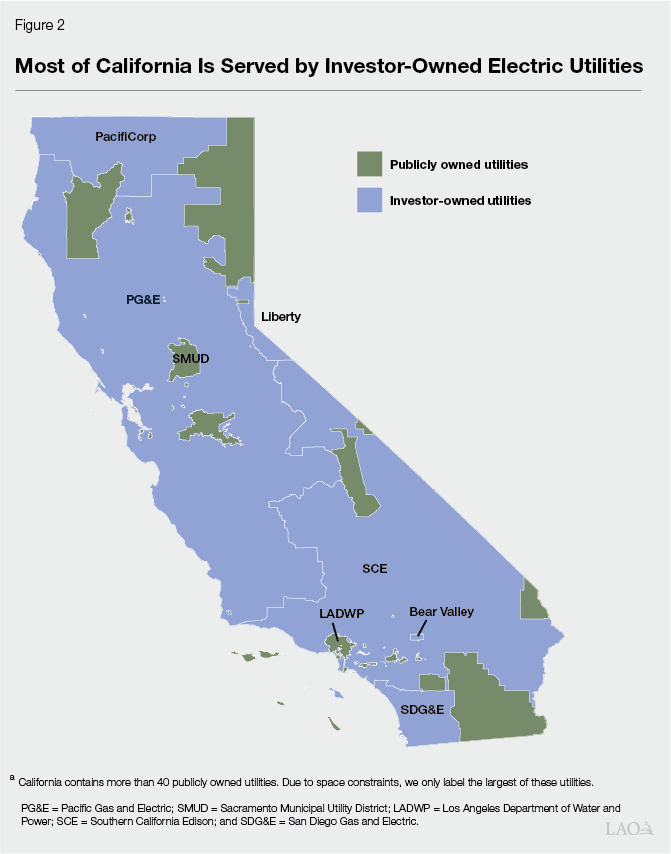
Most Californians Served by IOUs. IOUs are private companies that typically are overseen by corporate boards. As such, IOUs have fiduciary responsibilities to their owners—such as their shareholders—to maximize their profits. California is home to three large IOUs—Pacific Gas and Electric (PG&E), Southern California Edison (SCE), and San Diego Gas and Electric (SDG&E)—as well as three smaller ones noted in the figure. Roughly three‑quarters of statewide electricity is distributed in IOU service territories, which cover the bulk of the state’s land area.
Many POUs Also Serve Californians. In addition to IOUs, various POUs also provide services in the state. POUs are public agencies that are governed by locally elected or appointed officials. As such, POUs are owned by their customers, and their focus is maximizing value for those they serve. The largest POUs in the state are the Los Angeles Department of Water and Power (LADWP) and the Sacramento Municipal Utility District (SMUD). In addition to these large entities, more than 40 smaller POUs provide service across the state. Together, POUs provide roughly one‑quarter of statewide electricity. (In addition to IOUs and POUs, a few nonprofit cooperatives operate in California, but these entities are small in number and provide service to relatively few households, so we do not discuss them in this report.)
Community Choice Aggregators (CCAs) Are Another Type of LSE That Serves Customers in IOU Territories. The state allows for competition with utilities in some limited forms within IOU service territories. Most notably, state law authorizes the establishment of CCAs, which are local government‑run entities that buy electricity for customers. CCAs are responsible for the generation portion of the electricity provided to customers, while the IOUs continue to be responsible for the transmission and distribution parts of the system. IOUs also provide meter reading, billing, and maintenance services for CCA customers. CCAs have grown in recent years as more local communities have sought to expand consumer choices available to their residents; 25 now operate in various regions of the state. Currently, nearly 40 percent of the electricity consumed in IOU territories is purchased through CCAs.
Various Entities Generate Electricity. A number of different entities generate the electricity that LSEs sell to customers. In some cases, LSEs own and operate their own power plants and renewable energy generation sites. In other cases, private companies own these types of facilities and sell the electricity they produce to LSEs. Notably, small‑scale solar installations within communities, such as rooftop solar, usually are owned by the property owner or a third‑party company that installs the generation source.
California Independent System Operator (CAISO) Oversees Electricity Reliability for Most of the State. CAISO serves as the electricity “balancing authority” for much of the state, and is responsible for allocating space on transmission lines, maintaining electricity operating reserves in order to meet reliability standards, and matching electricity supply with demand.
What Do Electricity Rates Pay For?
LSEs charge customers for providing electricity services. In this report, we generally refer to these charges—regardless of how they are structured—as rates. As we discuss below, electricity rates support the main components of the electricity system, as well as various other activities.
Electricity Rates Pay for the Main Components of the Electricity System. Electricity rates pay for the construction, maintenance, and operation of the electricity system, including the generation, transmission, and distribution components. This is true for customers of all LSE types.
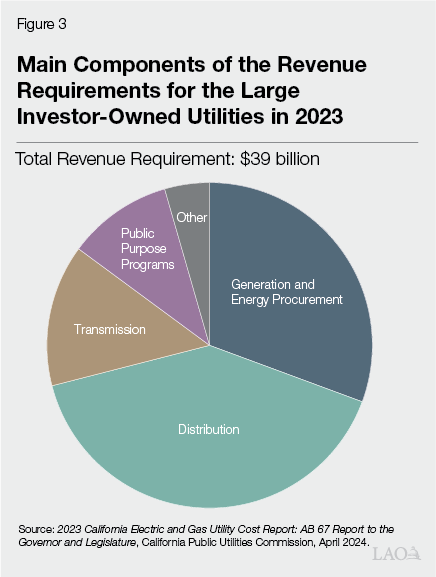
IOU Rates Also Support Various Other Activities. In addition to supporting the main components of the electricity system, revenue generated through electricity rates also pays for various other activities that generally are not directly related to providing electricity services. Most notably, the state and IOUs use revenue generated from electricity rates to support various state‑mandated public purpose programs. These programs have goals such as increasing energy efficiency, expediting adoption of renewable energy sources, supporting the transition to zero‑emission vehicles (ZEVs), and providing lower‑income customers with financial assistance. For example, the largest public purpose program is California Alternate Rates for Energy (CARE), which provides discounts targeted at lower‑income customers. (We discuss the CARE program in further detail later in this report.) Additionally, electricity rates support various other costs, such as related to decommissioning nuclear facilities. Figure 3 provides a breakdown of the relative magnitude of the activities that rates supported for the three large IOUs in 2023.
Electricity Bills Include Some Additional Charges. Electric utility bills often reflect a number of other state and local taxes and charges. For example, many local jurisdictions impose utility taxes that are used to support local programs, such as fire response and parks. Also, the state assesses a charge on electricity use and deposits that revenue into the Energy Resources Programs Account (ERPA). The state uses this account to pay for various energy programs and planning activities—mostly staff and operations at the California Energy Commission (CEC).
POU Rates Also Support Some Other Activities, but Typically at More Modest Levels. Notably, POU customers pay for only a subset of the above costs paid by IOU customers. For example, while POU customers support ERPA and often pay local utility taxes, they generally do not pay for the public purpose programs discussed above. In some cases, POU ratepayers do pay charges for similar types of programs. For example, POUs typically operate their own programs to promote energy efficiency and provide discounted rates to lower‑income customers within their service territories. Under the statewide requirements imposed by Proposition 26 in 2010, however, POUs are limited in their ability to support new or expanded programs and activities that are not directly related to providing electricity services, such as expansions to programs that provide discounts based on income.
Costs of Many of the Activities Funded Through Rates Are Fixed. Many of the costs recovered through rates—particularly those associated with the transmission and distribution components of the electricity system, as well as many of the public purpose programs—are “fixed” in that they do not vary based on the amount of electricity used. Estimating precisely which utility costs are fixed can be challenging and depends on the time horizon under consideration. However, in a 2021 report, economists at the University of California at Berkeley (UC Berkeley) estimated that roughly two‑thirds to three‑quarters of the costs that IOUs recover through rates are fixed, with the precise share depending on the utility. The high fixed costs of building and maintaining the transmission and distribution portions of the electricity system are a main reason why utilities historically have been granted nearly exclusive authority to operate in designated regions, as it would be costly to have multiple providers run parallel transmission and distribution lines to a given area.
How Are Electricity Rates Set?
In this section, we discuss how the government—including at the local, state, and federal levels—controls and oversees electricity rates to ensure the revenue they generate is sufficient to allow LSEs to adequately fund their systems and the other costs discussed above, while protecting consumers from unreasonable charges.
Government Oversees Electricity Rates to Ensure Reasonableness. Since the government grants utilities nearly exclusive authority to operate in designated areas of the state, it also plays an important role in ensuring they do not take advantage of their market power to charge unreasonable rates. The processes that the government uses to ensure reasonableness differ across IOUs, POUs, and CCAs.
- IOU Rates Set by the California Public Utilities Commission (CPUC). CPUC—a state‑level agency—is the primary entity charged with overseeing electricity rates for IOUs, a role it carries out through various types of proceedings. For example, every four years, CPUC authorizes a utility’s rates through what is known as a General Rate Case proceeding. CPUC also conducts a variety of other types of proceedings, such as to determine the rate of return a utility is authorized to receive (known as a Cost of Capital proceeding) and how much it should be compensated for purchasing fuel and power (known as an Energy Resources Recovery Account proceeding).
- POU and CCA Rates Set by Local Governing Boards. In the case of POUs, the utility itself is a government agency—thus, the state government does not regulate POU rates. Rather, governing boards which consist of local elected officials set POU rates. Under a similar rationale, local governing boards typically oversee the rates that CCAs charge their customers for electricity generation and purchases.
Notably, the Federal Energy Regulatory Commission—rather than CPUC or local elected officials—generally oversees the transmission portion of electricity rates, as transmission infrastructure can cross state lines.
Electricity Rate‑Setting Processes Include a Few Key Steps. The rate‑setting process for electric utilities is complex. The process generally includes the following main steps:
- Step 1: Determine Revenue Requirement. Typically, the first step that rate‑setting entities take is to determine the amount of money the utility should be allowed to recover through rates to support the main components of the electricity system and other activities. This is known as the revenue requirement. CPUC sets IOUs’ revenue requirements such that they can recover the value of their capital investments multiplied by an authorized rate of return. (The rate of return is a key factor affecting the level of profit the IOU is able to generate for its shareholders.) CPUC is charged with setting a rate of return that compensates shareholders at a level that is consistent with the returns they would receive on investments of similar risk. Additionally, IOUs are allowed to recover an amount that reflects the depreciation on their capital investments. Finally, IOUs are allowed to pass through certain other costs to ratepayers (but not receive a rate of return on these costs), including their maintenance and operation costs, electricity procurement costs, and the costs of the public purpose programs discussed previously.
- Step 2: Determine How to Allocate Costs to Residential and Nonresidential Customers. The second step in the process is to determine the portion of the revenue requirement that should be generated through rates paid for by households (known as residential rates) versus those paid for by other groups of customers such as businesses. This division generally is intended to align with the costs of serving each group. (Currently, we estimate that about 40 percent of the revenue requirements for all California utilities are recovered through residential rates.)
- Step 3: Determine How to Structure Residential Rates. The third step generally includes determining how to structure the rates for residential customers to generate the required revenues. This includes determining how much of the money should be generated from fixed charges versus from volumetric charges. (Fixed charges are amounts assessed on each service connection that are the same for all customers within specified categories, whereas volumetric charges are amounts that vary based on the amount of electricity a particular customer uses.) This third step also includes decisions on the level and structure of fixed and volumetric charges, including across different groups of customers. (As we discuss in more detail below, most IOU customers with solar panels and/or who are low income generally have different rates from other groups of customers.) In some cases, CPUC’s actions on how to structure portions of IOU rates are guided by explicit direction from the Legislature. For example, statute specifies the range of discounts the CARE program must provide and, as we discuss further below, provides some direction on how fixed charges should be assessed.
How Are Residential Rates Currently Structured?
In this section, we discuss how electricity rates currently are structured as a result of the rate‑setting processes discussed above. For the remainder of the report, we focus on residential rates rather than rates paid by businesses. For illustrative purposes, Figure 4 shows a simplified sample bill for an IOU customer with various charges and credits. A POU bill would look similar, but omit some of the specific charges or credits. This is because, as noted earlier, not all POUs participate in the types of ratepayer‑funded programs that IOU customers are required to support. (We note that some consumers also get energy from natural gas—for which charges could appear on the same bill as electricity—but we do not discuss natural gas in this report.)
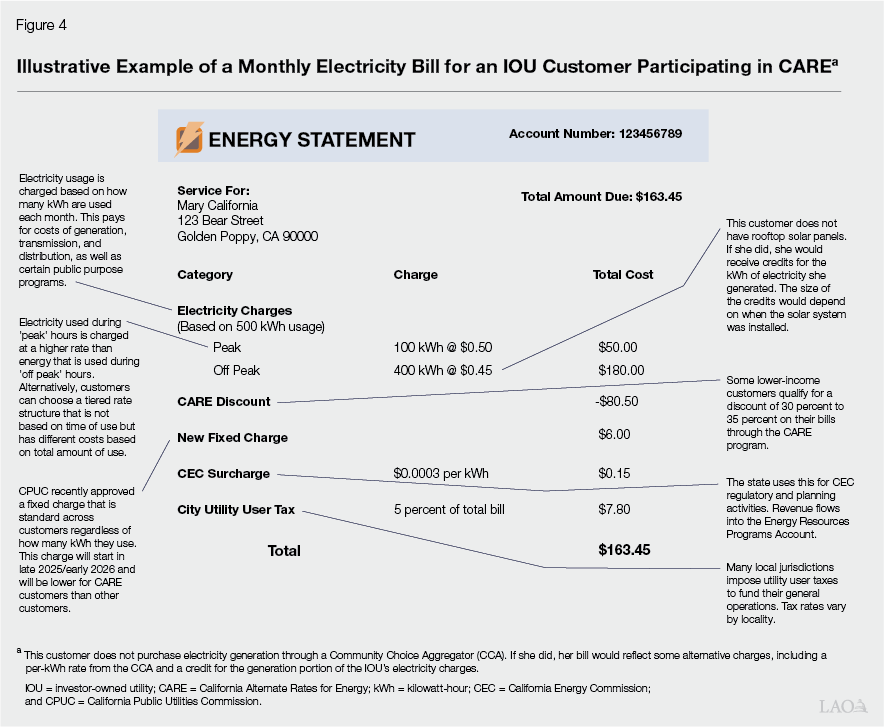
Most Costs Are Collected Through Volumetric Charges Rather Than Fixed Charges. As mentioned above, a key decision for CPUC and POU boards when they are structuring rates is how much of the revenue requirement to recover from fixed charges (a set amount per month) versus volumetric charges (an amount based on how much electricity the customer uses). To date, even though most of the costs of providing electricity are fixed, California electricity rates have been structured to collect most revenue through volumetric charges. Historically, some POUs have had some modest fixed charges in addition to volumetric charges. For example, SMUD assesses a monthly fixed charge of $24 and LADWP assesses a monthly fixed charge of $12. Until recently, however, state law has prohibited IOUs from assessing fixed charges of more than $10 per month. In practice, CPUC historically has not authorized IOUs to impose any fixed charges, in large part due to concerns that they could discourage electricity conservation. The limited use of fixed charges in California contributes to the need to charge relatively high volumetric rates to meet utility revenue requirements.
Recent Legislation Requires CPUC to Authorize IOUs to Collect Fixed Charges. Chapter 61 of 2022 (AB 205, Committee on Budget) modified state law to repeal the $10 limit on fixed charges and required CPUC to authorize fixed charges that vary by income for residential electricity rates. In accordance with Chapter 61, CPUC issued a decision in May 2024 that will impose some fixed charges on IOU customers starting in late 2025 or early 2026. Notably, the magnitude of these charges—roughly $24 per month for non‑CARE customers and $6 per month for CARE customers—is roughly in line with the amounts charged by various POUs in the state. However, these new fixed charges are more modest than those originally proposed to CPUC by the IOUs, which would have been as high as $128 per month for some higher‑income households.
Level of Volumetric Charges Often Varies by When or How Much Electricity Is Used. Electric utilities typically offer residential customers various options for rate structures, such as time‑of‑use rates and tiered rates. A time‑of‑use rate plan includes volumetric charges that vary according to the time of day and season, with higher charges during “peak” hours when electricity is relatively scarce and lower charges “off peak” when electricity is relatively plentiful. This type of rate plan is intended to discourage households from using electricity when it is comparatively difficult and costly for LSEs to purchase. (In the box below, we discuss how electricity availability can vary.) In contrast, a tiered rate plan assesses different volumetric charges depending on the total amount of electricity used by the household, with the per‑unit charge increasing as a household uses more energy. This type of rate plan is intended to promote conservation by charging more for using substantial amounts of electricity.
Balancing Electricity Supply and Demand Is Important—and Difficult
A key challenge facing those who operate the electricity system in the state is how to precisely balance electricity supply and demand at all times given that both fluctuate over the course of a day and across different seasons.
To Avoid Significant Disruptions, Electricity Supply Must Always Meet Demand. Electricity is different from other commodities in a variety of ways. For example, the amount of electricity that the grid supplies must always equal the level demanded by households and other electricity users. If this balance were not maintained and demand were to exceed supply, consequences might include disruptions to the grid, brownouts, and potentially even blackouts that could spread throughout the electricity system.
Electricity Cannot Be Easily Stored. Another key difference between electricity and most other commodities is that—unlike water or food, for example—electricity cannot be readily and cheaply stored. While it is possible to use a variety of technologies—such as batteries or pumped hydropower (which uses electricity to pump water to a higher elevation for future power generation)—to convert electricity into other forms of energy for later use, these technologies typically are expensive to deploy.
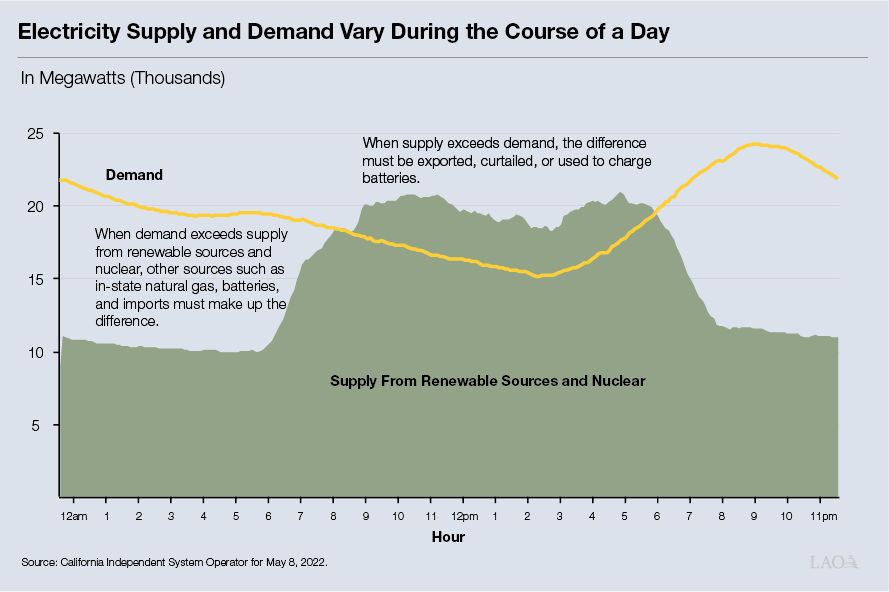
Electricity Demand and Supply Also Vary… Supply and demand for electricity each vary by time of the day, season of the year, and short‑term weather patterns. Typically, electricity use is highest in the evenings when household members return home from work and use electric appliances, particularly during summer months when many households seek to keep their homes cool. In contrast, electricity production—particularly from solar panels—usually peaks in the middle of the day (especially in summer months) and declines in the evenings just as demand rises. (The figure below shows an illustrative example of how supply and demand for electricity can vary over the course of a day.)
…Which Can Create Challenges. Such temporal variations make balancing the supply and demand for electricity more difficult. In some cases, large amounts of solar generation can lead to an oversupply of electricity during certain times and days. This can result in a need to export electricity to other states or to curtail, or shut off, some of the electricity generated from renewable resources to maintain grid stability. In other cases, high demand for electricity—such as during the evenings of long summer heat waves—can make finding adequate supplies challenging. For example, in August 2020, California and other western states experienced a heat wave for several consecutive days, which triggered the California Independent System Operator to implement rotating power outages that affected hundreds of thousands of electricity customers across the state.
Price Signals Can Be Used to Help Address Imbalances. One approach to address the challenges with balancing electricity supply and demand is using price signals to help influence customers’ usage. Time‑of‑use rates are one way to do so, since they assess higher volumetric charges during hours when electricity typically is relatively scarce and expensive, which can help reduce demand during those times. Utilities also use prices in more targeted ways to encourage households and businesses to modify their electricity use patterns. For example, the state’s investor‑owned utilities and many of its publicly owned utilities run demand response programs that pay customers for reducing electricity use during times of grid stress. The state also has employed other demand management approaches such as issuing notices asking customers to voluntarily reduce their usage during critical periods, known as “Flex Alerts.”
Rooftop Solar Customers Receive Credits for the Electricity They Generate. Under a statewide program called net energy metering (NEM), customers who have installed solar panels on their homes typically receive credits on their bills for the electricity those panels generate. As we discuss in the box below, the structures of such credits generally vary depending on whether the customers get electricity from an IOU or POU, as well as on when they installed their solar systems. Under NEM, however, the state historically has not required solar customers to pay for their full share of the fixed costs of the electricity system. As such, some of this cost burden has been shifted to other customers (often referred to as the solar cost shift).
Recent Changes to Net Energy Metering (NEM) Aimed at Mitigating Solar Cost Shifts
California Public Utilities Commission (CPUC) Recently Modified Structure of Solar Credits Provided to Investor‑Owned Utility (IOU) Customers. Customers of IOUs who contracted for solar installations before April 2023 participate in programs called NEM 1.0 or 2.0. Under these programs, customers generally are credited for the electricity that they generate at the IOU’s retail volumetric rate. In effect, the IOU pays customers the same rate per kilowatt hour for generated electricity as it charges for consumed electricity. IOU customers who contracted for solar systems to be installed after April 2023 are under a new system known as NEM 3.0 (also referred to as Net Billing Tariff), which compensates customers at a notably lower rate. Many publicly owned utilities also offer NEM programs, but the policies are adopted by their individual boards (rather than CPUC) and thus vary.
Adoption of NEM 3.0 Intended to Mitigate Projected Increases in Solar Cost Shift. The main explanation for why NEM 3.0 provides a lower amount of credit to solar customers compared to the previous NEM programs is that the new structure credits customers only for the costs the utility avoids by not having to buy electricity elsewhere to serve them. In contrast, because the credit in the earlier NEM programs was based on retail volumetric charges, the credits that customers received also essentially included some amount of utilities’ fixed costs—despite the fact that these customers continued to benefit from the infrastructure and activities those costs support. Consequently, CPUC’s primary rationale for adopting NEM 3.0 is that under NEM 1.0 and 2.0, customers without rooftop solar were effectively subsidizing those with solar. This is because when solar customers do not pay for fixed costs (as generally was the case with NEM 1.0 and NEM 2.0), the costs do not go away. Instead, those fixed costs typically must be built into the volumetric electricity rates that are paid by other (non‑solar) customers. CPUC’s estimates of the costs of the NEM program to non‑solar IOU ratepayers range from roughly 10 percent to 20 percent of an average non‑California Alternate Rates for Energy customer’s monthly electricity bill depending on the utility—accumulating to over $200 to $400 annually per customer. Furthermore, CPUC anticipated these costs would increase substantially over time, given the trends toward higher fixed costs in electricity rates and a growing share of ratepayers installing rooftop solar. At the same time, the rooftop solar industry has raised concerns that NEM 3.0 could discourage rooftop solar adoption by making it less financially attractive and has argued that greater solar adoption is important for helping the state achieve its climate goals.
Certain Low‑Income Customers Receive Discounts. As mentioned previously, utilities generally operate programs that provide discounted electricity rates to certain groups of customers, including lower‑income households and those that participate in certain public assistance programs. For example, under the CARE program, eligible customers of the large IOUs receive discounts of between 30 percent and 35 percent. Approximately 30 percent of IOU customers participate in CARE. POUs generally operate similar types of programs, although they often do not provide as large of a subsidy as CARE. For example, LADWP administers a program that provides a roughly 20 percent reduction in rates for eligible lower‑income customers. The costs of the programs that provide rate relief to lower‑income customers generally are passed on to other customers through higher rates.
CCA Customers Have Different Procurement Charges. CCA customers also have bills that differ somewhat from other customers. Specifically, they still receive bills from their relevant IOU but are charged for the CCA’s electricity generation costs instead of the IOU’s generation costs. (They still pay other IOU costs, including for transmission and distribution.) Also, CCA customers typically pay a charge intended to prevent higher costs for other remaining IOU ratepayers when customers switch to CCAs.
How Do Electricity Rates in California Compare?
In this section, we explore how electricity rates compare to other states, as well as how rates differ within California for different utilities and customers.
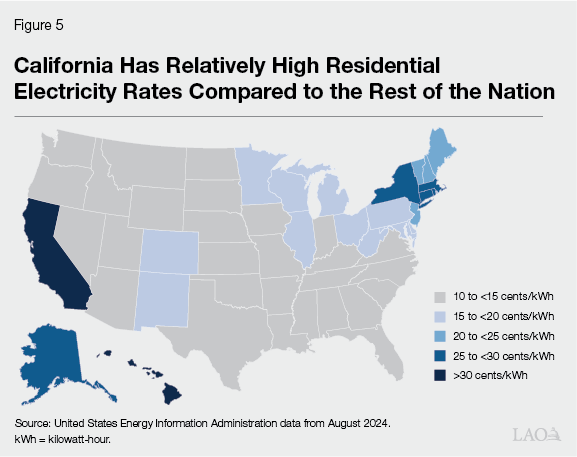
California Has the Second Highest Electricity Rates in the Nation. On average across all utilities and residential customers, electricity rates in the state are high relative to those in the rest of the country, as shown in Figure 5. Specifically, California has the second highest residential electricity rates after Hawaii, with average rates that are close to double the national average. As discussed in more detail below, these trends largely are driven by the relatively high rates charged by the state’s three large IOUs; the average rates charged by POUs in the state are closer to the national average.
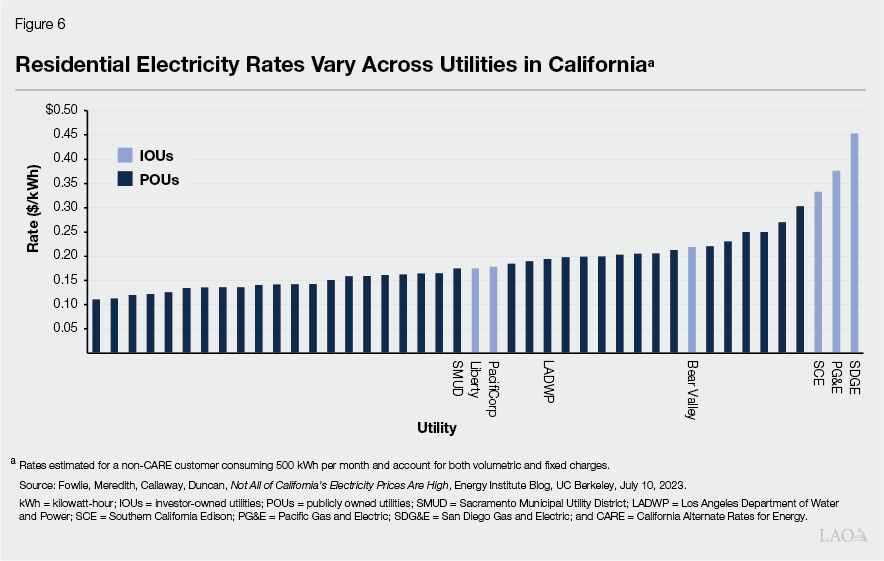
Electricity Rates Vary Between California Utilities, With Relatively High Rates in Large IOU Territories. As shown in Figure 6, Californians’ residential electricity rates vary widely across the state, depending on which utility provides their service. On average, California IOU electricity rates are more than 50 percent higher than rates charged by POUs. In some cases, the differences in rates between individual utilities are quite stark, even within similar geographic areas. For example, as displayed in the figure, PG&E’s residential electricity rates for a typical non‑CARE customer are more than double SMUD’s rates—so customers in Sacramento pay notably less for a comparable level of service compared to their neighbors in nearby Davis. Similarly, in the southern part of the state, SCE’s residential electricity rates for a typical non‑CARE customer are more than 70 percent higher than LADWP’s rates. Accordingly, customers in the portions of Culver City that are served by LADWP pay significantly less for electricity than those who live in the portions of the city served by SCE.
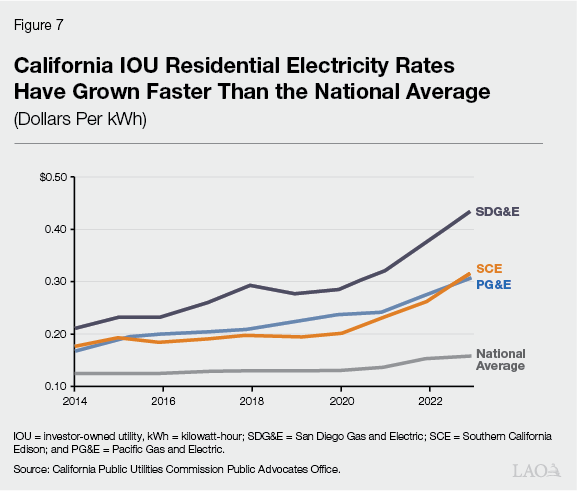
Electricity Rates Have Increased Notably in Recent Years. In general, average residential electricity rates in California have grown faster than inflation in recent years, rising by about 47 percent over the four‑year period from 2019 through 2023 compared to overall growth in prices of about 18 percent. This is particularly true for the state’s three large IOUs. Specifically, over the same four‑year period, PG&E, SCE, and SDG&E average rates have increased by between 48 percent and 67 percent. Additionally, although electricity rates in California have exceeded the national average for many years, the gap has grown substantially in recent years. As shown in Figure 7, the rates charged by California’s three large IOUs have grown significantly faster than the average electricity rates in the rest of the nation.
Within a Given Utility, Some Customers Pay Substantially More for Electricity Than Others. Within a given utility, the rates that residential customers pay can vary widely. For example, as mentioned above, lower‑income customers who participate in CARE pay significantly discounted rates—typically 30 percent to 35 percent lower. Additionally, solar customers receive credits for the energy they generate, which reduces the amount that they pay for electricity services.
Why Are California’s Electricity Rates High?
In this section, we explore possible explanations for why California’s electricity rates—especially average rates charged by the three largest IOUs—are relatively high, as well as why they have grown relatively quickly in recent years. In our review of available research, we did not find a comprehensive analysis quantifying all of the various contributing elements that result in the relatively high rates. However, as we discuss below, some of the key categories of factors that likely are driving these higher rates are: wildfire‑related costs, GHG reduction programs and policies, and differences in utility operational structures and services territories. Many of these factors are particularly significant for IOUs (as compared to POUs).
Higher Wildfire‑Related Costs
California Utilities, Particularly IOUs, Face Higher Wildfire Costs. California ratepayers—and especially its IOU ratepayers—typically pay more costs related to wildfires than other utility customers. Prior to 2019, only a negligible portion of the rates the three large IOUs charged were for wildfire‑related costs, but this has grown to between 7 percent and 13 percent of average non‑CARE bills. Some reasons for this include the state’s relatively high wildfire risk and its somewhat unique legal standard for apportioning liability for utility‑sparked wildfires. (Under California’s liability standard, POUs and IOUs are liable for all the costs associated with a utility‑caused wildfire, regardless of whether they are determined to have acted negligently.) The magnitude of the damages and risks from utility‑sparked wildfires have increased substantially in recent years. Correspondingly, IOUs have spent unprecedented amounts in recent years on wildfire mitigation‑related activities to try to reduce the likelihood of future utility‑caused wildfires, with the associated costs often passed along to ratepayers. Furthermore, California IOUs and their ratepayers pay for insurance against future wildfires, including contributing to the California Wildfire Fund. This fund, established by Chapter 79 of 2019 (AB 1054, Holden), helps cover the costs of certain utility‑sparked wildfire damages.
Ambitious GHG Reduction Programs and Policies
As discussed in the box below, the state has implemented various policies to reduce GHG emissions from the electricity sector. The state’s efforts to reduce its GHG emissions have helped establish California as a leader in climate policy and contributed to environmental benefits such as improvements to air quality. However, these efforts have come with costs, some of which have increased electricity rates. We are not aware of any research that comprehensively compiles the costs that California ratepayers bear as a result of the state’s efforts to meet its climate goals. However, we discuss some of the contributors to ratepayer costs below. We were able to identify estimated costs for some—but not all—programs and policies. Taken together, we think the state’s GHG reduction efforts have contributed notably to the state’s higher electricity rates, but they certainly are not the only factor. As discussed elsewhere in this report, a number of other important causes are driving high electricity rates as well.
California Has Adopted Ambitious Climate‑Related Goals Which Affect the Electricity Sector
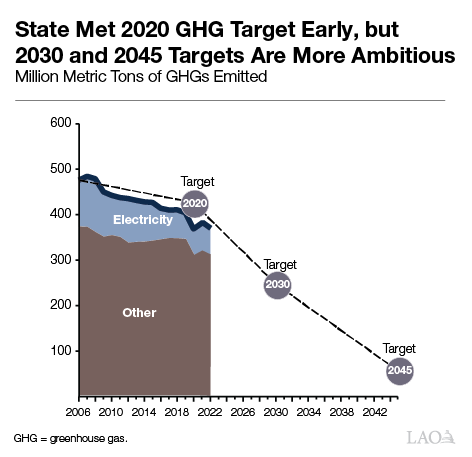
State Has Established Ambitious Greenhouse Gas (GHG) Reduction Targets. Chapter 488 of 2006 (AB 32, Núñez) established the goal of limiting GHG emissions statewide to 1990 levels by 2020. In 2016, Chapter 249 (SB 32, Pavley) extended the limit to 40 percent below 1990 levels by 2030. Chapter 337 of 2022 (AB 1279, Muratsuchi) further extended the limit, setting a goal of at least 85 percent below the 1990 level as well as achieving zero net carbon emissions by 2045. As shown in the figure, the state has been successful at decreasing emissions since AB 32 was enacted and it achieved its 2020 goal ahead of schedule. However, the level of reductions needed to reach the subsequent targets is much greater. Pursuant to Chapter 547 of 2015 (SB 350, de León), the California Air Resources Board also established specific 2030 GHG targets for emissions from the electricity sector.
State Has Implemented Various Goals and Policies Aimed at Reducing GHGs From Electricity. Over the past couple of decades, the state has implemented a variety of goals and policies intended to reduce GHG emissions from electricity generation and help the state meet its larger climate goals. For example, in 2003, the state implemented a Renewable Portfolio Standard, which generally requires load‑serving entities (LSEs) to provide a minimum percent of retail electricity sales from qualifying renewable generation. Since then, various statutes and regulations have set specific targets, including Chapter 312 of 2018 (SB 100, de León) which requires 60 percent renewable generation by 2030 and 100 percent zero‑carbon electricity by 2045. Additionally, Chapter 361 of 2022 (SB 1020, Laird) set interim targets to this goal, requiring that zero‑carbon sources make up 90 percent of statewide electricity sales by 2030 and 95 percent by 2035. The state also has established various programs aimed at encouraging rooftop solar specifically, including net energy metering. Another major GHG reduction policy that affects the electricity sector in California is the state’s cap‑and‑trade program. Under this program—first enacted in 2006 and currently authorized through 2030—in‑state electricity generators and electricity importers, among other entities, must obtain permits through the purchase of “allowances” or offsets to cover their GHG emissions.
This adds costs to higher GHG‑producing sources of electricity (such as natural gas power plants) and thus encourages a shift toward lower‑carbon sources (such as wind and solar).In order to ensure that the various activities undertaken by LSEs in response to these myriad programs and policies are adequate to enable the state to meet its climate‑related goals, LSEs must engage in a regular planning process known as Integrated Resource Planning.
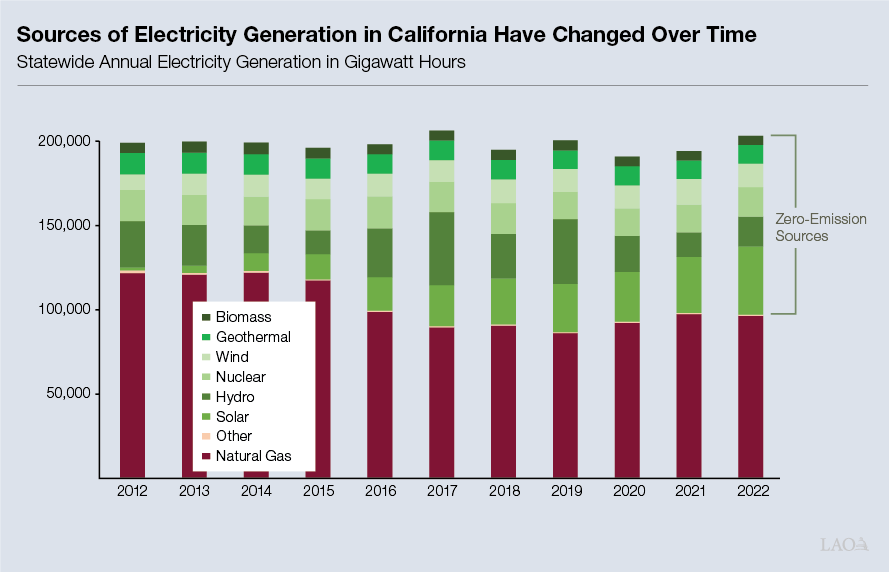
State Policies Have Contributed to GHG Reductions From the Electricity Sector. As highlighted in the figure, the electricity sector has been the primary driver of statewide GHG emission reductions since the state established its AB 32 goals. Annual emissions from the electricity sector have declined by nearly 40 percent over the past decade, compared to much more modest changes in the transportation, industrial, and other sectors. Over this time period, electricity use has been relatively stable. Thus, reductions mostly have been due to a change in the mix of resources used to generate electricity—primarily large increases in renewable sources such as solar, as shown in the figure below. As we discuss in our January 2020 report, Assessing California’s Climate Policies—Electricity Generation, we have not identified any studies that have comprehensively estimated how much of the state’s overall emission reductions are a result of state policies versus other factors, such as federal policies and technological innovation. However, when taken together, the state’s policies likely have played an important role in achieving the observed reductions.
Ratepayers Pay Additional Costs Associated With Transitioning to Cleaner Sources of Electricity. Electricity rates reflect the costs of implementing various policies to encourage utilities to use cleaner sources of electricity. For example, one of the key programs aimed at shifting the state’s mix of energy sources is the Renewable Portfolio Standard (RPS)—which requires utilities to provide a certain percentage of retail electricity sales from renewable generation. While the costs of generating electricity from renewable resources have declined in recent years, this transition still has added costs for ratepayers. In our January 2020 report, Assessing California’s Climate Policies ‑ Electricity Generation, we found that RPS costs resulted in an almost 5 percent increase in overall retail rates for IOU customers, which was generally consistent with national studies of RPS programs in other states. (We note, however, that nearly half of states do not have an RPS.)
In addition to contributing to somewhat higher generation costs, renewable sources of electricity often require additional investments in other infrastructure for transmission and reliability, which can be costly. For example, utility‑scale renewable generation sites frequently are located in remote areas that require new or upgraded transmission lines to reach. Additionally, renewable sources of electricity often are more intermittent than fossil fuel‑powered sources, and sources such as solar often generate electricity at times when it is relatively plentiful. Accordingly, as the share of electricity generated from these sources has increased, the state has had to take steps—such as preserving the availability of natural gas‑powered plants to operate when needed and increasing investments in battery storage—to ensure that adequate electricity supplies are available to meet demand at all times. The amount that the costs of these activities have contributed to rates is uncertain.
Ratepayers, Particularly Those Served by IOUs, Also Pay for Other State Programs Aimed at Helping the State Meet GHG Reduction Goals. California ratepayers not only pay for activities associated with shifting to more renewable sources of electricity, but also bear other costs related to supporting the state’s efforts to meet its GHG targets. For example, consistent with statutory direction contained in SB 350 in 2015, CPUC has authorized IOUs to implement a variety of ratepayer‑funded programs to help support statewide adoption of ZEVs, including installing publicly available charging stations. Senate Bill 350 further directed CPUC to authorize ratepayer‑funded energy efficiency programs to meet a goal of doubling energy efficiency savings by 2030. As a result of this and other legislation, IOU ratepayers are now supporting a range of ZEV, energy efficiency, and other climate‑related programs through the public purpose charges on their rates. For 2023, we estimate about 4 percent of average rates for the large IOUs is used for supporting climate‑related activities (equating to about half of the funding dedicated for public purpose programs). While many other states operate ratepayer‑supported energy efficiency programs, on average, we estimate that Californians contribute a notably greater share of their rates to such programs than is typical across the country.
Cap‑and‑Trade Not a Major Driver of Rate Increases. The state’s cap‑and‑trade program affects the costs of various sources of energy. However, it has not been a driver of net electricity rate increases for most households. This is primarily because the program is structured to provide utilities with “free” allowances to help them generate revenue they are then required to pass along to ratepayers in the form of a bill credit. Thus far, the total amount of this credit generally has more than offset the increase in costs associated with the utilities’ cap‑and‑trade program compliance.
Differences in Utility Service Territory and Operational Structures
A number of other factors that vary across different types of utilities could account for differences in rates within California and in comparison to other states. We discuss two of these factors—operational structures and services territories—below.
Operational Structures Differ. Another potential contributor to the difference in rates that exist within California is the operational structure of its LSEs. Specifically, IOUs are operated with the goal of generating returns for their shareholders. This, in turn, could lead to higher costs because—in contrast with POUs—electricity rates must pay for shareholder profits. Additionally, IOUs generally cannot benefit from tax‑exempt borrowing sources that are available to POUs, which could increase their operating costs in comparison. Also, some research—including a recent report by researchers at the United States Department of the Treasury and the London School of Economics and Political Science—has found that the rate of return that utilities are authorized to earn is persistently higher than what would be expected for investments of comparable risk. To the extent that this is the case, it could, in turn, encourage IOUs to spend more on capital projects (for which they can generate a rate of return) than is optimal, thus putting upward pressure on rates.
Service Territories Vary. Differences in service territories may also explain some of the rate differences that exist within California and compared to other states. For example, some states that have relatively low rates—such as Washington—benefit from proximity to relatively cheap sources of electricity generation such as hydropower. Also, within California, a wide variation exists in the characteristics of the territories that utilities serve. For instance, in contrast to SMUD, PG&E serves not only relatively dense, urban and suburban areas, but also vast areas that are relatively rural. A more rural region could have higher wildfire‑related costs, as well as higher average fixed costs associated with distributing electricity to homes because they are more spread out.
Why Do Some IOU Customers Pay More Than Others?
As mentioned previously, a wide variation in rates exists across different customers even within a given utility in California. Much of this disparity is explained by two major IOU programs: NEM for solar customers and CARE for low‑income households. As we discuss below, both programs shift costs between different types of customers—whereby some customer groups pay lower rates and other customer groups pay higher rates. As shown in Figure 8, NEM and CARE—along with wildfire‑related costs and public purpose programs—contribute to substantially higher rates for nonsolar, non‑CARE IOU customers.
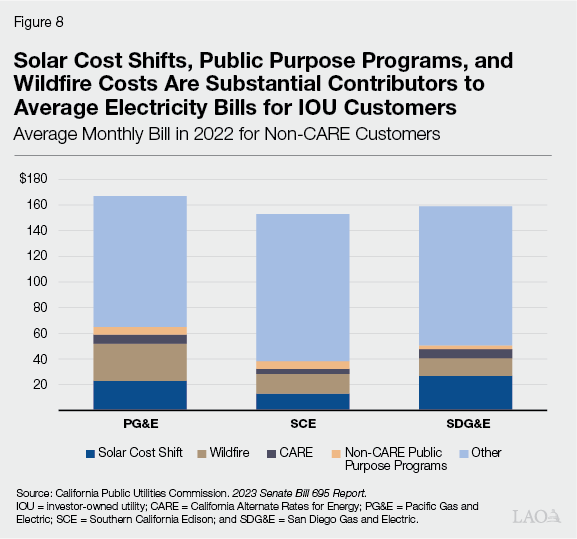
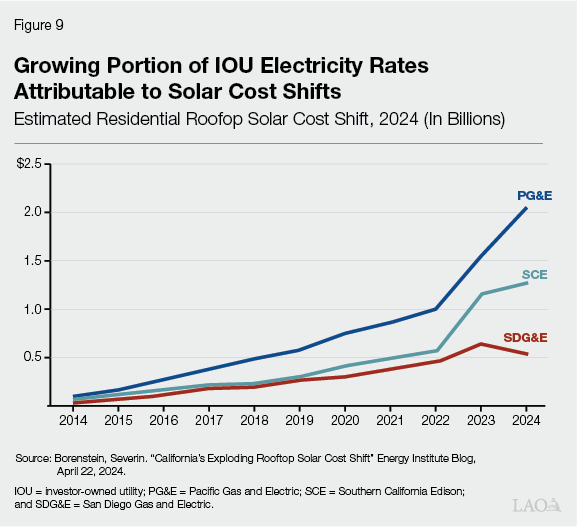
NEM Program for Customers With Rooftop Solar. As noted, solar customers in California have historically received large credits for the electricity they generate, which has shifted more of the burden for covering fixed costs to (and correspondingly raised rates for) nonsolar customers. These financial incentives have led to widescale rooftop solar adoption in recent years, exacerbating the cost shift impacts for customers who have not—or could not—take the same action. (California has among the highest rates of rooftop solar adoption and proportionally more solar customers than almost any other state.) Figure 9 illustrates the degree to which solar cost shifts have increased in recent years according to an analysis by an economist from UC Berkeley—more than doubling since 2020. This is because (1) the fixed costs of the electricity system have grown over time (increasing the amount of the costs that are shifted) and (2) the number of customers with rooftop solar has increased markedly (magnifying the impacts by spreading the costs across a smaller number of nonsolar customers). CPUC estimates that solar cost shifts contributed between 11 percent and 20 percent to non‑CARE non‑solar customers’ bills in 2023, up from between 8 percent and 17 percent just a year earlier. (Contributions to CARE nonsolar customers’ customer bills were generally similar.)
CARE Program for Low‑Income Households. Customers who qualify for CARE or other low‑income bill assistance programs have notably lower rates than those who do not. On the other hand, customers who do not qualify for these programs face higher costs both from the lack of discount and from paying to subsidize the costs of the program. CPUC estimates that CARE contributed between 2 percent and 4 percent to non‑CARE customer bills in 2022. (We estimate that, on average, California ratepayers contribute a greater share of their rates to low‑income bill‑assistance programs than most other states.)
What Are Potential Implications of High Electricity Rates?
In this section, we cover some of the key implications of California’s relatively high residential electricity rates, including on affordability and on statewide efforts that rely on electrification as a strategy to reduce GHG emissions.
High Rates Can Encourage Efficiency and Conservation… High electricity rates—particularly volumetric charges—make it costlier for Californians to use electricity. This has the potential to encourage Californians to conserve electricity, such as by wasting less and potentially switching to more efficient appliances. This, in turn, has environmental benefits since electricity generation often results in environmental impacts, including the emission of GHGs.
…But If Rates Are Too High, They Can Discourage Beneficial Electricity Use. Electricity is needed for many different types of essential—and desired—activities in modern life. If volumetric charges are too high, however, they can discourage electricity use even when such use would otherwise make sense for households, as well as for society as a whole. In recent research, economists at UC Berkeley have empirically estimated that this is the case in California. The implications of high volumetric rates are varied. For example, households might seek to save costs by avoiding running their air conditioners during hot days. This could lead to uncomfortable conditions in a home and, in more severe cases, increase the risk of heat stroke or other negative health effects.
High Rates Can Also Be Burdensome, Particularly for Certain Types of Customers. The costs associated with high electricity rates also can make it more difficult for customers to afford other goods and services. These costs can be particularly burdensome for lower‑ and moderate‑income residents. While programs such as CARE exist to help lower‑income customers afford electricity (by shifting costs to other customers), they still typically spend a larger share of their income on electricity. For example, according to data from the federal Bureau of Labor Statistics, California households in the lowest quintile of the income distribution typically spend about 6 percent of their before‑tax incomes on electricity, compared to less than 1 percent for the highest‑income quintile of households. Notably, high electricity rates also can impose burdens on moderate‑income earners, since they also pay a larger share of their household incomes toward electricity than their higher‑income counterparts but typically are not able to qualify for bill assistance programs. High electricity rates can also be disproportionally difficult for certain households located in inland areas who tend to use more electricity for air conditioning than those who live in milder coastal climates.
High Electricity Rates, Particularly When Assessed Volumetrically, Can Affect Electrification. Along with shifting the state’s electricity grid to more renewable sources, the state’s GHG reduction plans also include electrification of a substantial portion of other sectors. For example, the California Air Resources Board’s (CARB’s) 2022 Scoping Plan for Achieving Carbon Neutrality assumes that 80 percent of new heating, ventilation, air conditioning, and water heater sales will be electric by 2030, in both residential and commercial buildings. It also assumes that all in‑state sales of new passenger vehicles will be zero‑emission by 2035. However, consumer decisions about whether or not to adopt these alternative technologies depend, in part, on electricity rates. High electricity rates can discourage households from investing in electrification because they increase the operating costs of electric‑powered cars and appliances, making it harder for Californians to justify spending more on typically higher up‑front purchase costs for such goods. This dynamic could slow progress on the state’s climate goals. For example, recent research by a UC Berkeley professor found that household decisions on home heating technology are highly sensitive to energy prices, with a 10 percent increase in electricity prices estimated to decrease the choice to adopt electric sources of home heating (versus natural gas furnaces) by about 4 percentage points.
What are Emerging Issues That May Affect Rates?
In this section, we discuss some issues on the horizon related to residential electricity rates. We summarize these issues in Figure 10. While the precise impacts of these issues still are uncertain, they have the potential to affect future electricity rates—including the level and/or the structure—in meaningful ways. To the extent that they raise electricity rates, that will increase already high cost burdens on Californians and make meeting the state’s ambitious climate goals through electrification even more difficult. Accordingly, these issues have the potential to raise various—and potentially difficult—policy choices for the Legislature.
Figure 10
Key Emerging Issues That May Affect Electricity Rates and Legislative Decisions
|
Increasing Stringency of GHG Emission Reduction Requirements for Electricity Grid.
|
|
Accommodating More Electricity Demand From Electrification.
|
|
Growing Demands for Funding to Pay for Programs Aimed at Supporting State Climate Policies.
|
|
Continuing Wildfire‑Related Costs.
|
|
Trade‑Offs Related to Fixed Charges for Investor‑Owned Utility Customers.
|
|
GHG = greenhouse gas and CPUC = California Public Utilities Commission. |
Increasing Stringency of GHG Emission Reduction Requirements for Electricity Grid. As the state’s carbon reduction goals for electricity become more ambitious, they could impact rates for consumers. For example, as the share of renewable resources on the grid increases, the state likely will need to significantly increase its efforts to (1) prioritize renewable sources that provide reliable electricity when it is relatively scarce, even if those sources are more expensive than other alternatives, and (2) invest in solutions to help store electricity for when it is needed. The CEC/CARB/CPUC 2021 SB 100 Joint Agency Report: Achieving 100 Percent Clean Energy Electricity in California: An Initial Assessment estimates that the state will require six gigawatts (GW) of new solar, wind, and battery storage resources annually over the next 25 years to meet statutory renewable energy goals. This would represent a roughly tripling of the rate at which the state has built solar and wind historically, and an even larger increase in the rate of construction of battery storage. Moreover, the administration has established a planning goal of 25 GW of offshore wind from the California coast by 2045, and currently is undertaking a procurement of up to 7.6 GW on behalf of LSEs. (Available data suggests that offshore wind may be more expensive—at least in the near term—than some alternative generation sources, and that adding substantial offshore wind to the grid will require very large investments in port and transmission infrastructure.) The net effect of the state’s increasingly ambitious renewable goals on rates will depend heavily on the future trends in the costs of renewables, battery storage, and other technologies.
In the coming years, the Legislature likely will face questions about whether it is comfortable with the administration’s and LSEs’ energy procurement plans and the potential effects on ratepayers, or whether it would prefer an alternative approach. This could include an assessment of what options—and associated costs to ratepayers—are available for meeting the state’s statutory renewable energy goals and whether less costly approaches than those the administration plans to pursue might be more prudent. Fundamentally, however, the Legislature may also be faced with a frank decision about how to balance the state’s ambitious GHG reduction goals—and all of the associated benefits—against the inevitable costs that will result for ratepayers.
Accommodating More Electricity Demand From Electrification. In recent decades, electricity usage has been relatively stable in the state. However, CARB’s 2022 Scoping Plan for Achieving Carbon Neutrality projects that electricity demand will increase by more than 75 percent by 2045. This anticipated growth is fueled by the state’s ambitious goals for electrification—including a greater shift to ZEVs and electric appliances such as heat pumps—as well as by other factors such as growing demands from data centers and artificial intelligence. As electricity demand increases, so will the costs associated with building new sources of generation, as well as for the new distribution and transmission infrastructure that will be needed to bring the new generation to electricity users. The extent to which these and other costs associated with meeting additional electricity demand affect residential electricity rates will depend on various factors. For instance, a key determinant will be whether the growth in demand also brings an expanding customer base over which fixed costs can be spread.
Over the coming years, a key question facing the Legislature will be how to pay for the costs of the infrastructure required for electrification in ways that balance the state’s various goals, including related to technology adoption and electricity affordability. For example, the state will continue to face choices about how the costs to build infrastructure needed to support additional ZEV adoption—both at individual homes and businesses, as well affecting the broader grid—should be split across individual ZEV purchasers versus general ratepayers or state and federal taxpayers. Notably, while requiring ZEV purchasers to pay for these costs could impede ZEV adoption, having general ratepayers cover them would contribute to already high electricity rates, which likely would make future ZEV adoption less attractive for many consumers.
Growing Demands for Funding to Pay for Programs Aimed at Supporting State Climate Policies. As mentioned previously, the state has adopted goals for broad‑scale electrification, such as the expansion of ZEVs and electric appliances. Achieving these goals will not only require additional investments in the electricity system to support the additional demand, but also spending in other areas, such as to construct public ZEV charging infrastructure and to help residents—particularly those who earn comparatively lower incomes—to replace their vehicles and appliances.
In the coming years, the Legislature will face decisions about how much funding the state should contribute to support activities in pursuit of statewide climate goals versus how much private or other public parties should pay. In making these decisions, the Legislature likely will face trade‑offs related to its various priorities, such as equity and cost effectiveness. For example, providing significant incentives for lower‑income residents to purchase ZEVs likely is not the most cost‑effective approach to increasing overall ZEV adoption rates, but such an approach would support the goal of promoting equitable access to ZEVs across different groups of Californians. The Legislature also will face choices about how much of the funding to meet statewide electrification goals should come from electricity rates versus other sources of state revenues (such as tax revenues). While relying on electricity rates can be attractive as they do not require the Legislature to dedicate funding from new or existing taxes, an overreliance on rates can contribute to already‑high electricity rates and further burden lower‑income households, among others.
Continuing Wildfire‑Related Costs. Wildfire‑related costs are likely to continue to be a driver of increases in electricity rates, at least in the near term. This is in part because utilities plan to undertake more wildfire “hardening” activities over the coming years, such as placing power lines underground. The three major IOUs alone have proposed spending roughly $9 billion annually to be recovered—often along with a rate of return to compensate shareholders—through electricity rates. Additionally, regardless of the wildfire hardening activities that utilities undertake, preventing all utility‑sparked wildfires is not feasible. While the state has taken actions to insulate utilities and ratepayers from some of these costs—such as the passage of AB 1054 and establishment of the California Wildfire Fund—ratepayers still face some financial exposure in the event of a major wildfire sparked by utility infrastructure.
The Legislature will face decisions about how to ensure that utilities undertake the appropriate level and types of wildfire mitigation activities while balancing the often‑competing goals of reducing wildfire risks with maintaining reasonable costs for ratepayers. Additionally, the Legislature will encounter choices about how to fund whatever wildfire mitigation‑related activities it deems are appropriate—such as through fixed or volumetric electricity charges, state tax revenues, or other sources.
Trade‑Offs Related to Fixed Charges for IOU Customers. As residential electricity rates continue to increase, the issue of rate design likely will continue to be important. Under existing statute, CPUC has the authority to make future changes to the fixed charges that it recently authorized for IOUs. For example, other proposals discussed during CPUC’s recent proceeding included more steeply graduated fixed charges that differentiate across multiple household income categories. While CPUC ultimately decided against adopting such proposals this year, it could consider similar types of changes in the future. Adopting larger fixed charges could make it possible to reduce volumetric charges, which could encourage beneficial electricity use (such as more air conditioning in areas where it is needed) and support the state’s electrification goals. However, depending on the level of these fixed charges, they could also have significant effects on electricity bills for certain households—meaning some households would see an increase in monthly bills while others would see a decrease.
In the coming years, the Legislature will face decisions about whether it is comfortable with CPUC’s current authority and decisions related to fixed charges or would prefer a different approach. To the extent that the Legislature would like to modify CPUC’s authority, it will face choices about how it would like to do so, whether that be directing CPUC to increase fixed charges, returning to a statutorily defined cap on fixed charges, or pursuing another alternative.
Conclusion
Electricity rates are an increasingly important issue facing California. Electricity is a modern necessity, essential to keeping our homes cool and food from spoiling, maintaining basic human hygiene, and—with increasing prevalence—powering our transportation. Yet electricity rates in California are relatively high and have been increasing rapidly, putting growing strains on ratepayers across the state. Many residents who earn lower incomes or live in hotter regions of the state are feeling these growing costs even more acutely. High electricity rates also impede the state’s efforts to meet its ambitious climate goals, discouraging households from pursuing electrification by switching out their fossil fuel‑powered cars and appliances. In the coming years, the Legislature likely will confront difficult decisions about how to approach electricity rates in order to best support its varied goals, including balancing the desire to both mitigate and adapt to climate change as well as preserve affordability.
