Ryan Miller

February 5, 2025
Building California’s Behavioral Health Infrastructure
Progress Update and Opportunities for
the Proposition 1 Bond
- Introduction
- Background
- Behavioral Health Continuum Infrastructure Program
- BHCIP: Outcomes, LAO Assessment, and Opportunities for Legislative Oversight
- Summary of BHCIP Oversight Issues
Executive Summary
Program Is Building Wide Variety of Much Needed Behavioral Health Infrastructure. The behavioral health needs of Californians are not being met. The Behavioral Health Continuum Infrastructure Program (BHCIP) was created in the 2021 budget to help address the shortage of services. So far, BHCIP has awarded $1.8 billion in grants to build facilities meant to expand mental health and substance use disorder (SUD) treatment in California. This funding is being used to build a wide variety of facilities that will support a range of services for many Californians in need. These facilities are estimated to offer inpatient treatment to more than 2,600 people at any time and outpatient treatment to over 280,000 people annually. Proposition 1 (2024) will provide an additional $4.4 billion to the program. This report assesses the allocation of the $1.8 billion in awards already made to give the Legislature the tools to conduct oversight of the Proposition 1 funding that will be provided by way of BHCIP beginning May 2025.
Bulk of Dollars Being Used to Benefit Medi‑Cal Enrollees; Challenging to Assess Outcomes for Other Populations of Concern. BHCIP grant awards have broadly been focused on projects serving high shares of Medi‑Cal enrollees. Given that Medi‑Cal enrollees disproportionately experience serious mental health and SUD challenges, the program has been well targeted in this respect. Also, at least $540 million will go to projects focused on children and youth, who data show to face particularly great behavioral health challenges. Addressing BHCIP’s outcomes for other populations of concern, however, is more difficult. We suggest questions the Legislature can ask the administration in conducting oversight over this aspect of BHCIP.
Awards Could Be Better Aligned With Needs. Limited data on facility capacity poses challenges for assessing awards made for most facility types. In one area where a robust needs assessment has been performed (inpatient mental health facilities), however, we found that a majority of new capacity is being added in four (out of ten) regions of the state estimated to have the least need. Moreover, BHCIP has not made any progress in building these facilities in the region that was identified as having the greatest need (southern San Joaquin Valley). We also found that the methodology used by the administration for allocating funding may be reinforcing historical regional inequities in behavioral health infrastructure.
BHCIP Not Working Well in All Small Counties. The bulk of BHCIP funding was awarded in three main rounds of competitive grants, the same general structure that is being used in administering the Proposition 1 bond. On a per‑person basis, small counties overall received disproportionately more BHCIP dollars than larger counties in these grant rounds. This funding, however, has been concentrated within 11 out of 30 small counties. The remaining 19 small counties did not receive any awards in these rounds. In addition, there has been mixed success in siting behavioral health infrastructure in counties where it did not exist prior to BHCIP.
BHCIP May Not Be Working Well for All Grant Applicants. We identified a few program design details that may be posing barriers for potential applicants. For example, the administration has provided scoring preferences for launch‑ready projects throughout BHCIP, and continues to prioritize launch‑ready projects for awards made using Proposition 1 bond dollars. This approach may create a significant challenge for small and disadvantaged applicants and may be limiting the program’s success in siting the hardest‑to‑build facilities.
Oversight of BHCIP Needed to Maximize Success of Proposition 1 Bond. Proposition 1 adds another $4.4 billion to the BHCIP program, or about three times the amount of funding provided to BHCIP so far. This means that substantial resources exist that can be used to address the opportunities for improvement identified in this report. The administration is working quickly to allocate the first $3.3 billion of Proposition 1 bond dollars in May 2025, leaving a brief window in which to assess program outcomes achieved with the initial $1.8 billion and consider whether any changes in program administration are merited. This report includes findings and suggested questions the Legislature can use in conducting oversight over the program.
Introduction
In March 2024, voters approved Proposition 1. In addition to making broad changes to the Mental Health Services Act, Proposition 1 authorized a $6.4 billion general obligation bond, $4.4 billion of which is dedicated to building behavioral health infrastructure. The $4.4 billion comes on top of $1.8 billion in state and federal funds that have already been dedicated to this purpose in a multiyear spending initiative begun in 2021‑22—the Behavioral Health Continuum Infrastructure Program (BHCIP). (Behavioral health infrastructure includes inpatient and outpatient facilities at which individuals receive treatment for mental illness and/or substance use disorders [SUD], typically for a period of up to one day to several months.) The administration is working to allocate the bond funding quickly, with plans to award up to $3.3 billion in May 2025 and a stated commitment to award all funding by 2026. This leaves a brief window in which the Legislature can conduct oversight of the program and influence the administration’s program administration decisions.
This report focuses on the allocation of the $1.8 billion in awards already made to give the Legislature the tools to conduct oversight of the Proposition 1 funding that will be provided by way of BHCIP beginning May 2025. This report begins with background information on the state of behavioral health in California, behavioral health facilities, and BHCIP. Next, we assess outcomes achieved with the $1.8 billion, examining the types of facilities being built, regional distribution of awards, potential barriers for small and disadvantaged applicants, the extent to which the program is benefitting populations of concern, and the extent to which workforce shortages could pose challenges for BHCIP’s success. Throughout our assessment, we offer suggested questions the Legislature can ask the administration and others to assess the program’s efficacy in addressing behavioral health infrastructure gaps.
Background
The State of Behavioral Health in California
Rising Prevalence of Behavioral Health Conditions and Adverse Consequences. According to national survey data, the share of Californians experiencing serious mental illness (SMI) and SUD increased during the 2010s at alarming rates. From the three‑year period of 2008‑2010 to three‑year period of 2017‑2019, the share of California adults with SMI increased by around 50 percent, with the share of California young adults with SMI nearly doubling over the period. The share of Californians aged 12 and over having an SUD in the past year rose nearly 10 percent between 2015‑2017 and 2018‑2019. The consequences of these behavioral health challenges have also grown more severe. For example, from 2016 to 2023, the rate of opioid‑related overdose deaths increased four‑fold (from 4.9 per 100,000 residents to 19.6 per 100,000 residents). From 2008‑2010 to 2017‑2019, the share of California young adults surveyed who indicated having serious thoughts of suicide increased by about 50 percent, from 6.6 percent to 10.1 percent. From 2008‑10 to 2018‑20, rates of suicide in California among youth aged 15 through 24 increased by more than 20 percent. These troubling trends have accelerated since the COVID‑19 pandemic and have made improving California’s behavioral health system a priority for the state’s policymakers.
Demand for Behavioral Health Services Not Being Met. National survey data indicate that more Californians need behavioral health services than are receiving them. In 2021‑2022, 17 percent of Californians aged 12 and over had an SUD, but in 2022 fewer than 20 percent of those needing SUD treatment received it. (SUD rates cited here are significantly higher than in prior years due to an updated methodology used by the federal Substance Abuse and Mental Health Services Administration, or SAMHSA.) Similarly, in 2021‑2022, 22 percent of California adults had a mental illness. In 2022, fewer than 80 percent of those with a mental illness received mental health treatment. The shortage of mental health services is more severe for young adults, with 34 percent of individuals aged 18 through 25 having a mental illness in 2021‑2022 and less than two‑thirds of young adults with mental illness receiving services in 2022.
Behavioral Health Infrastructure in California
Behavioral Health Facility Types
Individuals Receive Treatment in Many Facility Types Across Behavioral Health Continuum. As an individual’s behavioral health needs change, the level of service they receive and setting in which they receive care also ideally change. In order to provide individuals appropriate care, the behavioral health system must offer a wide range of services in a variety of settings, commonly referred to as a continuum of care. Ideally, behavioral health services would be provided in the right settings and offered in sufficient supply to allow for individuals to move through this continuum as their needs change. Otherwise, individuals may receive care at a higher or lower level of acuity than they need. One of the Department of Health Care Services’ (DHCS’) goals for the behavioral health system in California is for services to be provided in the least restrictive setting that is appropriate for the care and supports needed by the individual.
Californians Receive Behavioral Health Services in a Variety of Settings. In January 2022, DHCS released a report titled, “Assessing the Continuum of Care for Behavioral Health Services in California.” The report examines the statewide capacity to provide behavioral health services across the full spectrum of behavioral health care. Based on data from SAMHSA, DHCS estimated that over 600 facilities provide outpatient mental health services and nearly 800 facilities provide SUD services. DHCS also estimated that over 100 facilities provided inpatient care. Behavioral health facilities are operated by various entity types, including public, private nonprofit, and private for‑profit entities. The nearby box details the types of services provided in the behavioral health facilities that are of particular relevance to this report.
Background on Selected Behavioral Health Facilities
The Behavioral Health Continuum Infrastructure Program has provided grants to build over 20 different types of behavioral health facilities. Here we provide background information on the facility types that represent the bulk of added capacity.
Inpatient Mental Health Facilities. Individuals who need intensive mental health services to treat serious mental health challenges receive treatment in a variety of inpatient mental health facility types. These facilities range in terms of the needs of the individuals they serve. We use the same classification system as the RAND Corporation, due to our reliance on their work in estimating regional shortfalls in inpatient mental health facility capacity.
- Acute care facilities provide relatively short‑term care to those with the highest needs. Acute care facilities include acute psychiatric hospitals, psychiatric health facilities, and general acute care hospitals with psychiatric wards.
- Subacute care facilities provide somewhat lower‑acuity care, typically for a matter of months, and principally include mental health rehabilitation centers.
- Community residential facilities, such as social rehabilitation facilities, provide lower‑acuity care, often for multiple years, that is focused on recovery and transitioning individuals back to the community.
Crisis Stabilization Units. These facilities provide nonhospital‑level care that offers consistent monitoring and support for up to 23 hours to individuals experiencing a mental health crisis.
Residential Substance Use Disorder (SUD) Treatment. Residential SUD facilities offer clinically managed SUD care in 24‑hour supportive living settings.
Medication Assisted Treatment Facilities. Some medications, including buprenorphine, can be prescribed by a wide range of practitioners and used to treat opioid use disorder with relatively little supervision in either a home or outpatient setting. Other forms of medication, however, including methadone, require greater supervision and are typically administered in a facility.
Sobering Centers. These facilities provide a safe place where individuals can wait for the effects of drugs and/or alcohol to wear off while being monitored for medical issues. Sobering centers can provide opportunities for handoffs to SUD treatment. Recent data from the Department of Health Care Services indicate sobering centers are uncommon, with statewide capacity estimated in 2022 to be for 168 individuals.
Relatively Low‑Intensity Outpatient Facilities. Relatively low‑intensity mental health and SUD services are provided in a variety of facility types. Examples of these facilities include community wellness centers and community mental health clinics.
Shortage of Behavioral Health Facilities
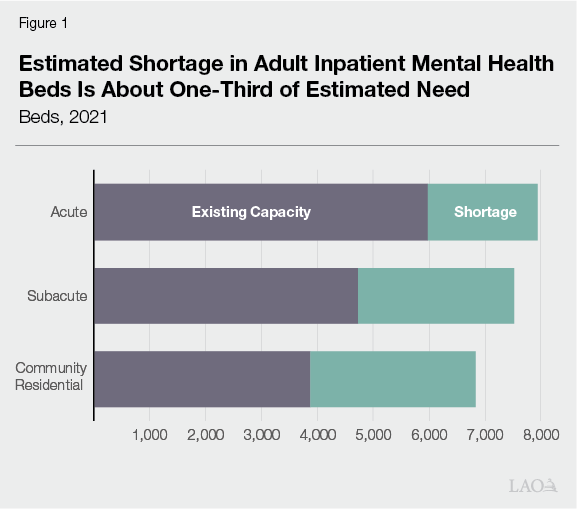
Recent Study Assessed Statewide Need for Adult Inpatient Mental Health Beds. A 2022 study released by the RAND Corporation assessed the state of adult inpatient mental health beds in California. (The researchers did not estimate the statewide need for beds for children and adolescents due to differences in the care needs for this population.) The study was funded by the California Mental Health Services Authority, a county‑level joint powers authority, to assess both the capacity and unmet needs of this key component of the public behavioral health system. Generally, the researchers used state licensure data to estimate the capacity (as of 2021) of adult beds in the state. RAND used three approaches for estimating the shortage of beds: (1) surveying psychiatric facilities to gather data on bed occupancy, wait list volume, and other information; (2) convening an expert panel to estimate bed need based on available research; and (3) assessing national and state survey data concerning the prevalence of SMI to determine the regional variation in the need for beds. The study classifies psychiatric beds in three categories: acute (individuals with the highest level of needs, typically served for days to weeks), subacute (moderate to high level of needs for multiple months), and community residential (lower level of need for up to multiple years).
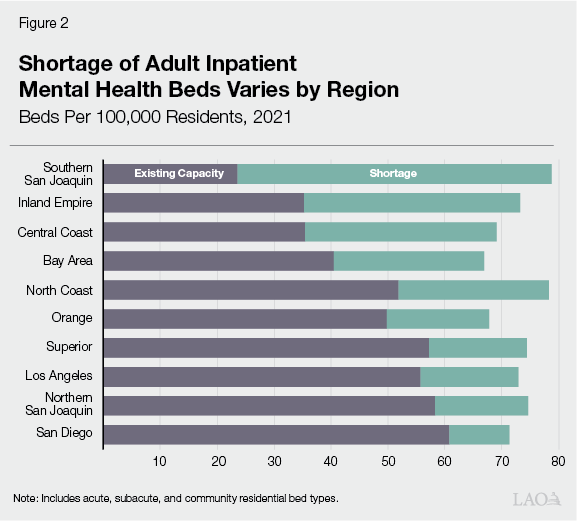
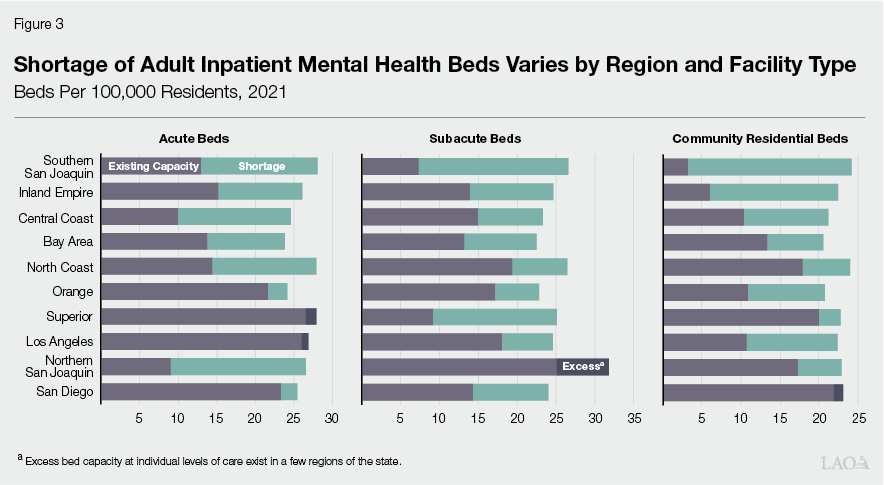
Study Found Significant Shortage of Adult Inpatient Beds. The RAND researchers estimated that the shortage of adult beds totals about 2,000 beds at the acute level, 2,800 beds at the subacute level, and about 3,000 beds at the community residential level. As shown in Figure 1, particularly severe at the community residential level. RAND estimated that the shortage varied substantially by region, as illustrated in Figure 2. Across all bed types, the shortage is generally most severe in the southern San Joaquin Valley, Inland Empire, Central Coast, and San Francisco Bay Area. As Figure 3 shows, however, the shortages in these regions vary considerably across acute, subacute, and community residential facilities. In Los Angeles County, the northern San Joaquin Valley, San Diego‑Imperial, and the Superior region (generally, the northern inland counties, including Sacramento County), RAND estimated a shortage in some bed types but excess capacity in others.
Shortages of Other Facility Types: Limited Quantitative Assessments but Evidence of Insufficient Supply. Beyond the RAND work on adult inpatient mental health beds, there are few statewide quantitative assessments of shortages in behavioral health facilities. One key reason seems to be limited data on the existing capacity—in terms of inpatient beds or outpatient slots—in most behavioral health facility types. While the quantitative estimates of shortages of other facility types may be limited, alternative evidence of the need for more behavioral health facilities comes from the survey data described earlier indicating that more Californians need behavioral health services than are receiving them.
Consequences of Behavioral Health Facility Shortages. Insufficient capacity in behavioral health facilities can negatively impact individuals receiving or in need of care, providers, and government agencies. For example, RAND found that the shortage in adult inpatient mental health beds results in occupancy rates that are higher than generally accepted levels, long wait lists, facilities unable to transfer patients to settings of more appropriate levels of care, and excessive patient stays in hospital emergency departments. RAND also noted that insufficient crisis care capacity can result in an overreliance on law enforcement in dealing with individuals experiencing behavioral health crisis, potentially leading to excessive justice involvement. The state has a clear interest in building out behavioral health infrastructure in California to avoid these consequences.
Behavioral Health Continuum Infrastructure Program
Program Overview and Budget
BHCIP a Key Component of Overall State Strategy to Increase Supply of Behavioral Health Services. A major theme of recent state budgets has been to increase the supply of behavioral health services. Strategies to do so have included expanding the behavioral health workforce; adding benefits and increasing rates in Medi‑Cal; and increasing capacity through managed care plans, schools, and in other settings. The box below provides details on these other major recent initiatives. BHCIP is a key component of this overall strategy as it aims to address the significant shortfall of behavioral health infrastructure.
Selected Recent Initiatives Increasing Access to Behavioral Health Services
The Behavioral Health Continuum Infrastructure Program is just one piece of the state’s overall strategy to increase access to behavioral health services. Other initiatives include the programs described below.
Children and Youth Behavioral Health Initiative (CYBHI). The CYBHI is a $3.8 billion multiyear package of augmentations beginning in 2021‑22. CYBHI is increasing access to behavioral health services in the following ways that are of particular relevance to this report:
- Workforce Programs ($740 Million). CYBHI is increasing behavioral health workforce capacity targeted at children and youth ($427 million) and developing a counselor and coach workforce ($278 million).
- Virtual Services Platform ($723 Million). This platform provides behavioral health services to children and youth aged 25 and younger—regardless of payer source—through (1) interactive exercises and games, (2) automated screening and assessment tools, and (3) direct services delivered by peers and coaches.
- Medi‑Cal Dyadic Services Benefit ($510 Million). CYBHI makes dyadic care—a model of care which provides integrated physical and behavioral health screening and services to children and youth and their families—an ongoing covered Medi‑Cal benefit funded at roughly $100 million per year.
- School Behavioral Health Infrastructure Grants ($400 Million). These grants to educational, governmental, and health care entities fund infrastructure and capacity aimed at better coordination of school behavioral health services.
- Grants to Support Evidence‑Based Practices ($380 Million). These grants to plans, providers, and other entities support evidence‑based behavioral health interventions for children and youth.
Provider Rate Augmentations. The managed care organization tax, a tax on health plans that allows California to draw down additional federal funding for Medi‑Cal, is supporting provider rate increases for a variety of services. Proposition 35, which voters passed in November 2024, makes the tax and an associated spending plan permanent in state law. The spending plan includes hundreds of millions of dollars in increases for non‑specialty mental health services and for services provided in certain behavioral health facilities.
Medi‑Cal Mobile Crisis Benefit. Effective January 1, 2023, this benefit provides, for a five‑year period, certain community‑based mobile crisis intervention services to Medi‑Cal members. Spending on this benefit is estimated to be about $250 million in 2024‑25.
Behavioral Health Bridge Housing. From 2022‑23 through 2025‑26, this program provides $1.1 billion in funding to counties and tribes to develop transitional housing with services for individuals experiencing homelessness who also have behavioral health conditions. (This amount reflects a $118 million total funds reduction proposed in the Governor’s 2025‑26 budget.)
Opioid Settlements Fund. As a result of recent national opioid settlement agreements, the state has been receiving funding that can be used for statewide opioid remediation activities. In the first few years, a few hundred million dollars has been allocated from the settlement fund. About one‑third of the funding has gone to the Naloxone Distribution Project, which aims to reduce opioid overdose deaths through the provision of free naloxone. Other activities funded with the settlements include prevention and harm reduction grants and an education and awareness campaign.
Behavioral Health Community‑Based Organized Networks of Equitable Care and Treatment (BH‑CONNECT) Demonstration. In December 2024, the federal government approved the state’s Medicaid waiver request for the BH‑CONNECT demonstration, which expands the number of federally reimbursable Medi‑Cal behavioral health services. The demonstration also authorizes up to $1.9 billion total funds for behavioral health workforce programs to be implemented by Department of Health Care Access and Information (HCAI) over the five‑year demonstration period.
Behavioral Health Services Act (BHSA) Workforce Funding. Proposition 1 (2024) changed how revenue from the BHSA is spent by the state and counties. The BHSA requires that up to 3 percent of annual revenue (up to about $100 million) is spent on statewide behavioral health workforce initiatives administered by HCAI.
BHCIP Created in 2021‑22 Budget. The 2021‑22 budget plan included $2.2 billion (later reduced, as described below) to create BHCIP. (This amount was originally the sum of $1.7 billion General Fund and $530 million in federal funding, but the federal funding was shifted to the General Fund in December 2024, making the General Fund the sole funding source for BHCIP.) The program provides grants to construct, acquire, or rehabilitate facilities in which to provide behavioral health services. BHCIP can be used to fund a variety of facility types to treat individuals with varying levels of behavioral health needs. Eligible entities include counties, tribes, nonprofits, and corporations. DHCS was granted broad authority to implement the program, including discretion to determine how to allocate the funding; however, the budget plan specifically set aside $150 million for mobile crisis infrastructure and $245 million for facilities targeted at children and youth.
Budget Included State Operations Resources for DHCS to Contract With a Third‑Party Administrator (TPA). Of the original $2.2 billion total allocated to BHCIP, about $80 million is expected to be allocated for state administration of the program. In general, justification for this level of administrative funding was based on the large number of eligible entities and complex task of awarding such a significant amount of grant dollars effectively, equitably, and transparently. In addition, DHCS indicated it would need to contract for expertise in implementing real estate acquisition and capital improvement and to provide applicants with technical assistance. As of December 2024, DHCS estimates the state will provide the TPA $72 million (including $61 million from the General Fund and $12 million from federal funds) for administration of the program.
Conditions of Assistance. Trailer bill legislation creating the program detailed several conditions for an applicant to meet in order to receive assistance. These conditions include providing matching funds or real property, supplementing and not supplanting existing funds for facility expansion, certain reporting requirements, and a commitment to operate services in the financed facility for the intended purpose for at least 30 years. Statute, however, also provided DHCS discretion in the extent to which some of these conditions are required in order to receive grant funding. In practice, these conditions of assistance have been applied throughout the program.
2024‑25 Budget Package Reduced Funding by $451 Million. Beginning in 2023‑24, the state was facing General Fund budget shortfalls. As a part of addressing those budget problems, a portion of funding for BHCIP was delayed in 2023‑24. Later, in the 2024‑25 budget, program funding was reduced by $451 million General Fund, leaving $1.8 billion in funding remaining. Figure 4 shows the multiyear expenditure plan for BHCIP as of the Governor’s 2025‑26 budget (after accounting for the reduction).
Figure 4
Behavioral Health Continuum Infrastructure Program: Multiyear Funding Plan
General Fund (In Millions)
|
2021‑22 |
2022‑23 |
2023‑24 |
2024‑25 |
2025‑26 |
2026‑27 |
Totals, 2021‑22 |
|
|
Grants |
— |
$543 |
$73 |
$531 |
$412 |
$117 |
$1,675 |
|
State operations |
$6 |
12 |
15 |
21 |
12 |
13 |
79 |
|
Totals |
$6 |
$555 |
$88 |
$552 |
$423 |
$129 |
$1,754 |
|
Note: Figure reflects administration cash‑basis projections as of the January 2025 Governor’s budget. Does not include $4.4 billion in general obligation |
|||||||
Proposition 1 Bond Infuses Program With Additional $4.4 Billion. In March 2024, voters approved Proposition 1, which made broad changes to the Mental Health Services Act (including renaming the act the Behavioral Health Services Act). Proposition 1 also authorizes the state to sell $4.4 billion in general obligations bonds for BHCIP, bringing total funding for the program to over $6 billion. Of this amount, at least $1.5 billion is set aside for local governments, including $30 million for tribes. The grant application process is currently underway for the first $3.3 billion of this funding, with awards expected to be announced in May 2025. DHCS is prioritizing regional models or collaborative partnerships, as well as campus models that site multiple levels of care in the same location, with the first round of Proposition 1 bond dollars. Because the bond funding has not yet been awarded, our assessment covers the $1.8 billion in funding allocated prior to the bond’s approval.
BHCIP Implementation
BHCIP Funds Awarded in Five Rounds. As shown in Figure 5, DHCS awarded BHCIP grants in five rounds in 2022 and 2023. The focus of Round 1 was expanding mobile behavioral health services, mostly in the form of mobile crisis teams. Round 2 supported county and tribal planning efforts. Specifically, awardees used funding to engage with the community, counties, and providers in producing an action plan with goals, objectives, and strategies for building behavioral health infrastructure. Round 3, for launch‑ready projects, was initially funded with federal funds from the American Rescue Plan Act of 2021. As such, the projects funded in this round were required to comply with certain federal reporting and other requirements. (Importantly, projects funded in Round 3 had to have all funds obligated by June 2024 and liquidated by December 2026 to meet federal spending time lines.) The focus of Round 4 was children and youth ages 25 and younger, including pregnant and postpartum individuals and their children, and transition‑age youth, along with their families. Round 5 included a wide variety of eligible facility types, but was focused on crisis care. According to DHCS, BHCIP has been oversubscribed, with $2 billion in applications for $519 million available in Round 3, $1 billion in applications for $481 million available in Round 4, and $2 billion for $430 million available in Round 5. BHCIP‑funded facilities began to open in spring 2024. New groundbreakings have continued to occur through at least fall 2024. Figure 6 shows the administration’s stated priorities for BHCIP that were included in grant documents for Rounds 3 through 5.
Figure 5
BHCIP Awards Made in Five Funding Rounds
(In Millions)
|
Round 1: Mobile Crisis Servicesa |
$206 |
|
Round 2: County and Tribal Planning |
7 |
|
Round 3: Launch Ready |
522 |
|
Round 4: Children and Youth |
471 |
|
Round 5: Crisis and Behavioral Health Continuum |
445 |
|
Totalb |
$1,651 |
|
aIncludes $56 million in federal grant funding that was in addition to state funding. bExcludes $30 million that was to be distributed in a planned sixth round. Excludes |
|
|
BHCIP = Behavioral Health Continuum Infrastructure Program. |
|
Figure 6
Administration Priorities for BHCIP
|
|
|
|
|
|
|
|
|
BHCIP = Behavioral Health Continuum Instrastructure Program. |
Notable Implementation Details. Rounds 3 through 5 of BHCIP awarded the bulk of grant dollars and funded a wide variety of behavioral health facility types. We refer to these rounds as the three main infrastructure rounds. The grant administration approach for these rounds was broadly similar. Key grant features include:
- Regional Funding Approach. BHCIP is a competitive grant program. To “ensure the equitable and fair distribution of funds,” BHCIP employs a regional funding approach that designates portions of overall funding for seven regions of the state. Applicants within each of these regions compete amongst themselves rather than competing statewide. Seventy‑five percent of funding in the main infrastructure rounds was set aside in this manner, with another 5 percent designated for tribal entities. The remaining 20 percent was available on a statewide basis for DHCS to award to projects at its discretion. Amounts set aside for the seven regions were based on the methodology used to allocate 2011 realignment funding.
- Matching Requirements. BHCIP awardees are required to match state dollars, with the amount of match varying depending upon the entity type. Specifically, applicants provide matching funds as follows: 5 percent for tribal entities; 10 percent for cities, counties, and nonprofits; and 25 percent for for‑profit providers and/or private organizations. A wide variety of state and local funding sources can be used for the match, with the notable exception of state General Fund and realignment funding. The match also can also be met in the form of land or existing structures.
- 30‑Year Commitment to Operate Facilities. State statute that established BHCIP requires awardees to commit to operate funded facilities for at least 30 years.
- Letters of Support. Applicants are required to submit letters of support with their applications that vary depending upon the entity type. For example, city, nonprofit, and private applicants are required to include a letter of support from their county behavioral health agency. These letters of support are one factor used by DHCS in making award decisions.
- Scoring Preferences for Project Readiness. Generally, as proposed projects are closer to being shovel ready, they are scored higher.
BHCIP: Outcomes, LAO Assessment, and Opportunities for Legislative Oversight
In this section, we provide our assessment of BHCIP awards made in 2022 and 2023. We examine outcomes from the $1.8 billion awarded so far, and what those outcomes indicate about the extent to which BHCIP is building the most needed behavioral health infrastructure in the places where shortages are most acute. To the extent that our assessment suggests that opportunities exist for improving the program, we highlight those issues and offer suggested questions for legislative oversight.
What New Capacity Has Been Created Across Facility Types?
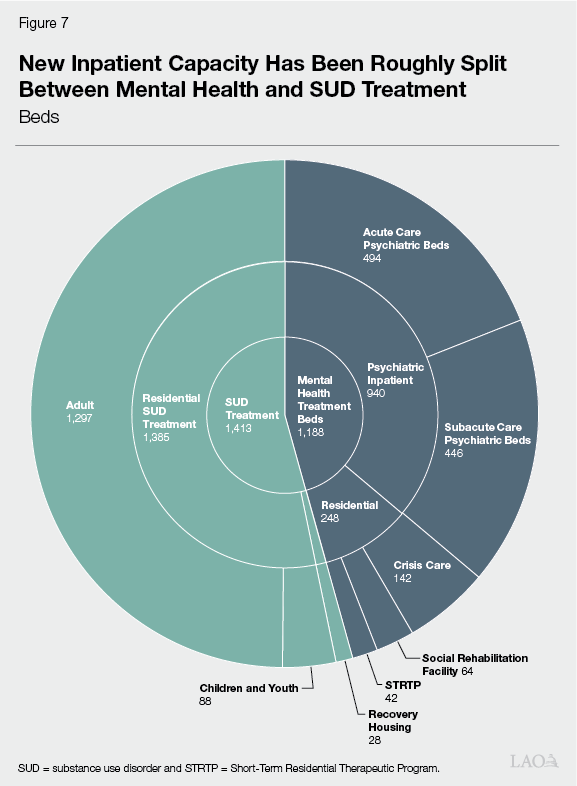
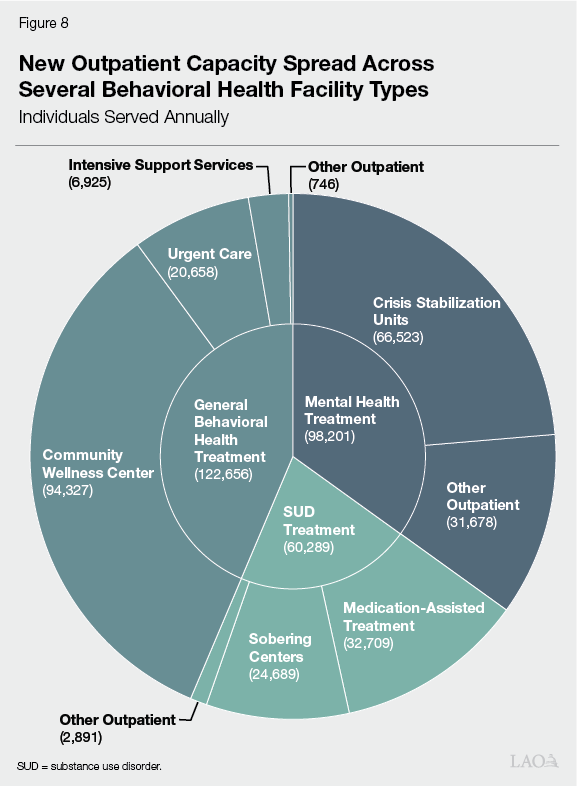
BHCIP Has Supported Mostly Inpatient Facilities Thus Far. Figures 7 and 8 show how BHCIP has been used to build new inpatient capacity (measured in beds) and outpatient capacity (measured by DHCS in individuals served annually), respectively. DHCS indicates that a majority of the $1.4 billion in awards made in the three main infrastructure rounds has been provided to the inpatient facility types in Figure 7. As the figures show, the types of facilities funded by BHCIP have been fairly evenly split across SUD and mental health services, consistent with broad need in the state. (The services provided in behavioral health facilities do not always fit neatly within the categories of mental health and SUD treatment, however. For example, acute psychiatric hospitals, which principally provide mental health treatment, can provide services to individuals with only a severe SUD under certain circumstances. Thus, the figures are meant to provide the reader with a general sense of the services provided in these facilities and should be treated as illustrative.)
Challenging to Assess Allocation of Awards by Facility Type. While survey data on the supply and demand for behavioral health services indicate a clear need for both mental health and SUD facilities, limited data on capacity poses challenges for assessing whether the mix of facilities being built by BHCIP—both by service type and level of acuity—reflect the highest needs. The Legislature may want to ask the administration for its rationale for the mix of facility types funded by BHCIP awards.
Suggested Questions for Legislative Oversight:
- Does DHCS anticipate any shift in the facility types prioritized for awards using Proposition 1 as opposed to the earlier rounds of BHCIP?
- Can DHCS indicate how BHCIP dollars have been allocated by facility type?
- Given the challenges in assessing whether the mix of facilities funded by BHCIP is reflective of the highest needs, do community members and/or providers have feedback for legislative consideration on the distribution of facilities being built by the program? In their view, should there be more (or less) focus on any of these facility categories or types?
What Has Been the Population of Focus of the Funding Awards?
BHCIP Projects Mostly Focused on Medi‑Cal Population. Figure 9 shows the share of grant dollars awarded in the three main infrastructure rounds by the concentration of Medi‑Cal enrollees projected to be served by the projects. As shown in the figure, over half of the $1.4 billion in total funding has been awarded to projects estimated to serve at least 80 percent Medi‑Cal enrollees. About three‑quarters of awards have been for projects serving a higher concentration of Medi‑Cal enrollees than the statewide average (40 percent).
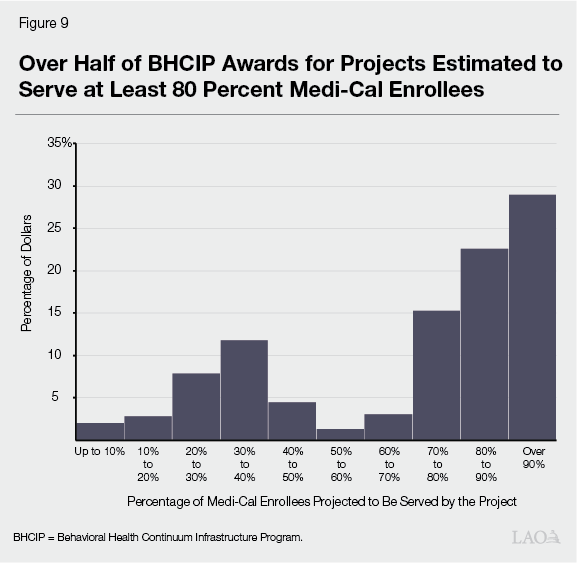
Focus on Medi‑Cal Population Reasonable. Given the state’s direct responsibility for the Medi‑Cal program, it makes sense that the state would prioritize this population over others that are the responsibility of either the federal government (Medicare) or the private sector. Prioritizing Medi‑Cal enrollees in this way also targets resources to Medi‑Cal enrollees who are disproportionately affected by SMI and SUD.
Suggested Questions for Legislative Oversight:
- About 5 percent of program dollars have gone to projects estimated to serve less than 20 percent Medi‑Cal enrollees. While a small share of BHCIP dollars, in general, what does DHCS see as the benefit to the state from funding projects with such low concentrations of Medi‑Cal enrollees?
How Has Funding Been Distributed Across Types of Awardees?
Distribution of Funding by Entity Type. Figure 10 shows the distribution of $1.4 billion in BHCIP funding allocated in the three main infrastructure rounds by entity type. As shown in the figure, we estimate that just over half of this funding has flowed to counties, with the remainder going to all other eligible entities. (The BHCIP grant data to which we have access does not include information on the tax status of private providers and does not specifically identify cities and tribes, so we are unable to provide a further breakdown of funding by entity type.)
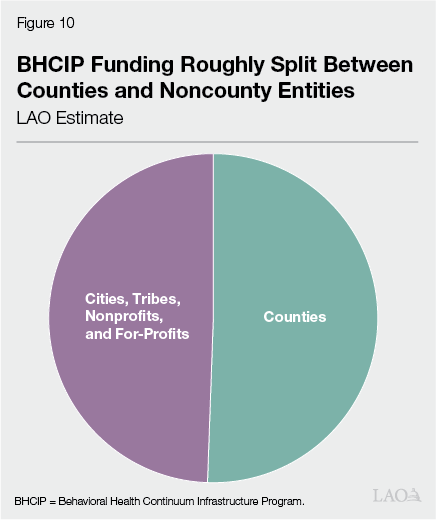
Challenging to Assess Distribution of Awards by Entity Type. Given that counties in California are responsible for providing behavioral health services to Medi‑Cal enrollees with the highest needs, it is reasonable to expect they would receive a substantial share of BHCIP awards. Because counties contract for the provision of these services to some degree, and because some of the BHCIP awards are for facilities providing relatively low‑acuity services, it is also reasonable to expect noncounty entities to receive a significant share of BHCIP awards. It is difficult to say, however, whether the split shown in Figure 10 is the “right” split. The Legislature may want to ask counties, providers, and other advocates for their perspectives on the allocation of BHCIP awards.
Suggested Questions for Legislative Oversight:
- Has BHCIP struck the right balance between awards for counties and awards for noncounty entities?
- How much BHCIP funding has been allocated to for‑profit entities?
What Has Been the Process to Identify Local Needs?
Letters of Support May Not Be a Well‑Functioning Process for Identifying Highest Local Needs. As described earlier, there are statewide quantitative needs assessments for a few facility types. For some other facilities, we have data on the number of facilities in counties, but not the actual capacity of those facilities (that is, inpatient beds or outpatient slots). For remaining facility types, there are limited to no capacity data. To help guide award decisions in the absence of information on capacity, applicants are required to submit letters of support. Noncounty entities are required to submit a letter of support from their county behavioral health agency. While the exact details and requirements have changed over Rounds 3 through 5, in general, these letters seem to be meant to demonstrate that proposed projects are high priorities in local communities. We have identified two main problems with these letters of support.
- The competitive nature of BHCIP seems to limit the value of the letters. Generally speaking, projects within a given region are competing against one another for awards. These include both county and noncounty projects. This means that noncounty projects require letters of support from the county behavioral health departments that are also vying for limited BCHIP dollars themselves. This creates a conflict of interest that conceivably could be preventing some high‑priority projects from receiving funding.
- At the same time, in our conversations with individuals in the behavioral health community, we have also heard of some counties providing letters of support for any project that seeks one in order to maximize regional funding flowing to projects within that county. This would also dilute the value of the letters in identifying projects that are the highest local needs.
For these reasons, the letters of support process in and of itself may not to be a well‑functioning system for identifying local needs. DHCS also indicates that other factors—including feedback from oversight agencies, community engagement, and the description of needs in the grant applications—are also used to gauge need.
Suggested Questions for Legislative Oversight:
- Has DHCS considered improvements to the letters of support process that could help address problems of conflict of interest and improve identification of projects of highest need?
- Should a more thorough needs assessment be conducted to inform awards made in the second planned round of bond funding?
- Is DHCS considering any modifications to BHCIP to improve its ability to fund projects of highest local need?
What Has Been Progress in Addressing Identified Shortage in Adult Inpatient Mental Health Beds?
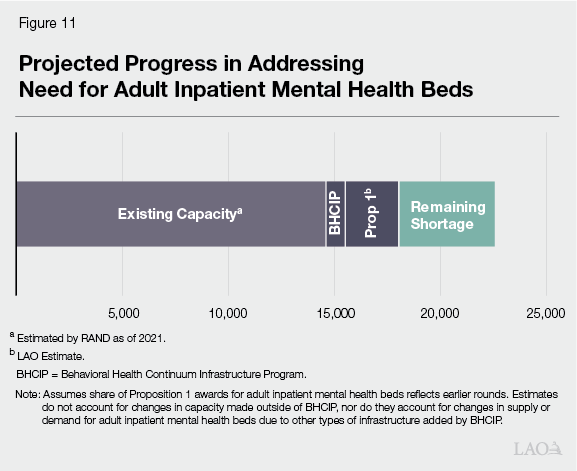
BCHIP Has Addressed Roughly 10 Percent of Estimated Shortage of Adult Inpatient Mental Health Beds. In 2022, RAND estimated that the baseline level of adult inpatient mental health beds statewide in 2021 was about 14,600 (excluding capacity in state hospitals). RAND also estimated that the statewide shortfall in beds was nearly 8,000—equal to more than half of current capacity. In 2022 and 2023, we estimate that BHCIP made awards for about 800 adult inpatient mental health beds, or just over 10 percent of the estimated shortfall.
A Change in Focus or Additional Funding Is Apparently Needed if State Is to Meet Estimated Need for Adult Inpatient Mental Health Beds. Proposition 1 infuses the program with $4.4 billion—or about three times the funding that has been provided through the three main infrastructure rounds. As shown in Figure 11, if BHCIP awards made with the bond funds prioritize adult inpatient mental health beds to the same extent as in the three main infrastructure rounds, the program will ultimately only address less than half of the remaining shortfall in adult inpatient mental health beds. (This does not account for the possibility that new capacity in other parts of the behavioral health system is potentially reducing the need for adult inpatient mental health beds to some degree, nor does it account for changes in adult inpatient mental health bed capacity occurring outside of BHCIP.)
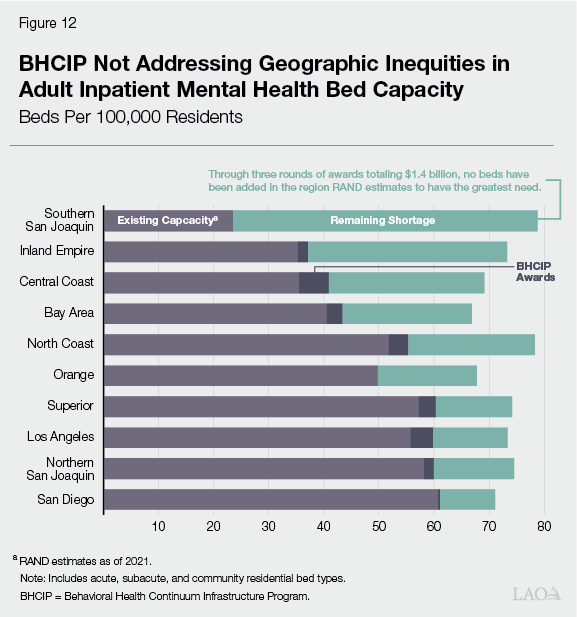
BHCIP Does Not Appear to Be Addressing Regional Inequities in Adult Inpatient Mental Health Bed Capacity. Figure 12 shows progress made in filling shortfalls in adult inpatient mental health beds by region. As shown in the figure, inpatient bed capacity has been added in most regions of the state. Notably, however, no adult beds have been added in the region estimated by RAND to have the greatest need for adult beds—the southern San Joaquin Valley region (including Fresno, Inyo, Kern, Kings, and Tulare Counties). (We are aware of at least two projects funded outside of BHCIP that are expected to bring a small increase in beds to this region.) Moreover, 55 percent of the beds built have been in the four regions of the state estimated by RAND to have the least need—including San Diego, Los Angeles, the northern San Joaquin Valley, and Superior. This indicates that the program so far has not been successful in addressing geographic inequities in adult inpatient mental health bed capacity.
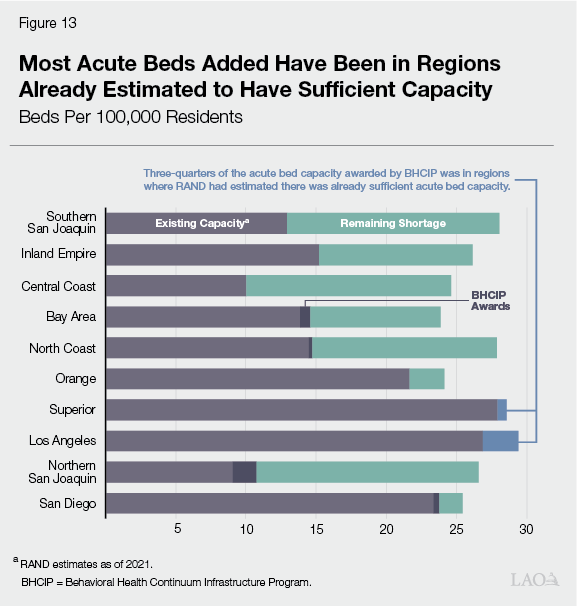
A Closer Look at Awards for Acute Beds Raises Questions About Whether Award Decisions Are Consistent With Program Goals. Figure 13 shows acute adult inpatient mental health bed capacity added by the three main infrastructure rounds. The acute level provides the highest‑acuity inpatient care and includes acute psychiatric hospitals, psychiatric health facilities, and general acute care hospitals with psychiatric wards. As the figure shows, about three‑quarters of the acute bed capacity added by BHCIP have been in regions of the state where RAND estimated there was already sufficient acute bed capacity. We estimate these beds represent roughly $130 million, or nearly 10 percent, of awards made in the three main infrastructure rounds. It is not the case that these beds will go unused, at least not in the near term. In both regions, RAND estimated shortages at the subacute and community residential levels, so these beds can alleviate pressures in other parts of the behavioral health system. That said, building excess capacity at the highest level of care seems inconsistent with DHCS’ stated program goal of providing care in the least restrictive setting that is appropriate for the care and supports needed by the individual.
Suggested Questions for Legislative Oversight:
- Will DHCS use a greater share of the Proposition 1 bond dollars for inpatient mental health beds than it has in prior rounds in order to get closer to fully addressing the shortage of these beds?
- Given that we have a rigorous assessment of unmet need for this part of the behavioral health system, why not set aside a specific amount of the Proposition 1 bond for building inpatient mental health beds and allocate funding to regions according to their identified relative shortfalls?
- What is DHCS doing to ensure that future awards address geographic inequities in adult inpatient mental health beds?
- What is DHCS doing to work with applicants in the southern San Joaquin Valley region to ensure that future awards are used to build adult inpatient mental health beds in that region?
- How is the siting of acute care facilities in excess of estimated need consistent with the goal of treating individuals in the least restrictive setting possible?
- Given the time that has passed and the several other behavioral health initiatives that indirectly affect the shortage of adult inpatient mental health beds, should an updated version of the RAND report be conducted in order to inform the allocation of the final $1.1 billion of Proposition 1 bond dollars?
Does Regional Funding Model Target Highest Needs?
Awards Could Be Better Aligned With Needs. The box below describes the methodology we use to assess the extent to which BHCIP awards for most facility types reflect relative regional need. We assessed awards across several different facility types in each of ten regions. Our assessment indicates that some regions have consistently received fewer awards than we expected them to receive based on our assessment methodology while other regions have consistently received more awards than expected. Specifically, the San Diego region—consisting of San Diego County and Imperial County—received fewer awards than expected across all facility types. Similarly, the Inland Empire—consisting of San Bernardino County and Riverside County—also received fewer awards for all but two facility types. On the other hand, Los Angeles County received more awards than expected in all but one facility type. Outside of these regions, the story is more mixed, with regions generally receiving more awards than expected in some facility types and fewer awards than expected in others.
LAO Assessment Approach
LAO Assessment Approach for Most Facility Types. In the cases where quantitative assessments of the shortage of behavioral health facilities do not exist, we developed an approach for assessing the reasonableness of Behavioral Health Continuum Infrastructure Program (BHCIP) awards. Specifically, we developed regional estimates of expected awards and compared these expected awards with actual award decisions. Our approach uses incidence of behavioral health conditions in the Medi‑Cal population, opioid overdose deaths, and the county’s share of the statewide Medi‑Cal population. For example, in assessing awards for medication‑assisted treatment facilities, we used rates of substance use disorder (SUD) in the Medi‑Cal population and overdose death rates. In the case of mental health clinics and other low‑acuity facilities focused on mental health we used rates of serious mental illness (SMI) in the Medi‑Cal population. These rates serve as a proxy of the relative need for behavioral health services—that is, a region with higher rates of SMI and SUD and higher overdose death rates could be expected to have a greater need for behavioral health infrastructure than a region with lower rates. This proxy is given a weight of 75 percent. We use the county’s share of the statewide Medi‑Cal population for the other 25 percent, reflecting the importance of fulfilling the state’s responsibility to provide access to behavioral health services to Medi‑Cal enrollees.
Illustration of How Assessment Works. To illustrate how this approach works, our assessment methodology suggests that Los Angeles (LA) County should have received between about 20 percent and 25 percent of statewide awards for medication‑assisted treatment facilities. This is based on rates of SUD in the Medi‑Cal population in LA County, rates of opioid overdose deaths in LA County, and the county’s share of the statewide Medi‑Cal population. BHCIP awarded LA County 27 percent of statewide awards for medication‑assisted treatment facilities, suggesting that in this particular case, BHCIP awards were broadly reasonable.
Regional Funding Approach Appears to be Driving Force. As described earlier, DHCS’ approach for allocating funds in the three main infrastructure rounds of BHCIP was to set aside 75 percent of total funding for seven specified regions and require that counties within those regions compete for the set aside amounts. After accounting for 5 percent designated for tribal entities, DHCS reserved the remaining 20 percent to be awarded on a discretionary statewide basis. The regional set asides were based on the methodology used to allocate realignment funding to counties from the Behavioral Health Subaccount. Figure 14 shows these regional set asides, both in total and on a per capita basis, for the three main infrastructure rounds of BHCIP combined. (The county groupings used by DHCS in determining these regional set asides differ from the groupings we use in our report that are based on the RAND groupings.) As the figure shows, Los Angeles County received the most funding on a per capita basis, and more than twice the per capita funding set aside for Southern California—consisting in of Imperial, Orange, Riverside, San Bernardino, San Diego, and Ventura Counties. This generally mirrors our assessment findings that Los Angeles County received more than their expected awards and that the San Diego and Inland Empire regions generally received less than their expected awards.
Figure 14
Regional Set Asides Vary Widely on a Per Capita Basis
(In Dollars)
|
Total Set Asidesa |
Set Asides |
|
|
Los Angeles |
$393,734,636 |
$3,931,509 |
|
Balance of State |
48,326,634 |
3,864,690 |
|
San Joaquin Valley |
127,084,123 |
2,949,166 |
|
Bay Area |
228,512,223 |
2,948,630 |
|
Central Coast |
42,538,558 |
2,824,671 |
|
Sacramento |
67,186,504 |
2,599,257 |
|
Southern California |
216,657,322 |
1,786,617 |
|
Statewide |
$1,124,040,000 |
$2,842,668 |
|
aAmounts shown are total for Rounds 3 through 5 of Behavioral Health Continuum |
||
Regional Set Aside Methodology Potentially Reinforces Inequities in Behavioral Health Infrastructure. The methodology used to set the allocations for the Behavioral Health Subaccount base is mostly based on claims for behavioral health services, with a smaller share based on Medi‑Cal enrollment. Using this methodology for establishing regional set asides in BHCIP seems problematic because historical service claims are not a direct measure of behavioral health infrastructure need. Moreover, basing regional set asides mostly on historical service claims could actually be counterproductive in addressing geographic inequities in behavioral health infrastructure. This is because, to the extent there have been historical relative differences in access to behavioral health services due in part to relative differences in infrastructure capacity, the regional set aside methodology may work to reinforce these historical inequities. This means that the regional set aside methodology may be hamstringing the program in meeting its goals of improving geographic equity. Ideally, funding would be allocated based on identified relative need for behavioral health infrastructure, or proxy measures of that need, such as rates of SMI and SUD. The $1.5 billion portion of BHCIP bond funding that is designated for local governments and tribes is not being administered with these regional set asides, which seems to us to be an improvement in program administration; however, DHCS continues to use the regional set asides in allocating most of the Proposition 1 bond dollars.
Suggested Questions for Legislative Oversight:
- Why are regional set asides necessary for administration of BHCIP grants?
- Why did DHCS decide to not apply regional set asides to the $1.5 billion of bond funding designated for local governments and tribes?
- Should DHCS consider an alternative methodology for determining regional set asides in order to better target funds to areas with greatest local needs.
How Well Is BHCIP Working for Small Counties?
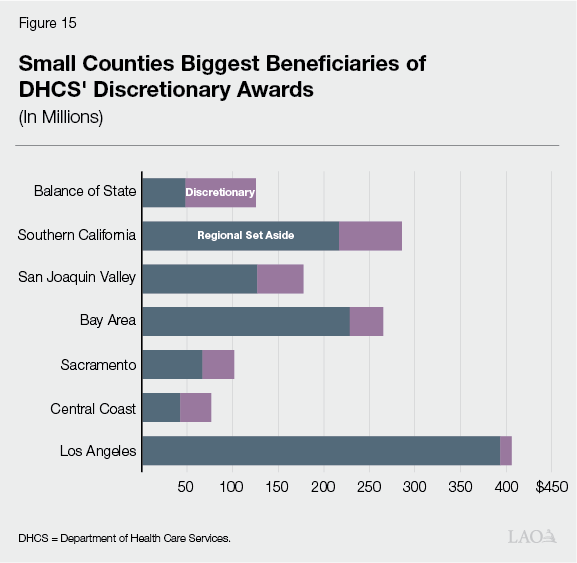
Small Counties Biggest Beneficiaries of DHCS’ Discretionary Grant Allocations. As described earlier, 20 percent of funding in the three main infrastructure rounds was allocated on a statewide basis at the discretion of DHCS. Figure 15 shows amounts awarded by DHCS region via set asides and at the discretion of DHCS. As shown in the figure, DHCS made discretionary allocations in all regions of the state. But the Balance of State region, encompassing 23 small counties outside of the other regions, received one‑quarter of DHCS discretionary grant funds, the largest of any DHCS region. On a per capita basis, awards to projects in these small counties were about twice as much as in any other region. More than half of awards to projects in small counties in these rounds came via DHCS discretionary allocations. This suggests that projects in these small counties were a priority for DHCS in BHCIP.
A Closer Look at Awards in Small Counties Tells a More Mixed Story. Figure 16 shows awards made for projects in the 30 counties with populations under 200,000 as of January 1, 2022. (We chose this threshold because it is the same used in Proposition 1.) While on a per capita basis, there has been a relatively large allocation of BHCIP awards to projects in small counties, the awards have been concentrated in 11 of these counties, with no awards being made in the other 19 small counties through the three main infrastructure rounds. These 19 counties are mostly located in the northern inland and central parts of the state. (Twenty‑seven of these 30 small counties received $41 million collectively in Round 1 of BHCIP focused on mobile crisis teams. In addition, no projects were awarded in the three main infrastructure rounds in one large county, Fresno County, with a population of around 1 million.)
Figure 16
About Two‑Thirds of Small Counties
Left Out of BHCIP’s Three Main
Infrastructure Rounds
|
County |
Awards |
Per 10,000 Residents |
|
Glenn |
$17,278,529 |
$6,004,284 |
|
Calaveras |
25,929,361 |
5,759,393 |
|
Tuolumne |
13,940,073 |
2,557,812 |
|
Humboldt |
30,209,240 |
2,251,615 |
|
Mendocino |
17,079,947 |
1,892,997 |
|
Imperial |
29,498,033 |
1,635,200 |
|
Madera |
24,989,161 |
1,591,261 |
|
El Dorado |
14,027,556 |
741,046 |
|
Nevada |
6,149,363 |
608,366 |
|
Napa |
8,085,736 |
596,452 |
|
Lake |
2,000,000 |
295,871 |
|
Alpine |
— |
— |
|
Amador |
— |
— |
|
Del Norte |
— |
— |
|
Inyo |
— |
— |
|
Kings |
— |
— |
|
Lassen |
— |
— |
|
Mariposa |
— |
— |
|
Modoc |
— |
— |
|
Mono |
— |
— |
|
Plumas |
— |
— |
|
San Benito |
— |
— |
|
Shasta |
— |
— |
|
Sierra |
— |
— |
|
Siskiyou |
— |
— |
|
Sutter |
— |
— |
|
Tehama |
— |
— |
|
Trinity |
— |
— |
|
Yuba |
— |
— |
|
Total |
$189,186,999 |
|
|
BHCIP = Behavioral Health Continuum Infrastructure Program. |
||
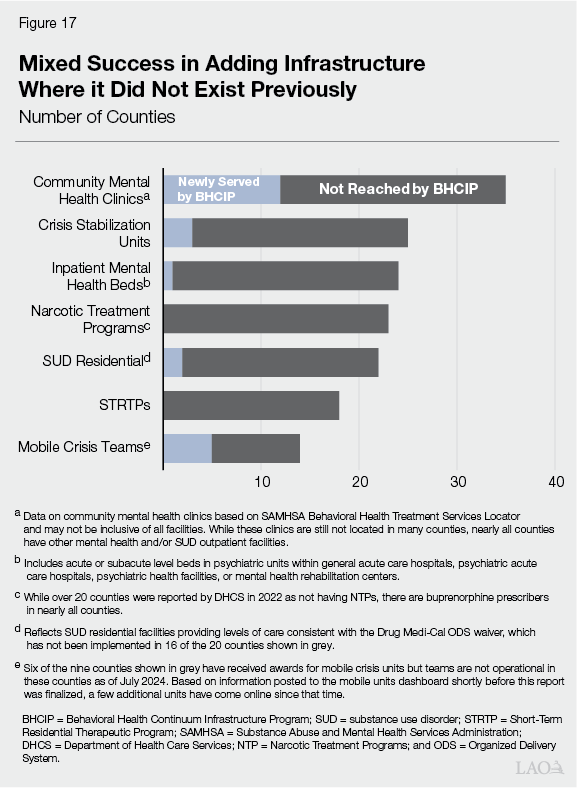
Mixed Success in Adding Infrastructure Where It Did Not Exist Previously. Figure 17 shows counties that were estimated by DHCS in 2022 to not have any of the behavioral health facility types shown in the figure. (DHCS indicated that the data used in the figure may not have been inclusive of all facilities in the state.) While the figure is not limited to small counties, counties lacking these facility types tend to be small counties. As shown by the figure, BHCIP awards made in 2022 and 2023 have resulted in mixed progress in adding infrastructure of a facility type where it did not exist previously. All of the facility types shown in the figure either existed in at least one small county previously or were a part of a BHCIP award for a small county. Siting facilities of a particular type in all counties may not be reasonable or even feasible. Still, the chart provides further indication of BHCIP’s limited impact in some small counties. (Mobile crisis teams have been funded by BHCIP in more counties than are shown in the figure. As of October 2024, however, 7 of 53 mobile crisis grantees are not providing services due to workforce/hiring challenges, and these teams are not reflected in the figure. DHCS indicates that they are working closely with these grantees to support them in getting services online.)
Suggested Questions for Legislative Oversight:
- What issues are preventing more small counties from benefitting from BHCIP?
- What is DHCS doing to address any barriers keeping small counties from benefitting from BHCIP?
- With 19 small counties and one larger county not receiving awards in the three main infrastructure rounds, should a different funding approach for a portion of the $4.4 billion bond be considered in order to ensure that progress is made in building out behavioral health infrastructure in all counties?
Are Potential Barriers Preventing Relatively Small and Disadvantaged Applicants From Benefitting From BHCIP?
Some Program Requirements Seem Challenging, Especially for Small and Relatively Disadvantaged Applicants. Our review of the requests for applications and various applicant guidance documents, along with our conversations with those in the behavioral health community, suggest that some aspects of BHCIP can be challenging for certain applicants. While we do not know how many potential applicants may not have submitted applications or seen their applications funded due to these requirements, we think the trade‑offs we identify below warrant consideration of ways to make the program more accessible to all applicants.
Scoring Preference for Projects Closer to Launch Ready. As described earlier, Round 3 of BHCIP was initially funded with federal COVID‑19 relief dollars that came with strict time lines for the expenditure of funds, requiring liquidation by December 2026. In addition, state budget bill language required funding provided in Rounds 4 and 5 to be liquidated by June 2027. Given these time lines, the focus of Round 3 on launch ready projects and the scoring preferences provided in Rounds 4 and 5 were reasonable. The first round of grants funded with Proposition 1 bond dollars is also being administered with higher scores being provided to projects that are further along in the project development process. Projects receiving a scoring preference must demonstrate ownership of a site, have completed architectural and engineering work, and show the ability to have building permits and start construction within several months of funding. Further scoring preferences are provided to shovel ready projects that are in possession of a site, are at or near completion of construction drawings, have building permits, have selected a contractor, and can start construction within 60 days. While certain sunk costs were made an allowable source of match beginning with Round 4, applicants require a good deal of resources, staff (either in‑house or on a consultant basis), and time to present a relatively competitive project. Relatively small and disadvantaged applicants likely may struggle to compete in this environment, especially with the three main infrastructure rounds having been oversubscribed. While the rising incidence of behavioral health conditions and adverse consequences make a case for urgency, the program’s prioritization of speed in building out the continuum seems at odds with making the program accessible to all potential applicants. Moreover, the emphasis on awarding grant dollars as quickly as possible may be limiting the program’s ability to help build the most complex and hardest to site projects for which BHCIP can have the greatest impact.
30‑Year Commitment to Operate Facilities. State statute establishing BHCIP requires awardees to commit to operate funded facilities for at least 30 years. Again, this requirement is reasonable for a few reasons. For one, the state has a clear interest in ensuring that the facilities being funded by state resources will benefit the behavioral health system for a long time to come. The basis for the 30‑year requirement has arguably been strengthened with regard to the $4.4 billion funded via Proposition 1’s general obligation bond. Given that bonds are typically repaid over a roughly similar time frame, the state would want to ensure there is a similarly long public benefit. Moreover, the 30‑year requirement is required as a part of certain statutory provisions that allow for the expediting of projects.
All this said, requiring awardees to commit to operating facilities for 30 years is a significant commitment given the state’s role in Medi‑Cal financing. As shown in Figure 9, the majority of BHCIP grant dollars have been awarded to projects expected to serve predominantly Medi‑Cal enrollees. Thus, BHCIP‑supported facilities by and large will be fiscally dependent on payments in the Medi‑Cal program. To ensure the long‑term success of the facilities, the state has a vested interest in assessing rate sufficiency over time. To this end, the Legislature could consider a formal process to monitor Medi‑Cal rates for behavioral health services to help ensure rates are sufficient to support these facilities over the long term.
General Administrative Burden. The state is allocating a large amount of resources to building local behavioral health infrastructure, making it reasonable to expect awardees to demonstrate that projects will be successful and that funding is being used appropriately. But anecdotally, those in the behavioral health community with whom we spoke, including county behavioral health directors and providers with direct experience in the program, expressed frustration with the administrative burden of participating in the program. Examples include challenges associated with the submission of information (both during the application process and during project implementation) and the process for receiving reimbursements. In addition, DHCS has indicated that it may impose reporting requirements for up to 30 years after project completion. That said, we spoke with others in the community who offered praise for the support they received from the administration and the TPA in the form of expertise and technical assistance.
Suggested Questions for Legislative Oversight:
- What is the basis for continuing to provide a scoring preference to launch‑ready projects in administering the Proposition 1 bond?
- Does DHCS agree that the prioritization of launch‑ready projects creates barriers for relatively small and disadvantaged applicants?
- Does the prioritization of launch‑ready projects limit BHICP’s ability to build relatively complex and hard‑to‑site projects?
- What approaches would awardees suggest the state undertake to ensure the long‑term financial stability of these facilities?
- What feedback has DHCS heard on the administrative burden of the program? Are there any changes that could be made in the grant application process and program administration to reduce the burden on awardees?
How Is BHCIP Helping Populations of Focus?
Challenging to Assess Program Outcomes. In their 2022 behavioral health continuum assessment report, DHCS identifies three populations of focus—children and youth, justice‑involved individuals, and American Indian/Alaska Native (AI/AN) for whom “disparities and poor health outcomes for people of color are particularly prominent.” For the most part, our ability to analyze BHCIP outcomes specifically for these populations is limited; however, we highlight what information we can and offer suggested questions that can help the Legislature examine the extent to which BHCIP is working for these populations. (These three populations are not the only ones that face unique behavioral health challenges. For example, RAND found that half of psychiatric facilities were unable to place adults with co‑occurring conditions, such as dementia. We focus on these three populations to help gauge the extent BHCIP is addressing challenges for populations of concern previously highlighted by DHCS.)
- Children and Youth. Given the focus of Round 4, $470 million awarded in that round is expected to primarily benefit children and youth. In addition, about $70 million from Rounds 3 and 5 was directed to projects indicating that they will exclusively serve children and youth. (Additional projects are expected to serve both adults and children and youth, but we are unable to assess the extent to which these projects will benefit children and youth specifically due to data limitations.) Geographically speaking, these awards for children and youth were broadly reflective of the distribution of BHCIP dollars overall. Nearly half of the children and youth inpatient capacity built with these amounts was for residential SUD treatment, with another third for acute care psychiatric beds. About two‑thirds of the outpatient capacity for children and youth was for low‑intensity behavioral health facilities, with most of the remainder for crisis stabilization units.
- AI/AN. As described earlier, DHCS’ set aside 5 percent of funding in the three main infrastructure rounds for tribal entities. These set asides totaled nearly $75 million. The grant data to which we have access, however, do not specifically indicate whether an applicant was a tribal entity, so we are limited in our ability to analyze the types of facilities funded with these awards. In addition to the three main infrastructure rounds, 23 tribal grantees received $7.5 million in Round 1 of BHCIP, which was focused on mobile crisis infrastructure. These tribal awards funded vehicles and vehicle‑related costs to provide both crisis and non‑crisis behavioral health services.
- Justice‑Involved Individuals. In general, the BHCIP grant data to which we have access do not identify the extent to which projects will benefit justice‑involved individuals. Grant applications, however, asked applicants to identify how projects target state priorities, including meeting the needs of individuals with justice involvement.
Suggested Questions for Legislative Oversight:
- Can DHCS provide greater detail on the extent to which BHCIP awards in Rounds 3 and 5 are benefitting children and youth?
- Can DHCS provide a breakdown of the types of facilities awarded to tribes funded in Rounds 3 through 5?
- What percentage of grant awards were associated with projects indicating a focus on meeting the needs of individuals with justice involvement?
- What key challenges remain in addressing the needs of these populations of focus and how is DHCS working to address those needs with the Proposition 1 bond?
- Applications required applicants to estimate the racial demographics of those projected to be served by proposed projects. Can DHCS provide the Legislature summary data for projects awarded BHCIP funds?
BHCIP and Behavioral Health Workforce
Challenges in the Behavioral Health Safety Net Workforce. Researchers and government agencies alike have identified shortages in the behavioral health workforce. A February 2023 study conducted by researchers at the University of California, San Francisco’s (UCSF’s) Healthforce Center, commissioned by the County Behavioral Health Directors Association, is particularly instructive, given its focus on challenges in California’s safety net behavioral health system. At a high level, the assessment indicates that the supply of the workforce varies regionally, but is lowest in the Inland Empire and San Joaquin Valley. The UCSF researchers surveyed county behavioral health directors and broadly found that recruiting and retention in the behavioral health safety net workforce is a major challenge. In particular, counties broadly identified challenges recruiting individuals who specialize in treating specific populations, including adolescents and people with criminal justice system involvement. According to the report, a key retention challenge with new graduates is their lack of preparation to provide specialty mental health services. Given the types of facilities being built by BHCIP and the program’s focus on the Medi‑Cal population, the expansion of behavioral health infrastructure will increase demand for safety net behavioral health professionals, thus straining this system further. DHCS indicates that the TPA is providing technical assistance and resources on workforce. In addition, the box previously shown above outlined state efforts to increase the supply of behavioral health workers. Ultimately, the Legislature will want to understand the extent to which these workforce efforts are successful in ensuring that workforce challenges do not limit the success of BHCIP facilities.
Suggested Questions for Legislative Oversight:
- To what degree will the expansion of behavioral health facilities increase the demand for behavioral health workers?
- Are the state’s recent efforts to increase the supply of behavioral health workers sufficient to cover already identified workforce shortages and the additional need resulting from BHCIP projects?
- Will the increased demand for workers place additional strains on the safety net behavioral health workforce?
- What is the administration’s plan for meeting the increased demand for safety net behavioral health workers?
- How are the state’s current behavioral health workforce efforts addressing the unique challenges facing the safety net behavioral health system highlighted in the UCSF report?
Summary of BHCIP Oversight Issues
Our review of the state’s efforts to build behavioral health infrastructure highlights opportunities for improvement with regard to how funding is being allocated and the extent to which the program is meeting Californians’ needs. These issues are summarized in Figure 18. The Legislature has a brief window in which to use our findings and suggested questions for oversight to assess the extent to which program changes are merited for the administration of Proposition 1 bond dollars.
Figure 18
Summary of BHCIP Oversight Issues
|
Types of Behavioral Health Facilities |
|
|
|
|
|
Geographic Inequities |
|
|
|
Regional Funding Model |
|
|
Small and Disadvantaged Applicants |
|
|
|
|
|
|
Awards for Counties vs. Others |
|
|
|
Populations of Focus |
|
|
|
Behavioral Health Workforce |
|
|
|
BHCIP = Behavioral Health Continuum Infrastructure Program; DHCS = California Department of Health Care Services; and AI/AN = American Indian/Alaksa Native. |