
February 13, 2025
The 2025‑26 Budget
Supplemental Security Income/State Supplementary Payment (SSI/SSP) Program
Summary
For 2025-26, the Governor’s budget proposes $3.6 billion from the General Fund for the state’s share of SSI/SSP—a decrease of $5.4 million (0.2 percent) from the Governor’s revised 2024-25 budget estimate. This decrease would bring total program funding to $11.2 billion ($3.6 billion from the General Fund and $7.7 billion federal funds) in 2025-26. The primary driver of this decrease is a decline in the projected caseload. The administration does not include any new SSP-related proposals as part of the Governor’s 2025-26 budget proposal.
Background
The SSI/SSP program provides cash grants to low-income aged, blind, and disabled individuals. Grant levels for SSI/SSP are determined by both the federal government and the state. Specifically, the federal government pays for the SSI portion of the grant while the state pays the SSP portion of the grant.
Federal Government Required to Provide Annual Cost-of-Living (COLA) Adjustment to SSI Grants… The federal government is required to provide an annual COLA each January to the SSI portion of the grant. The federal COLA is based on the Consumer Price Index for Urban Wage Earners and Clerical Workers (CPI-W). In years that the CPI-W is negative (as was the case in 2010, 2011, and 2016), the federal government does not decrease SSI grants, but instead holds them flat.
…While State Has Option to Provide Annual COLA to SSP Grants. The state has full discretion over whether and how to provide increases to the SSP portion of the grant. Until it was ended in 2011, the state had a statutory annual COLA. These COLAs generally reflected whole-grant COLAs. Whole-grant COLAs worked by applying the California Necessity Index (CNI) to the total SSI/SSP grant. If the federal SSI COLA was not enough to increase total SSI/SSP grants to CNI-adjusted levels, then the SSP portion of the grant was increased by the remaining amount. (Despite the state statutory COLA, there were many years prior to 2011 when the COLA was not provided due to budget constraints.) After the Great Recession, SSP grants occasionally were increased by applying the CNI only to the SSP portion of the grant (in 2016-17 and 2021-22). Additionally, while not COLAs, SSP grant increases were provided in 2021-22, 2022-23, and 2023-24. We describe those increases more fully below.
During Great Recession, SSP Grants for Individuals and Couples Were Reduced to Federally Required Minimum. The state is required to maintain SSP monthly grant levels at or above the nominal levels in place in March 1983 ($156.40 for SSP individual grants and $396.20 for SSP couple grants) in order to receive federal Medicaid funding. As shown in Figure 1, during the Great Recession, the state incrementally decreased SSP grants for individuals and couples until they reached these minimum levels in June 2011 and November 2009, respectively.
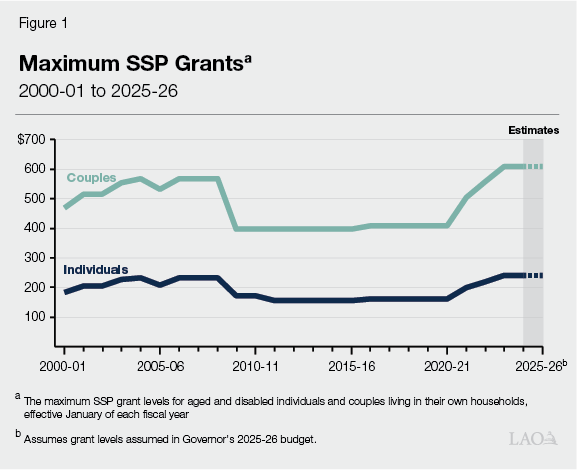
SSP Grants Were Increased in 2016-17, 2021-22, 2022-23, and 2023-24. Since the Great Recession, grants for individuals and couples have been increased four times—in 2016-17 (by 2.76 percent), 2021-22 (by 23.95 percent), 2022-23 (by 10.3 percent), and 2023-24 (by 9.2 percent). The 2021-22, 2022-23, and 2023-24 SSP grant increases were based on specific dollar amounts set in statute. Statute required the Department of Finance to estimate what percentage grant increase could be supported by a half-year cost of $291 million in 2021-22 (estimated to be about $580 million in 2022-23), a half-year cost of $150 million in 2022-23 (estimated to be about $300 million in 2023-24), and a half-year of cost of $146 million in 2023-24 (estimated to be about $292 million in 2024-25). Based on these calculations, SSP grants increased by 23.95 percent on January 1, 2022 (increasing grants by $39 for individuals and $98 for couples); by 10.3 percent on January 1, 2023 (increasing grants by about $21 for individuals and $52 for couples); and by 9.2 percent on January 1, 2024 (increasing grants by about $20 for individuals and $51 for couples).
Governor’s Budget Assumptions
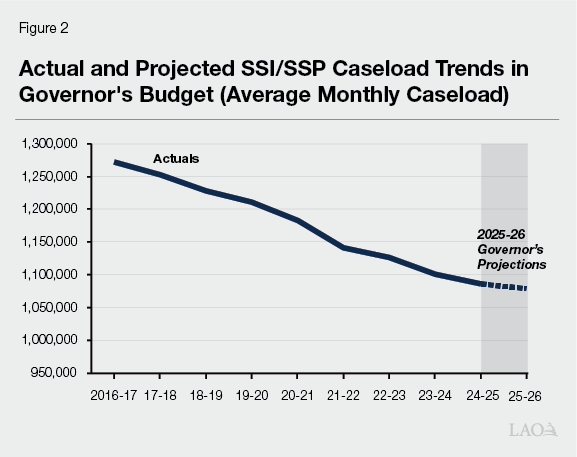
Governor’s January Budget Assumes SSI/SSP Caseload Continues to Decline. The SSI/SSP caseload grew at a rate of less than 1 percent each year between 2011-12 and 2014-15. Beginning in 2015-16, however, SSI/SSP caseload began to decline slowly at an average rate of 1.8 percent each year. As shown in Figure 2, the Governor’s budget projects that caseload will decrease by 1.3 percent in 2024-25 and 0.7 percent in 2025-26. The Department of Social Services (DSS) has recently noted that a potential driver of this steady caseload decline may be attributable to fewer individuals meeting income and asset eligibility thresholds.
Governor’s January Budget Includes Federal SSI COLA Estimates and Holds 2025-26 SSP Grants Unchanged. Figure 3 shows how 2023-24 maximum SSI/SSP grant levels compare to 2024-25 maximum SSI/SSP grant levels and the administration’s estimates of the 2025-26 federal SSI grant increase. The projected increases to maximum SSI/SSP grant levels in 2025-26 are entirely due to the estimated federal SSI COLA. The Governor’s budget estimates that the federal COLA for the SSI portion of the grant will be 2.5 percent in 2025-26, increasing maximum SSI grants by $22 for individuals and $33 for couples in January 1, 2026 (the actual federal SSI COLA will not be known until fall 2025). The Governor’s budget does not propose any change in the maximum SSP grants for 2026.
Figure 3
SSI/SSP Monthly Maximum Grant Levelsa
|
2023‑24 |
2024‑25 |
2025‑26 |
|
|
Maximum Grant—Individuals |
|||
|
SSI |
$943.00 |
$967.00 |
$989.00 |
|
SSP |
239.94 |
239.94 |
239.94 |
|
Totals |
$1,182.94 |
$1,206.94 |
$1,228.94 |
|
Percent of federal poverty levelb |
94.26% |
92.54% |
90.45% |
|
Maximum Grant—Couples |
|||
|
SSI |
$1,415.00 |
$1,450.00 |
$1,483.00 |
|
SSP |
607.83 |
607.83 |
607.83 |
|
Totals |
$2,022.83 |
$2,057.83 |
$2,090.83 |
|
Percent of federal poverty levelb |
118.76% |
116.76% |
113.87% |
|
aThe maximum monthly grants displayed refer to those for aged and disabled individuals and couples living in their own households, effective as of January 1 of the respective fiscal year. bCompares grant level to federal poverty guidelines from the U.S. Department of Health and Human Services for 2024 and 2025. Estimates of federal poverty guidelines for 2026 are based on the LAO Consumer Price Index for All Urban Consumers projection. The 2026 federal poverty guidelines will not be finalized until fall 2025. |
|||
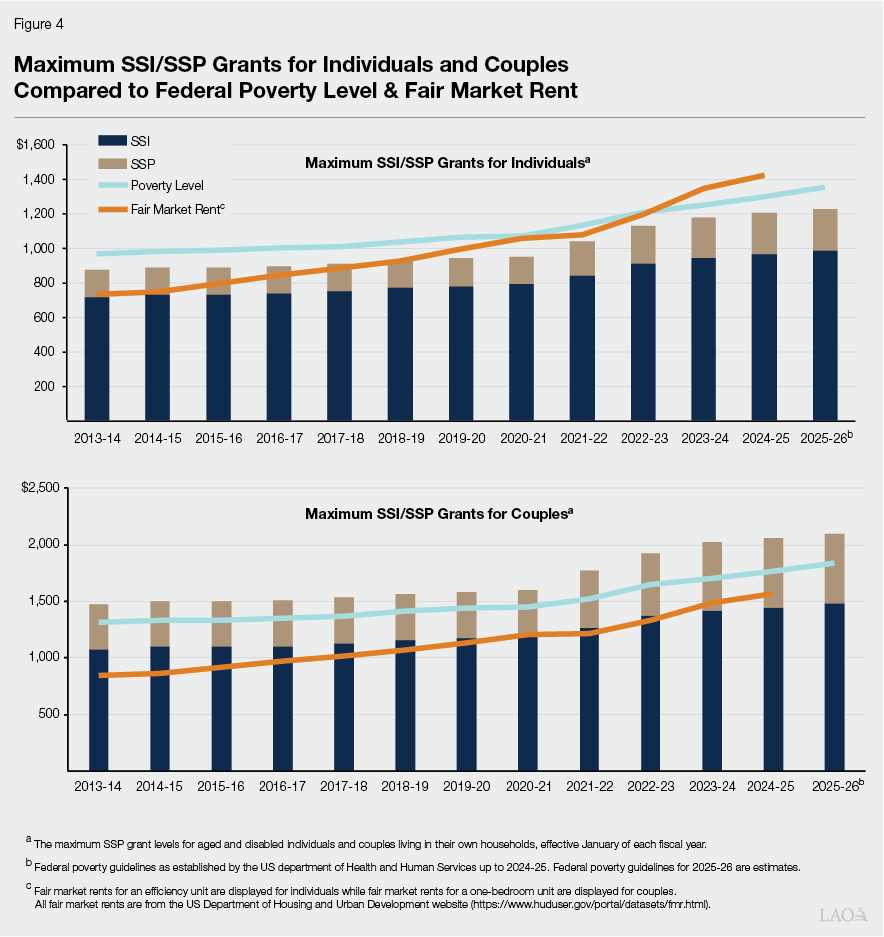
Despite Recent SSI and SSP Grant Increases and Upcoming COLA, Grant Levels Remain Below Federal Poverty Level (FPL) for Individuals. As shown in Figure 4, from 2013-14 through 2020-21, the maximum combined SSI/SSP monthly grant amount for individuals (the bulk of the SSI/SSP caseload) and couples had increased on average by 1.2 percent annually—predominantly due to the provision of federal SSI COLAs. However, from 2021-22 through 2023-24, the maximum combined SSI/SSP monthly grant amount for individuals and couples had increased on average by 7.4 percent annually—predominantly due to the provision of federal SSI COLAs and historically high SSP grant increases, including the highest in history one-time SSP grant increase of roughly 24 percent in January 2022. Despite these recent grant increases, current maximum SSI/SSP grant levels for individuals remain below the FPL, while grant levels for couples remain just above the FPL. Despite a 2.5 percent federal SSI COLA in January 2025 and an estimated 2.3 percent SSI COLA projected for January 1, 2026, maximum SSI/SSP grant levels for individuals are projected to remain (and fall further below) the FPL through 2025-26.
Legislative Interest in Comparing Grant Levels to Housing Costs. In recent years, the Legislature has been interested in understanding how SSI/SSP grant levels compare to housing costs in the state. DSS has recently compared maximum grant amounts for individuals and couples to county level fair market rents (FMR). Specifically, at the county level, DSS compares the maximum SSI/SSP grant amount for individuals to the FMR of an efficiency unit (an apartment unit with no separately enclosed bed-room, similar to a studio apartment) and the maximum SSI/SSP grant amount for couples to the FMR of a one-bedroom unit.
FMR represents the 40th percentile of rent plus utility costs for a rental unit that meets certain health a safety standards.
FMR Growth Outpaces Grant Level Growth. Between 2013-14 and 2024-25, FMRs have grown significantly faster than SSI/SSP grant levels. During this time period, the average FMR for an efficiency unit in Californian has grown by 94 percent (compared to 38 percent growth for the maximum SSI/SSP grants for individuals). Similarly, the FMR for a one-bedroom unit has grown by 85 percent (compared to 39 percent growth for the maximum SSI/SSP grants for couples). As shown in Figure 5, FMR takes up a significant portion or exceeds recipient grants in all counties. For an efficiency unit, FMRs are between 61 percent and 253 percent of the maximum SSI/SSP grant for individuals and between 36 percent and 148 percent of the maximum SSI/SSP grant for couples.
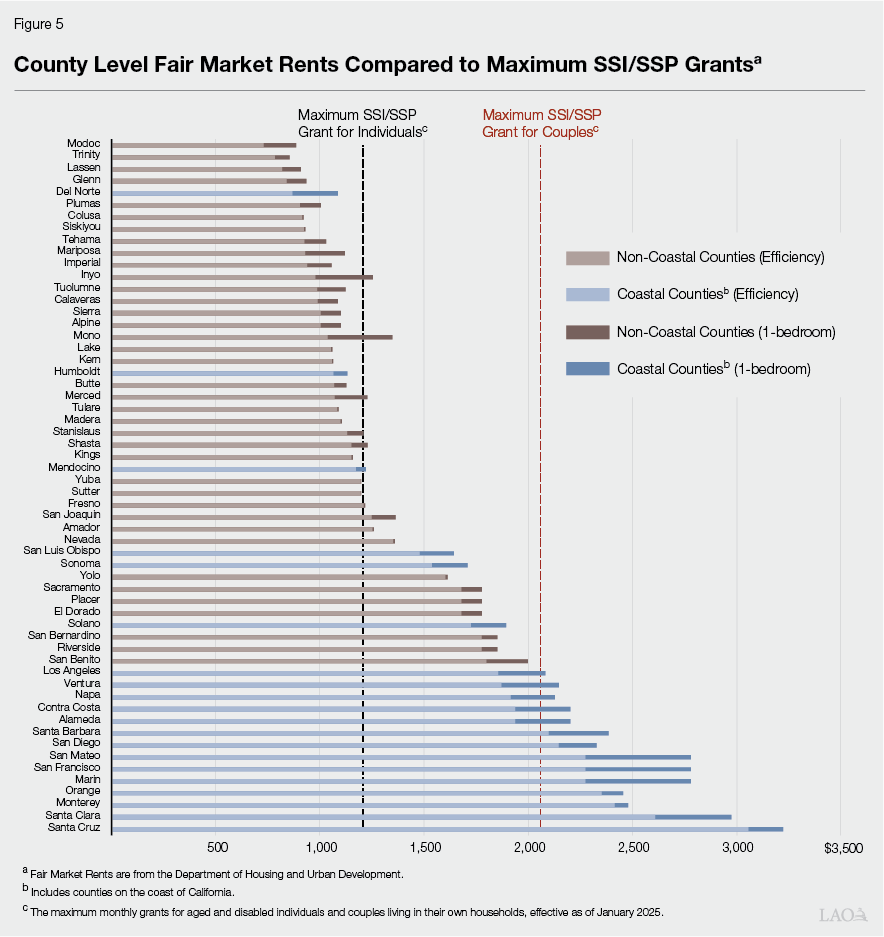
Further, most SSI/SSP recipients (roughly 60 percent) live in the 14 counties with the highest FMRs, all of which are located within the Central Coast and San Francisco Bay regions, as well as Los Angeles, Orange, and San Diego Counties. In all of these 14 counties, the maximum SSI/SSP grant for couples is less than the FMR for a one-bedroom unit. This includes nine counties (where 22.5 percent of SSI/SSP recipients live) where the maximum SSI/SSP grant for couples is less than the FMR for an efficiency unit.