
February 25, 2025
The 2025-26 Budget
California State University
Summary
Brief Covers the California State University (CSU). This brief analyzes the state’s budget plan relating to CSU’s core operations and enrollment. Under the 2025‑26 budget plan, CSU receives $9.1 billion in total core funding. Of this amount, about 60 percent comes from state General Fund ($5.4 billion) and 40 percent from student tuition revenue ($3.7 billion).
Under Plan, State Support for CSU Declines but Tuition Revenue Increases. The budget plan includes a $375 million ongoing General Fund reduction for CSU. CSU’s $375 million reduction is partly offset by a $75 million restoration and $178 million in targeted General Fund augmentations, mostly for pension and retiree health cost increases. Altogether, ongoing General Fund support for CSU decreases by $122 million (2.2 percent) in 2025‑26. After accounting for a projected increase in student tuition revenue, ongoing core funding for CSU would increase by 0.7 percent.
Budget Plan Also Includes Deferred Augmentation. The administration has a compact with the CSU’s Chancellor to provide CSU with 5 percent annual base increases from 2022‑23 through 2026‑27. The budget plan, however, defers the 2025‑26 increase ($252 million) until 2027‑28. As part of the deferral arrangement, the state would plan to provide CSU with one‑time back payments in 2026‑27 and 2027‑28.
CSU’s Spending Priorities Exceed Available Funding. A couple of years ago, CSU’s operating cost increases (particularly compensation costs) began outpacing its new funding. The same misalignment arises under the 2025‑26 budget plan. In response, CSU has begun making budget adjustments, including instituting hiring freezes and reducing nonessential expenses. Though CSU does not yet know how it would respond to the deferral, it would face more disruptive budget adjustments if it increased spending in 2025‑26 and then the deferred payments were eliminated or postponed. The state has not yet indicated how it would pay for the deferral.
CSU Is Directed to Grow Enrollment Without Additional State Funding. The 2024‑25 Budget Act directed CSU to increase resident undergraduate enrollment by 6,338 full‑time equivalent (FTE) students in 2024‑25. CSU reports that it is exceeding that expectation—growing by an estimated 9,326 resident undergraduate FTE students. The 2025‑26 budget plan sets expectations that CSU grows by an additional 10,161 FTE students in 2025‑26 (and again in 2026‑27). Yet, no associated state funding is provided to support that additional enrollment.
Recommend Signaling More Realistic Budget Expectations for CSU. Given the state is projected to face operating deficits over the next three budget years, the Legislature could face the difficult decision of either cutting other ongoing state programs to make room for CSU’s augmentations, or, alternatively, forgoing or further postponing those augmentations. Rather than instituting deferrals, we recommend the Legislature wait until the given budget year to make changes to CSU’s funding. This would provide a more accurate funding expectation for CSU and would be a more prudent and sustainable approach for both CSU and the state.
Recommend Holding CSU’s Resident Enrollment Target Flat for 2025‑26 and 2026‑27. Given the lack of funding, we recommend the Legislature hold CSU’s resident enrollment expectation flat at its existing 2024‑25 level for the next two years. By holding enrollment flat, CSU would avoid having to make further budget adjustments, such as larger classes or fewer course offerings, to accommodate the higher costs associated with enrollment growth.
Introduction
Brief Focuses on the CSU. CSU is one of California’s three public higher education segments. Its 23 campuses provide undergraduate and graduate education. CSU focuses on academic degrees through the master’s level, but it also provides doctoral degrees in certain, primarily applied, fields. This brief is organized around the 2025‑26 budget plan for CSU. The first section provides an overview of that plan. The next two sections focus on CSU’s core operations and enrollment, respectively. The final section discusses the Governor’s proposal to increase ongoing state support for the Capital Fellows program, which CSU’s Center for California Studies administers.
Overview
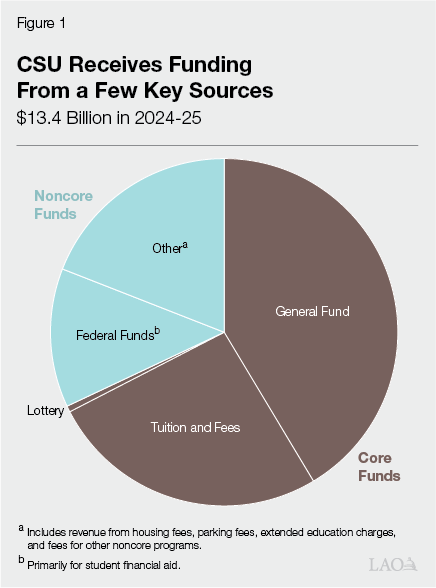
CSU’s Budget Is $13.4 Billion in 2024‑25. As Figure 1 shows, CSU receives funding from various sources. The state generally focuses its budget decisions around CSU’s “core funds,” or the portion of its budget supporting its academic mission. Core funds at CSU primarily consist of state General Fund and student tuition revenue, with a very small share coming from state lottery revenue. Core funds typically comprise approximately 70 percent of CSU’s budget. Between 2023‑24 and 2024‑25, ongoing core funds per student increased 1.3 percent at CSU. The average annual growth rate of ongoing core funds per student has been approximately 3 percent over the past ten years. The remainder of CSU’s revenue comes from various noncore sources including housing fees, parking fees, and extended education charges.
Ongoing Core Funding Increases by $66 Million (0.7 Percent) Under 2025‑26 Budget Plan. As Figure 2 shows, the slight increase in ongoing core funding is the net result of higher tuition and fee revenue coupled with a decrease in General Fund support. For 2025‑26, CSU estimates tuition and fee revenue will increase by $188 million (5.4 percent). General Fund support decreases by a net of $122 million (2.2 percent). The increase in tuition and fee revenue is due to both higher tuition charges and enrollment growth. Because expected enrollment growth (1.7 percent) outpaces the increase in core funding, ongoing core funding per student decreases by 0.9 percent.
Figure 2
CSU’s 2025‑26 Core Funds Increase Comes From Tuition Revenue
(Dollars in Millions, Except Funding Per Student)
|
2023‑24 |
2024‑25 |
2025‑26 |
Change From 2024‑25 |
||
|
Amount |
Percent |
||||
|
Ongoing Core Funds |
|||||
|
General Funda |
$5,391 |
$5,526 |
$5,403 |
‑$122 |
‑2.2% |
|
Tuition and feesb |
3,267 |
3,477 |
3,665 |
188 |
5.4 |
|
Lottery |
83 |
76 |
76 |
—c |
—c |
|
Totals |
$8,741 |
$9,078 |
$9,144 |
$66 |
0.7% |
|
FTE studentsd |
391,268 |
401,300 |
407,936 |
6,636 |
1.7% |
|
Funding per student |
$22,339 |
$22,622 |
$22,416 |
‑$206 |
‑0.9 |
|
aIncludes funding for pensions and retiree health benefits. bIncludes funds used for student financial aid. cLess than $500,000 or 0.5 percent. dReflects total combined resident and nonresident enrollment. The 2025‑26 number incorporates CSU’s planned resident enrollment growth. |
|||||
|
FTE = full‑time equivalent. |
|||||
Reduction in State Support Is the Net Result of a Few Factors. As the top part of Figure 3 shows, the Governor’s budget includes a total of $178 million ongoing General Fund to cover various expected CSU cost increases. The state covers a large share of CSU’s expected cost increases for its California Public Employees’ Retirement (CalPERS) contributions, as well as all of its cost increases for retiree health benefits. Additionally, the Governor’s budget includes ongoing General Fund augmentations of $1.3 million to fund salary increases for the Capital Fellows program, $345,000 to provide drug test devices to every on‑campus health center as required in recently enacted legislation, and $158,000 for certain increases in technology charges. More than offsetting these targeted increases is a $300 million reduction in base support. This reduction is pursuant to Control Section 4.05 of the 2024‑25 Budget Act, which applies reductions of up to 7.95 percent to state operations broadly across state government. In the box below, we discuss the impact of Control Section 4.05 on CSU in comparison to other state agencies.
Figure 3
CSU Has Net Decrease in General Fund Support Under Budget Plan
General Fund Changes, 2025‑26 (In Millions)
|
Targeted Increases |
|
|
Pension cost increase |
$136 |
|
Retiree health benefit cost increase |
41 |
|
Capital Fellows (salary increase) |
1 |
|
CENIC cost increase |
—a |
|
Drug testing devices at campuses |
—b |
|
Subtotal |
$178 |
|
Base Reductions |
|
|
Ongoing reduction |
‑$375 |
|
Restoration of one‑time reduction |
75 |
|
Subtotal |
‑$300 |
|
Total |
‑$122 |
|
aThe 2021‑22 budget agreement included a five‑year plan for covering higher CENIC charges. The annual funding increase in 2025‑26 is $158,000. bBudget proposes $345,000 ongoing General Fund to support the costs of recently chaptered legislation that requires CSU to provide drug testing devices at every on‑campus health center. |
|
|
CENIC = Corporation for Education Network Initiatives in California. |
|
Control Section 4.05 Impacts CSU Differently Than Other State Agencies
CSU Differs From Other State Agencies in Significant Ways. As discussed in The 2025‑26 Budget: Higher Education Overview, CSU was included in the Control Section 4.05 reductions, but it differs in some notable ways from other state agencies. One difference is that the state designates all CSU appropriations as “state operations,” with none designated as “local assistance.” This means all university spending at both the system and campus levels are designated as state operations. Applying a flat percentage reduction to state operations funding for CSU, therefore results in a much more sizeable cut—one that is likely to have a direct impact on campuses. In contrast, the state is not applying an across‑the‑board reduction to other agencies’ local assistance programs. From this perspective, CSU is more adversely impacted by Control Section 4.05. Another notable difference, however, is CSU generates substantial nonstate revenue through student tuition. Anticipated growth in tuition revenue more than offsets the reduction in state funding, leaving CSU’s total ongoing core funding increasing slightly in 2025‑26. A third notable difference is that the state does not directly authorize each employee position at CSU, as is typically the case with state agencies. Instead, the CSU Board of Trustees has this authority. This is why CSU was excluded from the vacant positions sweep imposed by Control Section 4.12 of the 2024‑25 Budget Act.
Budget Plan Defers Base Increase. In May 2022, the administration announced a compact with CSU’s Chancellor to provide the university system with 5 percent annual base increases from 2022‑23 through 2026‑27. The compact is not codified, and state budget plans have not strictly adhered to it. Whereas state budget plans provided more than 5 percent General Fund increases to CSU the first two years of the compact, the plan included less than 5 percent increases in 2024‑25. Specifically, over the past three years, ongoing General Fund support for CSU has increased 9.4 percent, 6.9 percent, and 2.5 percent, respectively. For 2025‑26, the state budget plan includes a net General Fund reduction for CSU rather than a base increase. The budget plan, however, has a component that defers a $252 million (about 5 percent) General Fund base augmentation for CSU from 2025‑26 until 2027‑28. As part of the deferral arrangement, the state would provide CSU with one‑time back payments of $252 million in 2026‑27 (to cover 2025‑26 costs) and 2027‑28 (to cover 2026‑27 costs).
Core Operations
In this part of the brief, we first provide background on CSU’s core operations. Next, we describe the state’s multiyear budget plan for CSU, followed by CSU’s spending priorities based on that plan. Then, we assess the impact of the plan and make an associated recommendation.
Background
In this section, we first discuss CSU’s sources of core funding. We then discuss CSU’s largest operating cost pressures.
Funding
Share of CSU Costs Covered by General Fund Has Increased Over the Past Decade. Since 2013‑14, CSU has primarily relied on state General Fund augmentations to cover increases in its operating costs. From 2013‑14 to 2024‑25, the state provided CSU with General Fund base increases every year except in 2020‑21. During the same period, CSU increased tuition twice (in 2017‑18 and 2024‑25). As a result, the General Fund has been comprising a growing share of CSU’s core funds. Whereas we estimate the General Fund comprised 50 percent of CSU’s ongoing core funds in 2013‑14, it comprises 61 percent in 2024‑25.
CSU Began Implementing Tuition Increases in 2024‑25. CSU’s tuition levels have long been lower than its peers nationally. In 2023‑24, CSU’s resident undergraduate tuition and fees were approximately $2,171 (22 percent) lower than the national average of comparable public institutions. Until recently, CSU has not had a tuition policy guiding its annual tuition levels. A CSU work group focused on fiscal sustainability, however, recently identified a significant gap between the system’s costs and its revenues. One of the work group’s recommendations was that CSU adopt a tuition policy that provides for gradual and predictable increases. The CSU Board of Trustees adopted such a tuition plan in September 2023. Under the plan, tuition increases by 6 percent annually for all students, beginning in 2024‑25 and extending through 2028‑29.
CSU Reports a $138 Million Budget Gap in 2023‑24 and $218 Million Gap in 2024‑25. In both 2023‑24 and 2024‑25, CSU received increases in its state General Fund support, along with increases in its total core funding. As CSU typically does, it allocated a portion of its General Fund base increase in 2024‑25 to campuses for employee compensation. The amounts allocated to campuses for employee compensation, however, fell short of actual employee compensation costs. CSU indicates it did not have sufficient funding after accounting for health care premium increases, insurance premium increases, maintenance and operations of new facilities, enrollment growth, and other state‑required initiatives to cover the full cost of compensation increases. As a result, CSU is in the midst of addressing a budget deficit. Campuses are responsible for covering these shortfalls from their existing budgets. CSU shared that campuses are addressing the shortfalls through measures such as implementing personnel reductions and restructuring, deferring capital renewal projects, and reducing non‑essential expenses such as travel and professional development.
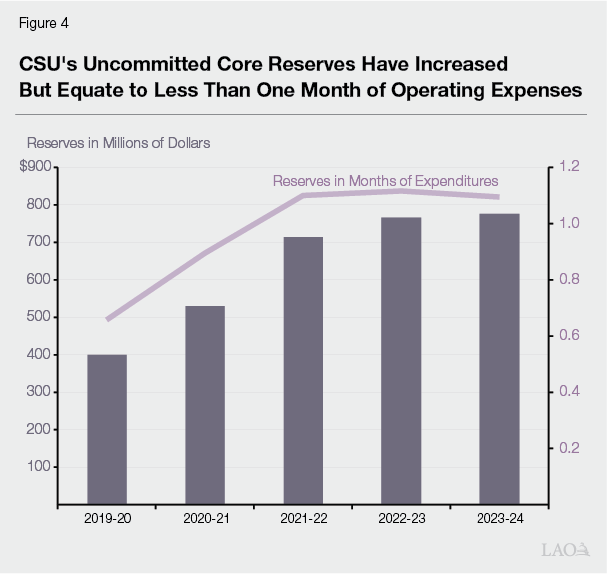
CSU’s Reserves Have Increased but Remain Below Its Target. Like many other universities (as well as public and private entities more generally), CSU maintains reserves. CSU commits part of its reserves for outstanding financial commitments and planned one‑time activities (such as launching a new academic program or designing a new capital project). CSU also leaves some of its reserves purposefully uncommitted to prepare for economic uncertainties, including recessions. CSU’s systemwide reserves policy sets a target to maintain uncommitted reserves worth between three and six months of expenditures. As of June 30, 2024 (the most recent data available), CSU had $2.4 billion in total core reserves, of which $777 million was uncommitted. As Figure 4 shows, CSU’s uncommitted core reserves have generally increased over the past five years, reaching 1.1 months of expenditures in 2023‑24. Nonetheless, its reserve level remains below the system’s target.
Cost Pressures
CSU’s Largest Operating Cost Is Employee Compensation. Similar to many other state agencies, the bulk of CSU’s operating costs are for employee salaries and benefits. In 2023‑24, 75 percent of CSU’s core spending was for these purposes. That year, CSU reported spending $6.4 billion on compensation packages for faculty, staff, and management. Nearly every year, CSU faces at least some pressure to raise employee salaries, while also having to cover certain pension and health care cost increases.
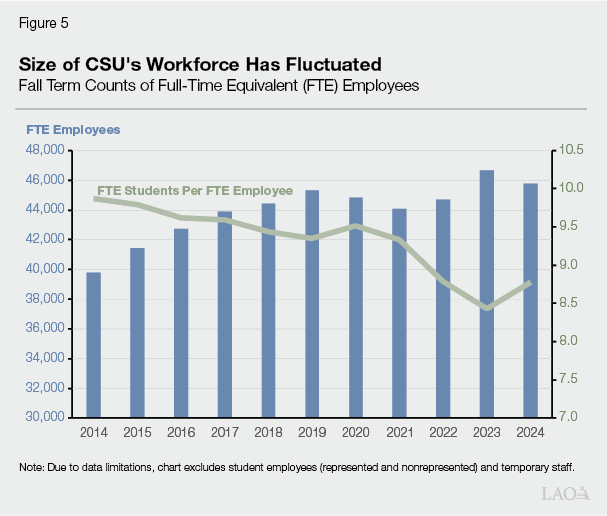
CSU Has About 46,000 FTE Employees. Of these employees, about 45 percent are faculty, about 45 percent are staff, and the remaining 10 percent are managers and executives. As Figure 5 shows, CSU’s workforce grew steadily from fall 2014 through fall 2019, before declining during the pandemic (fall 2020 and fall 2021). CSU’s workforce rebounded in fall 2022 and fall 2023, reaching its highest level ever in fall 2023. Because student enrollment declined throughout the pandemic years, the number of FTE students per FTE employee decreased from 9.4 in fall 2018 to 8.4 in fall 2023. In fall 2024, CSU’s workforce declined by 1.8 percent, contributing to an increase in its FTE students per FTE employee ratio (8.8).
Most CSU Employees Are Represented by a Labor Union. Eight unions represent various groups of CSU employees. The largest union representing CSU employees is the California Faculty Association (CFA). CFA represents professors, lecturers, counselors, librarians, and coaches. As Figure 6 shows, CFA employees account for half of CSU’s overall salary base. The second largest union is the California State University Employees Union (CSUEU). CSUEU represents support staff in various roles, including in the areas of administration, technology, and health services. CSUEU employees account for nearly 25 percent of CSU’s overall salary base. The remaining six unions at CSU represent student services staff, skilled trades workers, and graduate students, among other workers. Collectively, these employees account for approximately 10 percent of CSU’s overall salary base. Managers and executive staff, who comprise approximately 15 percent of CSU’s salary base, are not represented by a union.
Figure 6
Two Unions Comprise the Majority of CSU’s Workforce
Key Information About CSU Unions
|
Percent of CSU Payroll |
Percent of CSU Employees |
General Salary Increases |
|||
|
2023‑24 |
2024‑25 |
||||
|
California Faculty Associationa |
49% |
46% |
5% |
5% |
|
|
California State University Employees Union |
23 |
23 |
5 |
5 |
|
|
Academic Professionals of California |
6 |
6 |
5 |
5 |
|
|
Teamsters 2010 |
2 |
2 |
5 |
—b |
|
|
United Auto Workers |
1 |
14 |
5 |
5 |
|
|
Statewide University Police Association |
1 |
1 |
5 |
5 |
|
|
Union of American Physicians and Dentists |
0.3 |
0.1 |
5 |
5 |
|
|
International Union of Operating Engineers |
0.02 |
0.02 |
5 |
5 |
|
|
aAgreement also includes 2.65 percent service salary increases for faculty below certain salary levels, along with increases in the minimum salary for certain faculty positions, in 2023‑24 and 2024‑25. bIn lieu of GSI, a salary step structure is being implemented beginning in 2024‑25. Employees will receive regular salary increases based on their length of service in their classification. |
|||||
|
Note: Data shown for “Percent of CSU Payroll” and “Percent of CSU Employees” is for 2023‑24. Table excludes Executives & Management Personnel Plan, Confidential Classes, Excluded Classes, non‑represented student employees, other intermittent or casual employees, and faculty teaching in extension, special sessions, and summer sessions. |
|||||
Most Employee Salary Levels Are Determined Through Collective Bargaining. Whereas the Legislature ratifies collective bargaining agreements for most represented state employees, state law authorizes the CSU Board of Trustees to ratify collective bargaining agreements for CSU’s employees. These collective bargaining agreements determine salary increases for represented employees. The agreements also often indirectly guide salary increases for CSU’s nonrepresented employees. Over the past decade, CSU employees generally have received salary increases in all years except 2020‑21 (when the state reduced General Fund support for CSU in response to a projected budget shortfall due to the COVID‑19 pandemic).
CSU Has Negotiated Salary Increases for 2024‑25. As Figure 6 also shows, CSU has agreements with all of its unions for 2024‑25. (CSU does not yet have an agreement with the CSUEU Student Assistants bargaining unit, which was established last year.) All unions, except Teamsters 2010 (representing employees in skilled crafts such as painters, electricians and carpenters), are receiving a 5 percent general salary increase in 2024‑25. Teamsters 2010 has implemented a salary step structure where employees will receive regular salary agreements based upon their length of service. All agreements have been ratified. As is typical practice, CSU is also providing a comparable (5 percent) salary increase to its nonrepresented employees in 2024‑25.
CSU Is Directly Responsible for Certain Pension Costs. CalPERS administers pension benefits for CSU and most other state employees. The CalPERS Board sets employer contribution rates for pensions as a percentage of payroll. The state and CSU each pay a portion of the total employer contribution. The state’s contribution is determined by applying the employer contribution rate to CSU’s 2013‑14 payroll level. CSU’s contribution is determined by applying the employer contribution rate to any payroll growth above that level. The state adopted this arrangement in 2013‑14 to provide CSU with a stronger fiscal incentive to contain staffing costs. CalPERS contributions rates increased every year from 2011‑12 through 2019‑20, rising from 18.2 percent to 31 percent over that period (for Miscellaneous Tier 1 state employees). Since that time, rates have been more variable, as the state, in some years, has applied certain supplemental payments toward CalPERS costs, which have temporarily lowered rates.
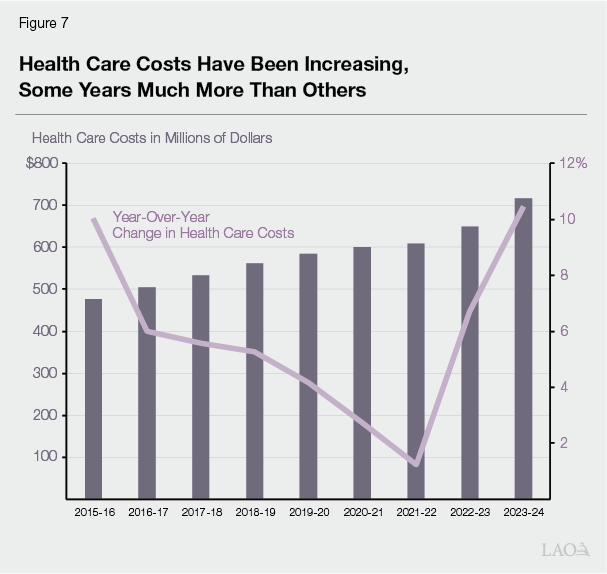
CSU Contributes to Employee Health Benefits. CalPERS also administers CSU’s health benefits. Each year, CalPERS negotiates with health plan providers to establish premiums for the plans offered to CSU’s employees. Pursuant to state law, CSU’s contribution to employee health benefits is based on the average premium of the most popular health plans. When premiums increase, CSU covers the associated cost for its active employees. In contrast, the state covers the cost for retirees’ health benefits. As Figure 7 shows, CSU’s total spending on employee health care costs has been increasing over time, reaching $717 million in 2023‑24. As Figure 7 also shows, the rate at which costs have increased has varied notably over the last decade, with annual increases as low as 1.2 percent and as high as 10 percent.
CSU Covers Certain Financial Aid Cost Increases With Tuition Revenue. Another cost pressure for CSU is student financial aid. CSU administers an institutional financial aid program called the State University Grant (SUG) program. Currently, the SUG program provides tuition coverage to about 140,000 students with financial need. CSU sets aside a portion of its tuition revenue to cover SUG costs. In 2017‑18, SUG spending increased by 6 percent due to a tuition increase. Spending on SUG remained flat until 2024‑25. In 2024‑25, CSU increased SUG spending by $59 million (8.4 percent) due to another a tuition increase and enrollment growth. CSU is spending $760 million on SUG in 2024‑25.
CSU Issues University Bonds to Finance Capital Projects. State law authorizes CSU’s Board of Trustees to issue university bonds to debt finance capital projects. Historically, CSU has used university bonds primarily to finance self‑supporting facilities. Since 2014‑15, university bonds have been the main source of financing for CSU’s state‑supported facilities. Under the new approach, CSU issues university bonds for academic capital projects, then pays the associated debt service from its main General Fund appropriation. In 2024‑25, CSU committed 5 percent of its operating budget ($440 million) to debt service.
CSU Has High Capital Renewal Cost Pressures. Many of CSU’s academic facilities are at least 40 years old. As facilities age, their building components (such as roofs and heating systems) eventually reach the end of their useful life and need to be replaced. When campuses do not address these capital renewal needs as they emerge, they create backlogs known as deferred maintenance. CSU currently has $8.2 billion in deferred maintenance.
CSU Has Other Operating Costs. CSU also has ongoing costs related to various other operating expenses, including providing maintenance services for new campus facilities, upgrading technology and equipment, and covering rising insurance and utilities costs. In 2024‑25, costs for operations and maintenance of new facilities increased by $13 million, and liability and property insurance premiums increased by $23 million.
2025‑26 Budget
In this section, we begin by discussing CSU’s identified funding for 2025‑26, followed by CSU’s spending priorities given available resources.
Funding
CSU’s Tuition Revenue Scheduled to Increase in 2025‑26. CSU estimates it will collect an additional $188 million in student tuition revenue in 2025‑26. Most of this increase is due to the planned rise in CSU’s tuition charges. Tuition charges are set at $6,450 for resident undergraduate students in 2025‑26, reflecting a $366 increase from 2024‑25. CSU estimates generating an additional associated $164 million. CSU plans to use $55 million (33 percent) of this additional revenue to provide larger tuition awards through its SUG program. (In addition, the California Student Aid Commission budget includes $37 million ongoing General Fund to pay for higher associated Cal Grant costs for CSU students in 2025‑26. Many CSU students with financial need receive full tuition coverage under the Cal Grant program.) CSU expects to generate $24 million in new tuition revenue from planned enrollment growth in 2025‑26.
Total Core Funding Increases Slightly in 2025‑26. Despite the increase in tuition revenue, total core funding for CSU increases only slightly in 2025‑26. This is because of the net reduction in General Fund reduction of $122 million. As a result of changes in both student tuition revenue and state General Fund support, 2025‑26 ongoing core funding for CSU is expected to increase by only $66 million.
Spending
CSU Indicates It Will Limit Spending Increases to Nondiscretionary Costs. Given funding increases are not covering all of its identified spending priorities, CSU indicates it will prioritize paying for certain costs it deems nondiscretionary. As Figure 8 shows, these nondiscretionary costs total $164 million. The largest of these costs is for health care. CSU’s health care premiums in 2025 are increasing 7.8 percent. The next largest cost increase is in SUG spending. When CSU increases its tuition charges, it intends to fully cover the higher charges for most SUG recipients. (Neither state nor federal law requires CSU to increase SUG spending in this way, but CSU’s practice has been to cover the higher charges.) Given its budget shortfall, CSU indicates it plans to forego increasing spending for its other priorities.
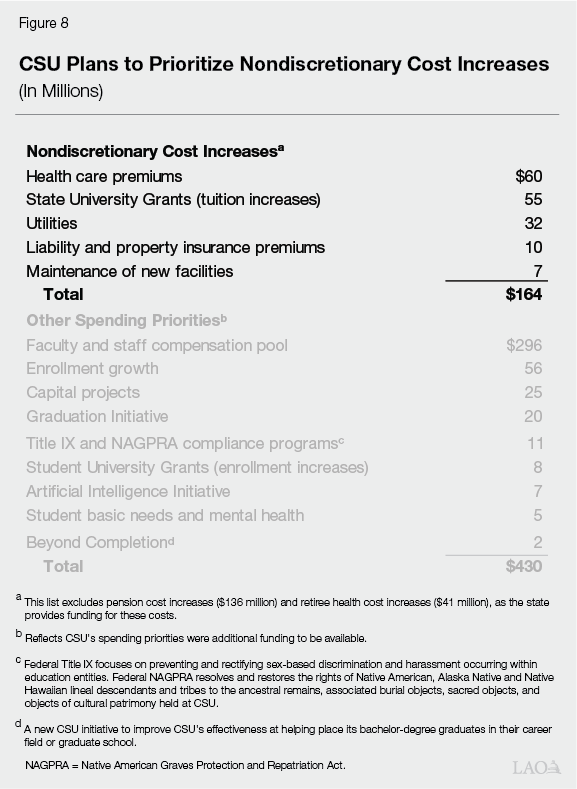
Pension Contribution Rates Are Expected to Increase in 2025‑26. Figure 8 excludes a couple of CSU cost increases—relating to pensions and retiree health care—because the state covers them. Specifically, the Governor’s budget includes a $136 million increase to cover most of the employer contribution towards CSU’s pension costs and $41 million for retiree health care costs. The Governor’s budget assumes that employer CalPERS pension contribution rate increases in 2025‑26 are particularly high. Under the Governor’s budget, the employer contribution rate for the largest CSU employee group (miscellaneous) would be 32 percent of pay—5.6 percentage points higher than the rate in 2024‑25. The employer contribution rate for other CSU employees (peace officers and firefighters) would be 49 percent of pay—18 percentage points higher than the rate in 2024‑25. These larger‑than‑normal annual rate increases are due mainly to the 2024‑25 rates being temporarily depressed (as a result of certain assumptions relating to a 2023‑24 Proposition 2 debt payment that the state applied toward CalPERS costs in 2024‑25).
CSU Has Some Contingent Salary Agreements in Place for 2025‑26. CSU has salary agreements with three unions (CSUEU, Teamsters 2010, and the Statewide University Police Association) that extend through 2025‑26. All three unions have implemented a salary step structure where employees will receive regular salary increases based on their length of service in their classification. These agreements have been ratified, but the salary agreements are all contingent upon the state providing a specified amount of support to CSU in 2025‑26. If implemented, these agreements would result in compensation increases totaling approximately $70 million in 2025‑26. Given CSU does not receive a General Fund augmentation in 2025‑26 under the budget plan, CSU likely would not implement the associated salary increases. As of this writing, 2025‑26 compensation increases have not yet been determined for the remaining unions, as well as nonrepresented employees.
CSU’s Budget Gap Likely to Grow in 2025‑26. CSU’s budget gap (between available funding and spending) began in 2023‑24, grew in 2024‑25, and is on track to grow further in 2025‑26. After accounting for the estimated increase in core funds in 2025‑26, together with nondiscretionary core spending increases (including pensions and health care), we estimate CSU would have a $276 million budget shortfall. This shortfall does not account for any of CSU’s remaining spending priorities (such as salary increases).
Assessment
In this section, we discuss the impact of the budget plan both on CSU and the state.
Impact on CSU
Impacts of the Budget Plan Will Be Felt Differently Across Campuses. CSU’s expected budget shortfall in 2025‑26 will put pressure on campuses to make further budget adjustments. Campuses likely will implement some ongoing spending reductions, with some campuses potentially also drawing down some of their reserves. Campuses with smaller reserves could see more notable spending reductions. Given employee compensation is CSU’s largest operating cost, campuses could look into hiring freezes, leaving positions open or eliminating positions. If faculty positions are left open, students could see larger class sizes and fewer course offerings. If staff and administrative positions are left open, students could see an impact on their support services. If salary increases are not implemented, CSU might see some negative impact on employee recruitment and retention, particularly if CSU’s compensation packages become less competitive relative to peer organizations. Though campuses with strong enrollment growth and larger reserves likely would feel less of an impact on their budgets, CSU has shared that all campuses would be impacted in some way.
Impact on the State
Budget Plan Calls to Increase CSU Funding Significantly in 2026‑27 Despite Projected Deficit. As Figure 9 shows, the budget plan includes a 2.2 percent decrease in General Fund support for CSU in 2025‑26, followed by a 9.6 percent increase in 2026‑27. The large increase in 2026‑27 is due to the deferral arrangement. The state has set forth no plan as to how it would pay for such a large CSU augmentation while facing a deficit. Given the state budget plan does not include a base increase for CSU in 2025‑26, it is unlikely the state could afford such an increase in 2026‑27 (absent a change in the state’s fiscal condition or new budget solutions). Were CSU to raise its spending in 2025‑26 on the assumption it would receive state payment in 2026‑27, and then state payment were not forthcoming, CSU would face more disruptive spending choices at that time. From either the state’s or CSU’s perspective, we do not see strong justification for adopting such a risky and imprudent approach. Typically, when facing deficits, the state initiates efforts to contain costs, not increase them.
Recommendation
Figure 9
Deferral Plan for CSU Sets Unrealistic Expectation of Large Increase in 2026‑27
Reflects Multiyear Assumptions of Deferral Plan, General Fund (Dollars in Millions)
|
2025‑26 Year 4a |
2026‑27 Year 5a |
2027‑28 |
|
|
Ongoing Changes |
|||
|
Base reduction |
‑$375 |
— |
— |
|
Two‑year deferral of year 4 base increaseb |
— |
— |
$252 |
|
Anticipated year 5 base increase |
— |
$265 |
— |
|
One‑Time Back Payments |
|||
|
Base costs |
— |
$252 |
$252 |
|
One‑Time Adjustmentsc |
$75 |
— |
‑$252 |
|
Totals |
$5,403 |
$5,921 |
$6,173 |
|
Change from previous year |
‑2.2% |
9.6% |
4.3% |
|
aIn 2025‑26, the Governor will be entering year 4 of his compact with the CSU Chancellor. The fifth and final year of this compact is 2026‑27. A new governor will take office in 2027‑28. bThe Governor proposes to defer the year 4 base increase from 2025‑26 to 2027‑28. In 2026‑27, he proposes to provide a one‑time back payment to 2025‑26. In 2027‑28, he proposes to provide a one‑time back payment to 2026‑27, while also providing the deferred base increase. cIn 2025‑26, reflects the restoration of $75 million one‑time reduction applied in 2024‑25. In 2027‑28, reflects removal of prior‑year, one‑time back payment. |
|||
Recommend Removing Deferral to Signal More Realistic Budget Expectation. Both our office and the administration project that the state will face large operating deficits in 2026‑27 and 2027‑28 (as well as in 2028‑29). Given these projected deficits, increasing spending on CSU in upcoming years would require a like amount of other budget solutions. Next year, the Legislature might face the difficult decision of either cutting other ongoing state programs to make room for CSU’s base increase or, alternatively and more realistically, forgoing the base increase. Rather than instituting deferrals, we recommend the Legislature wait until the given budget year to make changes to CSU’s base funding. This would provide a more accurate funding expectation for CSU and would be a more prudent and sustainable approach for both CSU and the state.
Enrollment
In this section, we first provide background on CSU enrollment and cover recent enrollment trends. Then, we describe the state’s 2025‑26 enrollment expectations for CSU, followed by CSU’s enrollment growth plans. Finally, we assess CSU’s enrollment situation and provide a recommendation for the Legislature to consider.
Background
Most CSU Students Are California Residents. Approximately 95 percent of students at CSU are California residents, with the remainder of students coming from other states or countries. The share of resident students has hovered at about 95 percent over the past ten years. Of resident students, approximately 90 percent are undergraduates and 10 percent are postbaccalaureate and graduate students. Though the share of resident students is high systemwide, some variation exists among campuses. In 2023‑24, the CSU Stanislaus student body had the highest share of resident FTE students (99 percent), whereas CSU San Luis Obispo had the lowest share (84 percent).
CSU Is Important Part of Transfer Pipeline. Since at least the 1960s, the state has wanted to provide an opportunity for Californians to obtain a university education, if they so desire. To this end, any student (regardless of their high school performance) who successfully completes a course of study at a community college may transfer to a university for their upper‑division coursework. The state considers CSU a particularly critical part of this transfer pipeline. Nearly half of community college students who transfer to a four‑year institution transfer to a CSU. Over time, roughly half of CSU’s incoming undergraduates have been transfer students, with the other half being freshmen.
State Budget Typically Sets Enrollment Growth Expectations for CSU. In most years, the state sets enrollment growth expectations for CSU in the annual budget act. These growth expectations apply to resident students. In some years, the state sets expectations for total CSU resident enrollment. In other years, its sets expectations only for resident undergraduates, with no expectation for resident graduate students. CSU tracks a running total of these growth expectations, which it commonly refers to as its enrollment target. CSU’s enrollment target in 2024‑25 is 390,598 resident FTE students. CSU does not track this target separately for undergraduates and graduate students.
State Sometimes Sets Enrollment Expectations for Budget Year Plus One. Historically, the state set an enrollment expectation for CSU in the budget year (for example, setting a 2016‑17 enrollment expectation in the 2016‑17 Budget Act). More recently, the state has set enrollment expectations for CSU in the budget year and budget year plus one. This change has reflected an effort by the state to better align its enrollment expectations with CSU’s admissions cycle. As CSU has already made many of its admission decisions for the coming academic year by the time the Legislature enacts the annual budget in June, setting budget‑year expectations can be too late to have a notable impact on CSU behavior. In contrast, setting an expectation for budget year plus one allows the state to have more influence over CSU actions for the next academic year. Setting enrollment expectations for budget year plus one, in turn, gives CSU campuses more time to adjust their enrollment management practices to meet any new enrollment expectations set for them.
State Funds Enrollment Growth According to Per‑Student Formula. Typically, the state supports resident enrollment growth at CSU by providing a General Fund augmentation based on the number of additional students CSU is to enroll. The per‑student funding rate is derived using a “marginal cost” formula. This formula estimates the cost of the additional faculty, support services, and other resources required to serve each additional student. Those costs are shared between state General Fund and student tuition revenue. In 2024‑25, the total marginal cost per student is $15,774, with a state share of $10,995. The formula calculates one rate that applies to all resident enrollment, whether at the undergraduate or graduate level. Whereas the state subsidizes the cost of educating resident students, nonresident students are charged a higher tuition rate that is intended to cover the full cost of their education.
CSU Also Offers Self‑Supported Courses. Like the other public higher education segments, CSU offers some self‑supported courses (also referred to as extended education or professional and continuing education). Self‑supported courses generally charge student fees intended to cover the full cost of offering them, without any state subsidy. Self‑supported course offerings include an array of academic courses, professional certificate programs, and personal enrichment courses offered throughout the year. In 2023‑24, CSU enrolled 22,100 FTE students in self‑supported courses. These students are not counted toward state enrollment targets.
Many Summer Courses Have Been Self‑Supported. All CSU campuses offer some academic courses during the summer. Historically, many campuses have chosen to offer these summer courses as self‑supported, while others have offered them as state‑supported. (Of the self‑supported FTE enrollment in 2023‑24, 40 percent was generated in the summer term.) Each campus sets its own fees for self‑supported summer courses. Based on a review of campus websites, these fees are different from but not consistently higher or lower than the tuition charged for comparable state‑supported courses. Students in both types of summer courses have opportunities to receive financial aid, but those opportunities tend to be greater for students in state‑supported courses.
Recent Trends
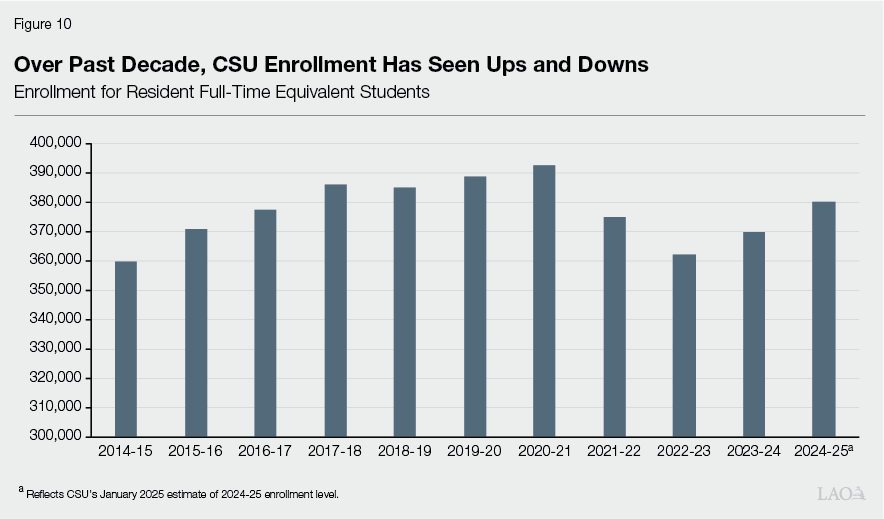
CSU’s Enrollment Is Rebounding From Pandemic Declines. As Figure 10 shows, CSU’s total resident enrollment was generally trending upward from 2014‑15 through 2020‑21. CSU then experienced notable declines in its resident enrollment in 2021‑22 and 2022‑23. In 2022‑23, CSU enrolled approximately 30,000 fewer resident FTE students than a couple of years earlier. CSU resident enrollment has been rebounding these past two years, though estimated resident enrollment in 2024‑25 remains nearly 13,000 FTE students below CSU’s 2020‑21 peak.
CSU Reports Exceeding Its 2024‑25 State Enrollment Expectation. Despite its enrollment being below its 2020‑21 peak, CSU reports that it is exceeding the state enrollment expectation set for it in the 2024‑25 Budget Act. The 2024‑25 Budget Act directed CSU to increase resident undergraduate enrollment by 6,338 FTE students, bringing its resident undergraduate enrollment level to 339,946 FTE students. This growth expectation is relative to CSU’s actual enrollment level in 2023‑24. CSU reports that it exceeded the 2024‑25 state budget expectation—growing by 9,326 FTE students, for total resident undergraduate FTE students of 342,935 resident undergraduate FTE students. When combined with postbaccalaureate and graduate enrollment, CSU estimates enrolling a total of 380,073 resident FTE students in 2024‑25—an increase of 10,166 students (2.7 percent) from the previous year.
Fall Headcount Increased for New Freshmen, Transfers, and Continuing Students. Though the 2024‑25 college year is still underway, CSU has fall 2024 headcount data broken down by certain student groups. Based on that data, the number of new resident freshmen enrolling at CSU increased 0.3 percent over the previous year, as Figure 11 shows. This is CSU’s largest incoming freshman cohort to date by a couple hundred students. New transfer students increased at a substantially higher rate (6.4 percent). This large increase comes after three years of declines in new transfer students (linked with declines in community college enrollment during the pandemic years). Though enrollment for new transfer students is higher than previous years, it is still 10 percent below pre‑pandemic levels. Figure 11 also shows the number of continuing undergraduates in fall 2024 increased 0.9 percent from the previous year. This is the first year that the number of continuing undergraduates has increased since the pandemic. The decline in retention rates seen during the pandemic may be reversing.
Figure 11
CSU Experienced Growth Among All Student Groups in Fall 2024
Resident Headcount, Fall Term
|
2022 |
2023 |
2024 |
Change from 2023 |
||
|
Amount |
Percent |
||||
|
Undergraduate |
|||||
|
New freshmen |
61,272 |
64,125 |
64,301 |
176 |
0.3% |
|
New transfer students |
48,006 |
47,613 |
50,641 |
3,028 |
6.4 |
|
Continuing students |
277,960 |
273,080 |
275,523 |
2,443 |
0.9 |
|
Subtotal |
(387,238) |
(384,818) |
(390,465) |
(5,647) |
(1.5%) |
|
Postbaccalaureate/Graduate |
46,420 |
45,194 |
47,028 |
1,834 |
4.1% |
|
Totals |
433,658 |
430,012 |
437,493 |
7,481 |
1.7% |
Some of Increase Is Due to Shifting More Students From Self‑ to State‑Supported Courses. As Figure 12 shows, state‑supported summer FTE students nearly doubled in 2023‑24 relative to the previous year. CSU explains the increase was due to campuses shifting certain summer courses from self‑ to state‑supported. That is, the increase in state‑supported students was largely offset by an accompanying decrease in self‑supported students. CSU indicates the courses shifted to state‑supported were generally academic courses that students took to make progress toward their degree. These include courses taken by continuing students as well as new students participating in summer transition programs. (Data is not available on the specific courses that were shifted or the number of FTE students enrolled in those courses.) Though not as pronounced, this trend continued in summer 2024, with campuses shifting more students from self‑ to state‑supported programs. While the number of self‑supported summer FTE students decreased by 9 percent, the number of state‑supported FTE students increased by 13 percent.
Figure 12
CSU Shifted More Students From Self‑ to State‑Supported Courses in Summer 2024
Summer Resident Full‑Time Equivalent (FTE) Studentsa
|
2022‑23 |
2023‑24 |
2024‑25 |
Change From 2023‑24 |
||
|
Amount |
Percent |
||||
|
State‑supported FTE students |
5,660 |
11,157 |
12,642 |
1,485 |
13% |
|
Self‑supported FTE students |
13,050 |
8,345 |
7,600 |
‑745 |
‑9 |
|
Totals |
18,710 |
19,502 |
20,242 |
740 |
4% |
|
aReflects annualized FTE resident students across all student levels. Summer is the first term of the college year. For example, summer 2024 enrollment counts towards 2024‑25. |
|||||
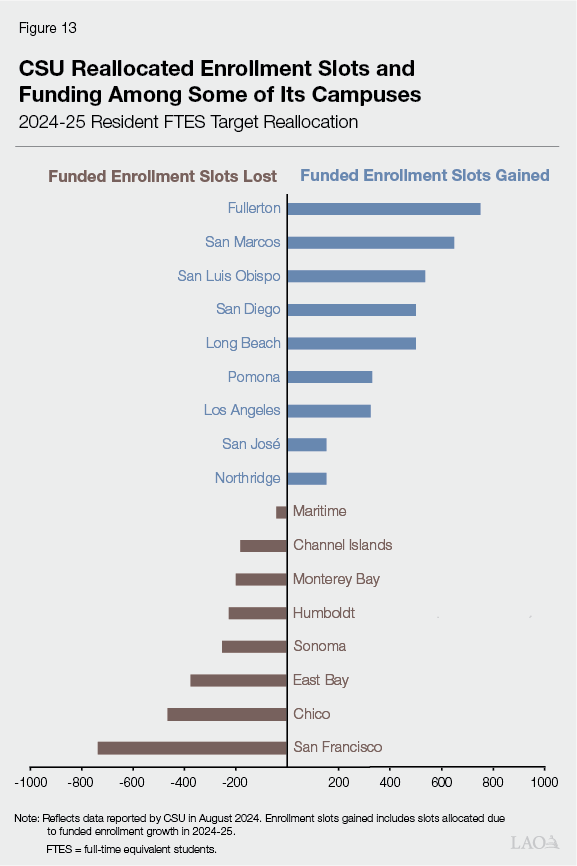
CSU Began Implementing an Enrollment Reallocation Plan in 2024‑25. CSU allocates its systemwide enrollment target and associated funding among its campuses. For the past several years, certain CSU campuses have been enrolling fewer students than their enrollment targets while other campuses have been enrolling students in excess of their targets. In response, CSU recently developed an enrollment reallocation plan. The plan entails CSU gradually shifting slots and associated funding away from those campuses notably below their targets to those campuses notably above their targets. Specifically, beginning in 2024‑25, CSU shifted a portion of funded slots away from eight campuses below their enrollment targets in 2023‑24 to nine campuses above their enrollment targets. Figure 13 shows how many funded enrollment slots were moved away from those campuses. It also shows the nine campuses that gained funded slots under the plan. CSU intends to continue implementing this plan in 2025‑26.
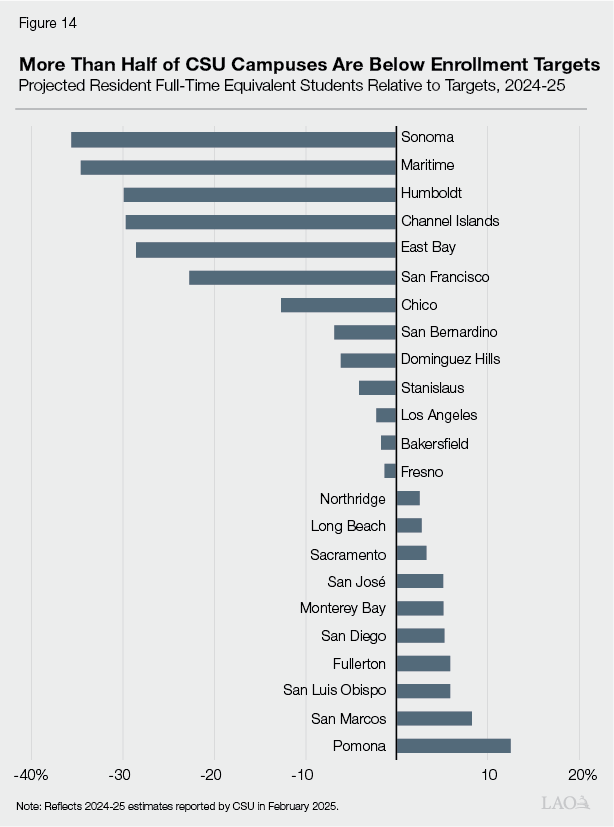
Despite Recent Enrollment Increases, Most Campuses Remain Below CSU’s Enrollment Targets. Whether a campus meets its enrollment target depends on several key factors, including the number of students who apply, admission rates, yield rates, retention rates, and other aspects of student and campus behavior. As Figure 14 shows, 13 campuses are projected to be below their enrollment targets set by CSU for 2024‑25. Six of these campuses would need to increase enrollment by more than 20 percent to reach their 2024‑25 targets.
Number of “Impacted” Programs Is Decreasing. Historically, some CSU campuses and academic programs have been designated as impacted, meaning they have more student demand than enrollment slots. To manage student demand, impacted campuses and programs adopt stricter admissions criteria than the minimum systemwide eligibility requirements. Campuses may apply the stricter admissions criteria to applicants outside their local service area and/or applicants within specific high‑demand programs. Currently, five CSU campuses (Fullerton, Long Beach, San Diego, San José, and San Luis Obispo) are impacted in all undergraduate programs. Other campuses tend to have at least a few programs impacted in 2024‑25. For example, many campuses are impacted in their Biological Sciences, Engineering, and Nursing programs. Though some programs remain impacted, eight campuses saw a decrease in the number of impacted programs in 2024‑25 compared to 2023‑24.
2025‑26 and 2026‑27 Enrollment Expectations
Budget Plan Sets Enrollment Expectations for Coming Years. The 2024‑25 Budget Act set a resident undergraduate enrollment expectation for CSU in 2025‑26 (following recent state practice of setting expectations for budget year plus one). The 2025‑26 budget plan maintains that expectation and adds an expectation for 2026‑27. Specifically, the budget plan sets forth that CSU is to grow its resident undergraduate enrollment by 10,161 FTE students, for a total associated level of 350,107 FTE students in 2025‑26. It also sets forth that CSU is to grow by another 10,161 FTE students in 2026‑27, for a total level of 360,268 FTE students. Though the budget plan does not contain any enrollment growth funding for CSU in 2025‑26, it maintains provisional language permitting the Director of Finance to reduce CSU funding for each student below the expected 2025‑26 level. The provisional language indicates the reduction would be taken at the 2025‑26 state marginal cost rate of $10,983.
Assessment
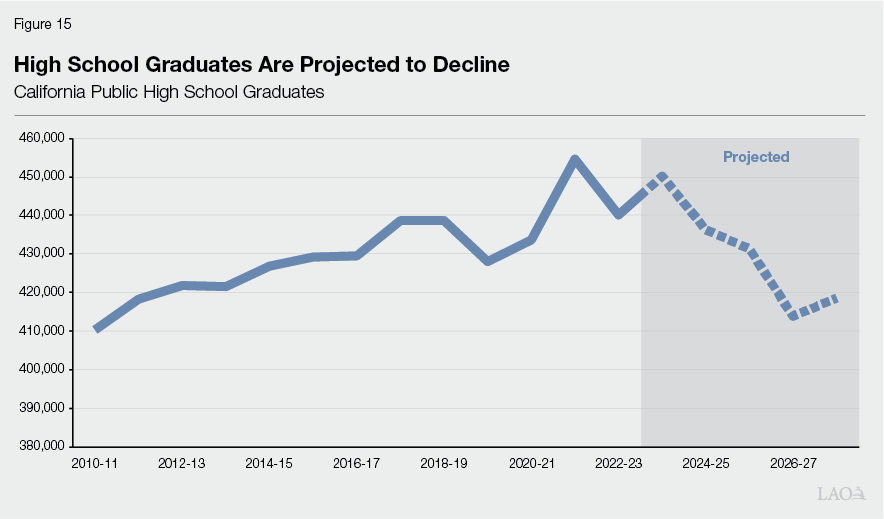
Countervailing Factors at Work in 2025‑26. Given CSU experienced enrollment growth in 2023‑24 and 2024‑25, it could see further growth in 2025‑26. The growth rate, however, might not be large due to certain countervailing factors. On the one hand, the administration projects that the number of high school graduates will decrease by 3 percent, leading potentially to a decrease in the incoming freshman class for fall 2025. On the other hand, recent upward trends in new transfer students and continuing students could persist into the budget year.
Demographic Trends Are Likely to Limit Growth in Out‑Years. Whereas CSU has seen increases in new freshmen over the past few years, demographic trends could limit this growth moving forward. Based on the most recent projections from Department of Finance, the number of high school graduates in California peaked in 2021‑22. As Figure 15 shows, the number of high school graduates is projected to decline by 17,689 students (4 percent) from 2024‑25 to 2027‑28. All else equal, this would translate to smaller new freshman cohorts in the out‑years. This demographic decline will not necessarily be offset by a higher share of high school graduates attending college. From 2017‑18 through 2021‑22 (the most recent data available), the percent of high school completers in California attending any college decreased from 68 to 62 percent.
Enrollment Growth Continues to be Overstated Due to Shift in Summer Courses. When the Legislature sets enrollment growth expectations for CSU in the state budget, it intends for CSU to add more students. Though CSU is reporting higher state‑supported enrollment in each of the past two years, part of these increases has come from shifting enrollment from self‑ to state‑supported courses rather than adding new enrollment. Though the number of students shifted from self‑ to state‑supported courses is smaller in 2024‑25 compared to 2023‑24 (745 FTE students shifted in summer 2024 compared to 4,705 FTE students shifted the previous summer), the effect is still not adding new students but adding new state costs from shifting students formerly in self‑supported courses into state‑supported ones.
Most CSU Campuses Are Already Meeting Student Demand. In the past, a key reason the Legislature has funded CSU enrollment growth was to expand access to eligible students who might otherwise not be admitted. This issue is less of a concern today. Over the past few years, admission rates have increased at nearly all CSU campuses. Sixteen campuses had freshman admission rates of 90 percent or higher in fall 2024, compared to only three campuses in fall 2019. Transfer admission rates have also increased over the past few years. In addition, fewer campuses and programs are impacted.
CSU’s Enrollment Reallocation Plan Is Realigning Funding With Actual Students Served. Though a majority of CSU campuses are currently below their enrollment targets, some campuses are exceeding their enrollment targets. In 2024‑25, CSU began addressing this situation by reallocating existing enrollment slots from campuses under their 2023‑24 targets to those exceeding their 2023‑24 targets. Effectively, this reallocation moved funding internally within the CSU system to help support more enrollment growth at growing campuses. Specifically, CSU moved funds from eight campuses below target to nine campuses above target. Seven out of the eight campuses furthest from meeting enrollment demand are located in Northern California, whereas eight out of the nine campuses with unmet enrollment demand are located in Southern California. If these nine campuses continue to see enrollment demand in the next couple of years, but do not receive additional funding to support enrollment growth, they likely will have to turn away more students.
Under Budget Plan, No Funding Is Earmarked for Enrollment Growth. As discussed in the “Core Operations” section, the state budget plan reduces General Fund support for CSU by a net of $122 million. No funding is provided to cover the marginal cost of new resident enrollment. CSU has expressed concern about continuing to increase its systemwide resident enrollment moving forward in the absence of additional state funding.
Recommendation
Hold CSU’s Resident Enrollment Target Flat for 2025‑26 and 2026‑27. Given the budget plan does not provide CSU with additional state General Fund support in 2025‑26 and the state is facing a projected budget deficit in 2026‑27, we recommend the Legislature hold CSU’s resident enrollment expectation flat at its existing 2024‑25 level for 2025‑26 and 2026‑27. Specifically, we recommend holding CSU’s total resident enrollment expectation at 380,073 FTE students for both of those coming years. If CSU were directed to enroll more students in the absence of associated funding, it would need to make further budget adjustments, including further spending reductions that, in turn, could begin to impact students. As mentioned in the “Core Operations” section, CSU is considering various budget adjustments, including hiring freezes, which could result in fewer course offerings and larger class sizes. Though CSU has experienced a decline in its FTE student‑to‑FTE employee ratio over the past several years (due to some enrollment declines coupled with more hiring), that trend is likely to reverse itself over the next two years given budget constraints. Importantly, though the state would not be providing systemwide enrollment growth under this recommendation, CSU’s plan to continue implementing its enrollment reallocation plan would shift additional enrollment slots within the CSU system to the subset of campuses that have been experiencing enrollment growth.
Capital Fellows
In this section, we discuss the Governor’s proposal to increase ongoing state support for the Capital Fellows program, which CSU’s Center for California Studies administers. We first provide background on the program and discuss the Governor’s proposal. We then provide an assessment of the proposal and offer a recommendation.
Background
Center for California Studies Is Funded Within CSU’s Budget. Apart from CSU’s main state General Fund appropriation, the state separately funds CSU’s Center for California Studies (the Center). The Center was founded in 1982. It is overseen by CSU Sacramento in concert with the CSU Chancellor’s Office. In 2024‑25, the Center received $5.6 million ongoing General Fund support. The Center has 12 authorized positions.
Center’s Primary Responsibility Is to Administer the Capital Fellows Program. The largest program the Center administers is the Capital Fellows program. This program accounts for $3.9 million (70 percent) of the Center’s ongoing state General Fund support.
Capital Fellows Program Is a Hands‑On Learning Experience for Those Interested in State Government. The core objective of the Capital Fellows program is to train young professionals for a career in public service within state government. The program consists of four fellowship opportunities: Assembly, Senate, Executive, and Judicial. Fellowships are structured similarly regardless of the branch of government. Each fellowship provides both experiential learning opportunities as well as career development and mentorship. Fellows work 10 months in the judicial branch, 10.5 months in the executive branch, and 11 months in the Assembly and Senate.
Fellows Must Meet Program Eligibility Requirements. To apply for the program, one must be at least 20 years old and have earned a bachelor’s degree. In addition, applicants must have a college grade point average of 2.5 or higher, an interest in state government and public policy, and be authorized to work in the United States. The majority of Fellows are coming straight out of an undergraduate program, though some have at least a few years of prior work experience. (Among its 2024‑25 cohort, the Center reports only 1.5 percent of Fellows held a master’s degree.) In fall 2024, the Center received 1,061 applications from 590 unique applicants for the 2025‑26 fellowship year. (Some candidates apply to more than one fellowship program.)
Funding for the Number of Fellows Increased in 2024‑25. For many years, the program funded 64 Fellows (18 Assembly, 18 Senate, 18 Executive, and 10 Judicial Fellows). In 2024‑25, the Center received a $330,000 ongoing General Fund augmentation to support an additional seven Assembly Fellows, raising the number of Assembly Fellows from 18 to 25. As a result, the Center currently has funding for a total of 71 Fellows.
Fellows Are Full‑time, Salaried Employees. Fellows receive paid, full‑time employment with a monthly salary of $3,253 ($39,036 annualized). Assembly, Senate, and Executive Fellows are based in Sacramento while Judicial Fellows are placed at superior courts across the state. All Fellows are paid the same salary, regardless of where they are based. Fellows also receive medical, dental and vision benefits; a $875 one‑time moving allowance; and student loan deferment.
Fellows Participate in Two Graduate Seminars During the Fellowship. In addition to their work responsibilities, Fellows are required to complete six units of graduate coursework. During their time in the fellowship, Fellows enroll in two courses taught in person at CSU Sacramento. The content of these courses is catered towards each specific fellowship program (Assembly, Senate, Executive, and Judicial). Upon completion of the two courses, Fellows receive a Certificate in Applied Policy and Government. The Center pays the tuition and fees for these seminars for all Fellows.
Capital Fellows Program Opens Doors Into State Government. The program’s competitive nature and high‑quality training makes Fellows upon completing the program sought‑after candidates for state government jobs. Participation in the fellowship program provides a level of exposure and prestige that helps Fellows in the next stage of their careers. The Center reports that for the 2023‑24 Capital Fellows cohort, 89 percent of the Assembly Fellows cohort and 83 percent of the Senate Fellows cohort continued working for the Legislature upon completion of the fellowship. More than half of Executive Fellows continued working for the executive branch and 30 percent of Judicial Fellows continued working for the judicial branch following completion of the fellowship.
Governor’s Proposal
Governor Proposes Increasing Salaries for Capital Fellows. The Governor’s budget includes a $1.3 million ongoing General Fund augmentation for the Capital Fellows program, bringing funding for the program up to $5.2 million. The augmentation is to provide a 50 percent salary increase for Fellows, bringing their monthly salary to $4,888 ($58,656 annualized). The Center shared that this request originally was tied to a new federal requirement, which has since been vacated. (Specifically, a federal regulation would have increased the salary threshold to be classified as salaried employees. Had the salary for Fellows not risen to the minimum level for salaried employees, Fellows would have become eligible for overtime, which is not the intent of the program.) Despite that federal requirement being rescinded, the Center indicates a salary increase is still warranted to help Fellows afford rising living costs as well as keep the fellowship program competitive with comparable programs in the state and country.
Assessment
Housing Costs in Sacramento Are Rising. Apart from the Judicial Fellows, all other Fellows are required to relocate to Sacramento (unless already living in the area). The Center has expressed concern that the current salary for Fellows is insufficient to cover housing and other living costs in Sacramento. From 2019 through 2023, the median gross rent in Sacramento County increased at an average annual rate of 7.5 percent. In 2023, the median gross rent in Sacramento County was $1,702. Though Fellows may be able to find less expensive rent and share housing, spending $1,000 per month on rent and utilities would equate to 31 percent of their paycheck. A household commonly is considered cost‑burdened if they spend more than 30 percent of their income on housing costs.
Salaries Are Not Adjusted for Inflation. Salaries for Fellows are not adjusted annually for increases in cost of living. Every time the Center wants to increase salaries, regardless of the amount, it must submit a new budget request to the state. The Center last raised salaries just a couple of years ago. In 2022‑23, the Center raised Fellows salaries by 9.75 percent, up to the current level of $3,253 per month. If adjusted annually based on the California Consumer Price Index (CA CPI), that monthly salary rate would be $3,447 in 2024‑25.
Candidates Have Expressed Concern Regarding Salary Amount. The Center shared with us that it does not have a problem with receiving applications, but it does face challenges in getting candidates to accept offers. The Center cites that one reason candidates decline offers is due to the salary amount. Some candidates have also expressed concern regarding the salary amount during the application process and have asked if there are other opportunities for employment during their time in the fellowship. However, the Center shared that it is difficult for fellows to work another job given the rigor and full‑time work required by the program.
Fellows May Receive Some Additional Financial Assistance. Though it is challenging for Fellows to work another job during their time in the program, they can apply for a small amount of additional financial assistance through the Timothy A. Hodson Capital Fellows Assistance Fund. The Fund was established in 2012 to provide need‑based financial support to Capital Fellows. In 2024, approximately $10,000 was granted to 23 Fellows to help cover living expenses, providing an average award of $500.
Comparable Fellowship Programs Have Higher Salaries. Though data is unavailable on what other programs candidates may choose instead of the Capital Fellows program, one reason driving their decision could be finding higher salaries elsewhere. For example, the San Francisco Fellows Program is also open to individuals with a bachelor’s degree and requires less than five years of work experience. Fellows spend 11.5 months working full‑time for the city and are paid a yearly salary of $69,000 to $107,000. Other fellowship programs in the state also pay more but require a master’s degree or past work experience.
Capital Fellows Intended to Reflect the Diversity of California. The Center shared that legislators and courthouse representatives expressed the importance of having Fellows represent districts across the state as well as reflect different lived experiences. However, the program’s current salary level may be limiting participation to those candidates who (1) effectively can supplement the program’s wages with other resources or savings to cover living expenses during their time in the program or (2) can continue to live at home (in Sacramento or near a courthouse). Moreover, some potential applicants, such as a primary caregiver, may be deterred from applying due to the current salary level. In these ways the current salary level could be narrowing the applicant pool, making it more challenging to find candidates that reflect the diversity of the state.
Recent Graduates Are Paid Higher Working Directly for a Capitol or District Office. Rather than participating in the Capital Fellows program, a candidate may seek to work directly for the state. A common entry‑level position is a Legislative Aide for a Capitol Office. Another entry‑level position is a District Representative for a District Office. These positions require a bachelor’s degree and legislative experience is preferred. The monthly salary range for both positions is $5,384 to $8,406 ($64,608 to $100,872 per year)—66 percent to 2.5 times more than the Capital Fellows program. However, unlike these positions, the fellowship program has non‑monetary benefits such as networking and experiential learning opportunities.
More Data Is Needed to Fully Analyze the Impact of Salaries on Program Demand. Though the Center is seeing trends in candidates declining program offers for other opportunities and applicants have expressed concerns regarding the salary amount, we do not have the data to conclude that the reason candidates are declining offers is due to the salary amount. Without data on why candidates declined the program and information on if they participated in another fellowship program, it is difficult to know if increasing salaries will lead to a meaningful increase in accepted offers.
Recommendation
Recommend Increasing Salaries by 10 Percent Instead of 50 Percent. Given all of the factors mentioned above, we recommend the Legislature raise salaries for Fellows by 10 percent. A 10 percent increase would raise salaries to $3,578 monthly ($42,936 annualized). This would help Fellows, some of the lowest‑paid state workers, afford the rising cost of living and potentially help to preserve an important pipeline into state government careers. Though a 10 percent increase is slightly above the current salary amount adjusted for the CA CPI, this increase is intended to also help make the program more accessible and keep the program competitive. Raising salaries to this level in 2025‑26 costs a total of $253,000 additional ongoing General Fund, or about $1 million less than the amount included in the Governor’s original budget proposal. As a result, this approach would also commit fewer ongoing General Fund resources at a time when the state is facing projected budget deficits.
Recommend Adjusting Annually for Inflation Thereafter. In addition to raising the salary level in 2025‑26, we recommend the Legislature adopt provisional language in the budget act authorizing an annual cost‑of‑living adjustment to begin in 2026‑27. We recommend using the CA CPI (All Urban Consumers) as the annual inflationary measure. Having such as annual adjustment would keep salaries at least commensurate with changes in living costs. Though the Center may still seek future increases to Fellows’ salaries to ensure the program remains competitive, the frequency of such requests likely would be significantly reduced.