Alex Bentz

August 14, 2025
Updating the California Necessities Index
Summary
Recent Developments Require Changes to the California Necessities Index (CNI). Due to recent changes by the Bureau of Labor Statistics (BLS), the CNI, which is based on changes in the prices of select essential goods and services and used to adjust certain payment rates, can no longer be calculated using the current formula. In this brief, we provide context on the changes and propose viable remedies that conform to the original intent of the index. Our recommendation would deviate only slightly from the existing measure while still reflecting changes in prices of the goods and services identified in the current index.
Background
CNI Aims to Measure Change in Cost of Basic Needs. The CNI is used to measure changes in the money required to purchase certain necessities in California. In contrast to other common price indices such as the Consumer Price Index (CPI), which calculates changes in the cost of all goods bought by broad groups of consumers, the CNI focuses on goods and services considered essential: food, apparel, rent, household fuels and other utilities, and transportation.
Used to Adjust Benefit Rates and Cost‑of‑Living Adjustments (COLAs). Statute ties various benefit and cost‑of‑living allowances to the CNI. For example, the California Department of Social Services uses the CNI to adjust payment rates for foster care providers. Similarly, COLAs for California Work Opportunity and Responsibility to Kids and Supplemental Security Income/State Supplementary Payment recipients, to the extent they are provided for in the state budget, are in part based on the CNI.
Based on Published CPI Statistics. The CNI formula is based on statistics published by the BLS using data from surveys of consumer spending. To calculate these statistics, the BLS collects data on a sample of goods and services bought by consumers across many urban areas. They then aggregate these data to determine how much a typical consumer spends on a certain amount of specific goods and services. They publish these statistics for the country and, in certain spending categories, for select metropolitan areas. In California, the BLS publishes data for the Los Angeles, San Francisco, San Diego, and Riverside metropolitan areas, which are all used in calculating the CNI.
Some Statistics Required for CNI Discontinued as of 2025. In early 2025, the BLS announced that it would no longer publish statistics for the household fuels and other utilities category for metropolitan areas (but not for the United States as a whole). No reason was given for this change; however, the BLS periodically reassesses the quality of each statistic they publish. As this category is in the CNI formula, this means that the CNI can no longer be calculated.
Discontinued Statistics Make Up Only Small Part of Index… The weights placed on each expenditure category making up the CNI are set in California statute, with each being chosen to represent the relative importance of each category in the overall cost of basic needs. The discontinued category—household fuels and other utilities—makes up about 7 percent of the total basket of necessities as of 2024. This means that changes in the prices of other categories—such as food (26 percent of the total)—have a much larger impact on the CNI than similar changes in the price of the discontinued category.
…But Are Historically More Volatile. While the weights placed on household fuels and other utilities are small relative to other categories, prices in that category tend to experience larger changes than other categories of goods and services. The prices for household fuels and other utilities increase by 5 percentage points in California in a typical year, similar to rent prices and higher than food, apparel, and transportation prices. However, household fuels and other utilities prices are more prone to large swings. It is not uncommon for household fuels and other utilities prices to increase by 8.2 percentage points or more, as they did in each year between 2020 and 2022. In fact, in one out of every five years, the category increased by more than 8.2 percentage points. It is also not uncommon for household fuels and other utilities prices to increase by only 1.4 percentage points—in one out of every five years, these prices increased by less than 1.4 percentage points. The difference between these changes is 6.8 percentage points (this is the difference between an 80th and 20th percentile change across years). In comparison, the difference in these typical changes is between 3 percentage points and 5 percentage points for food, apparel, and rent. The transportation category experiences more similar swings: the difference for that category is 6.6 percentage points.
Evaluating Alternatives
In order to continue to adjust benefit levels, the state will need to develop a new measurement of the cost of basic needs. This section lays out our criteria for assessing various alternatives.
Criteria
In our search for a replacement for the CNI, we first restrict our attention to options that meet two requirements.
Feasibility. First, new measures must be calculable using publicly available data that is published in a timely manner. Therefore, we do not consider approaches that would use proprietary data.
Transparency. Second, like the current formula, alternatives should provide an intuitive way to judge changes in the cost of necessities. This provides transparency to benefit recipients when they assess changes to the funds they receive.
Assessing Alternatives. After ensuring that the options we suggest meet the requirements above, we judge potential alternatives on several measures:
- Historical Similarity. First, the new measure should—to the extent feasible—minimize quantitative differences from the old measure. To assess this, we calculate each new measure using data from prior years and calculate the difference between each new measure and the CNI in prior years. To score well on this assessment, the average of the differences across years should be small. It is also important that these differences be symmetric: a new measure should minimize the extent to which changes are consistently higher or lower than the current CNI. Without this, the new measure could be historically similar to the CNI but lead to significantly higher or lower benefit levels over time.
- Fidelity to Original Concept. We assess each proposed measure on whether it adheres to the concept of the current formula. That is, we assess whether each option measures changes in the cost of purchasing necessities.
- Limited Future Changes. Finally, for each proposal, we consider whether there are likely to be future changes that affect the ability to calculate an index with the new formula. Statutory changes to formulas dictating benefit amounts are potentially disruptive to recipients. While future data availability cannot be fully predicted, certain statistics are statistically more reliable than others and are thus more likely to be available in the future.
Options Considered
Based on the criteria discussed above, we consider the following options for replacing the CNI.
Option A: Remove Discontinued Category, Keep Other Expenditure Weights the Same. The simplest option for replacing the CNI is to remove the discontinued statistics from its calculation, while not otherwise altering the formula.
Option B: Reassign Expenditure Weights to Most Similar Category Still Published. For this option, the new calculation would use the same set of statistics (excluding the discontinued statistics), but place additional weight on the remaining category that is most like the discontinued category: transportation.
Option C: Use National Estimate. This option maintains an estimate for the cost of household utilities and other fuels by using the national estimate for that category instead of a metropolitan area estimate.
Option D: Discontinue CNI, Replace With Other Published Series. Alternatively, the legislature could decide to retire the concept of the CNI, instead setting benefit rates based on other broader inflation measures calculated for Californians. We consider the most common price indices specific to California: the California Consumer Price Index for Urban Consumers (CA CPI‑U) and the California Consumer Price Index for Wage and Clerical Workers (CA CPI‑W). These indices are based on changes in prices for consumers in the state’s four largest metropolitan areas, with the California CPI‑W tracking prices of goods and services bought by wage earners in those areas.
Assessment of Alternatives
Historical Similarity
Figure 1 shows the average of the difference between each proposed measure and the CNI across each year since 1978. Overall, small changes to the calculation—as reflected in options A, B, and C—are more similar to the CNI than general indices. We discuss this assessment more below.
Figure 1
Average Historical Differences Between Proposed
Measures and Current CNI
|
Measure |
Average Historical Difference |
Percent of Years |
|
Option A: Remove discontinued category |
0.20 |
40% |
|
Option B: Reassign expenditure weights |
0.24 |
45 |
|
Option C: Use national estimate |
0.19 |
45 |
|
Option D: CA CPI‑U |
0.99 |
28 |
|
Option D: CA CPI‑W |
1.12 |
28 |
|
CNI = California Necessities Index; CA CPI‑U = California Consumer Price Index for |
||
General Indices Differ Substantially From CNI. Measures that deviate from the focus on necessities, as in the CA CPI‑U and CA CPI‑W in option D, are dissimilar from the CNI historically. Both the CA CPI‑U and CA CPI‑W differ from the CNI on average by about 1 percentage point, which is about 25 percent of average CNI growth.
In Many Years, Differences Are Large. Further, the difference between the CNI and the CA CPI‑U and CA CPI‑W is often large. Figure 2 shows differences between the proposed measures in each year since 1978. In about half of years, the CNI differed from the CA CPI‑U and the CA CPI‑W by at least 1 percentage point. Therefore, using the CA CPI‑U or CA CPI‑W to adjust payments would likely result in significantly different benefit increases in some years relative to the CNI.
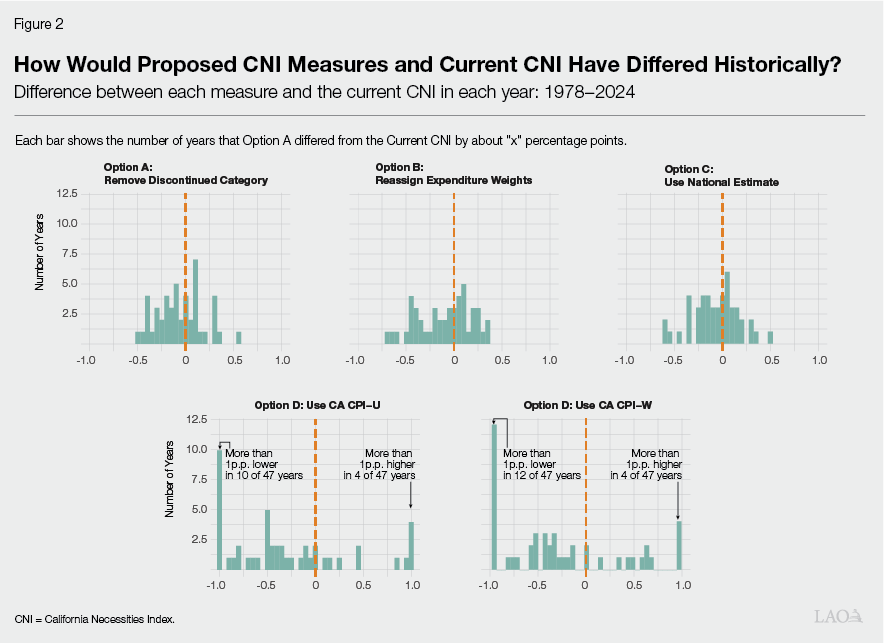
Small Tweaks to CNI Lead to Only Small Differences. In contrast, the other options we consider, which make only small tweaks to the current CNI formula are historically very similar to the current CNI. As shown in Figure 1, on average, these measures (options A, B, and C) are about 0.2 percentage points different from the current CNI. Further, large differences (more than 0.5 percentage points) are rare. Over short time periods (three years), year‑to‑year differences average out to changes very similar to the CNI (about 0.1 percentage points). This means that any differences would likely partially even out within three years, leaving benefit levels at a similar level to where they would be if the current CNI had been used.
Fidelity to Original Concept
Each Option Presents Trade‑Offs. None of the options perfectly align with the concept of the original CNI: to measure changes in the prices of select categories of essential goods and services in California. Adopting options A and B, which remove the household fuels and other utilities category altogether, would mean that any large changes in the prices of these goods would not be reflected in the CNI. On the other hand, adopting option C, which uses the national estimate for changes in the prices of household fuels and other utilities, would make it more likely that large changes in prices of household fuels and other utilities are reflected in the CNI, but may reflect changes happening at the national level, not in California. Finally, option D, which uses alternate inflation measures, does away with the concept of measuring changes in the prices of necessities, instead measuring changes in the prices of all goods bought by a broad set of consumers. This approach lacks nuance. For example, changes in the price of luxury cars factor in to changes in these general price indices but are not often considered a necessity. As such, Options A, B, and C likely are reasonable candidates, but present different trade‑offs.
Future Changes
Metropolitan Area Statistics Could Face Challenges. The BLS data collection process, which requires obtaining prices for a sample of goods bought by consumers across the country, makes it difficult to calculate reliable estimates for small categories of goods across many metropolitan areas. Therefore, any measure that requires statistics on the prices of a small set of goods in metropolitan areas—which includes options A, B, and C—may be at higher risk to future BLS publication changes. However, the remaining categories—food, apparel, transportation, and rent—include a much broader set of goods than the discontinued category. While we cannot predict the future publication decisions of the BLS, it will be easier for the statistical agencies to obtain reliable data on prices of goods in these categories than it will be for household fuels and other utilities, meaning it is more likely they will continue to publish these statistics.
Small Category Statistics Could Be Unreliable, Even at National Level. While it is easier for the BLS to estimate price changes for specific categories of goods at the national level, statistics for certain categories of goods and services could also be difficult to calculate reliably at the national level. In particular, the fact that the BLS has discontinued publishing statistics for the household fuels and other utilities category for metropolitan areas shows that they have found it difficult to collect a sufficient sample of prices in this category. It is possible that they could discontinue publication of these statistics at the national level, posing some risk for Option C.
Statistics on Prices of Broad Product Categories Are Most Reliable. Statistics that require obtaining representative price data for only broad categories of spending—such as all goods and services bought by a typical consumer—are likely to be the most reliable. Unlike the other options presented here, and the current CNI, option D does not rely on statistics on any specific spending categories. Instead, it uses only metropolitan area statistics on all goods and services purchased by a broad set of consumers. Therefore, the BLS will likely continue publishing the statistics required to calculate these statistics, making this option likely more robust to future publication decisions.
Recommendation
Rank of Options. To summarize, in Figure 3, we provide relative assessments of each option using our criteria, dividing them into “green” for the best measures on each criterion, “yellow” for measures where some deficiency is identified, and “red” for measures we judge to be significantly deficient. Options A, B, and C, which largely maintain the current CNI calculation, are all similar to the current CNI historically. By maintaining an estimate for household fuels and other utilities, option C has the most fidelity to the current CNI concept. Finally, option D, which does not use data on specific categories of goods, is likely the most immune from future publication changes. Option C faces the most risk because it relies not just on statistics for specific categories but also on a national estimate for a category for which the BLS has signaled difficulty obtaining reliable data; however, we believe that this risk is not significantly higher than for options A and B.
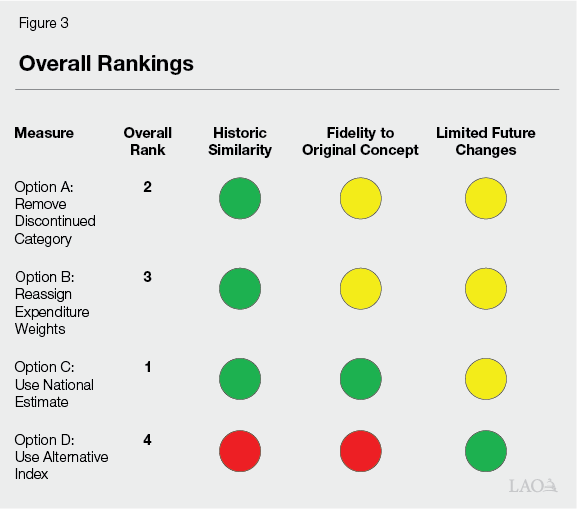
Recommend Using National Estimate for Discontinued Category. Overall, we think that option C, which uses a national estimate instead of metropolitan area estimates for the household fuels and other utilities category, is best able to replicate the current CNI. Figure 3 provides our overall ranking of each measure across the three criteria. Option C ranks best in both historic similarity and fidelity to the current concept. While it faces some risk from future publication decisions, these risks are similar to the risk for options A and B, which still require metropolitan area statistics on prices for specific spending categories. Option D, which reflects, in part, changes in prices of luxury goods and services, does not sufficiently capture the current CNI concept and is not historically similar enough.
Change Required For 2026‑27 Budget. Under current statute, the CNI required for the 2026‑27 budget will not be calculable based on published statistics. Given that expenditure estimates for the budget require use of the CNI, we recommend that the Legislature enact a replacement option in statute as part of the 2026 budget process.