Seth Kerstein

September 16, 2025
Local Sales Tax Rebates in 2023-24
Background
Bradley-Burns Tax Provides Funding for Cities and Counties. California’s sales tax rates vary across cities and counties, ranging from 7.25 percent to 11.25 percent. One percentage point of this rate, known as the Bradley-Burns tax, goes to local governments—primarily cities—for general purposes. Bradley-Burns revenue generally goes to the location a retailer designates as the “place of sale,” which can differ from where the product is actually delivered to the customer, such as often occurs with online purchases.
Local Governments Compete for Bradley-Burns Revenue. Local governments have a fiscal incentive to shift Bradley-Burns revenue into their jurisdictions. They can do this in two ways. The first way is encouraging retailers to locate within their borders. The second is encouraging retailers to shift the legally-defined place of sale without changing the location of any real economic activity.
E-commerce can enable this type of revenue shifting. As another example, consider a fuel supplier that makes advance sales of large amounts of fuel from a sales office. All Bradley-Burns revenue from this transaction would go to the city where the sales office is located. The physical transfer of fuel, however, could occur in other places throughout the state.
Some Local Governments Offer Sales Tax Rebates. One of the ways local governments compete for Bradley-Burns revenue is to offer partial sales tax rebates. For example, to encourage a retailer to set up shop in a city, the city could refund half of the Bradley-Burns tax paid by the retailer. If retailers respond strongly to these rebates, then cities providing them could end up with higher revenues. From a statewide standpoint, however, this redirection of revenues reduces funding for cities.
Over the years, the state has placed some limitations and disclosure requirements on these agreements. In 2019, the Governor vetoed SB 531 (Glazer), which would have enacted further restrictions. The veto message described these agreements as “an important local tool that captures additional economic activity, particularly in rural and inland California cities that continue to face significant economic challenges like high unemployment rates.”
2024 Law Requires Disclosure of Local Sales Tax Rebates. A new law, Chapter 842 of 2024 (AB 2854, Irwin), requires local governments to provide information on these agreements each year, starting with fiscal year 2023-24. We describe some key aspects of these rebates in the next section.
Description of Sales Tax Rebates
Statewide Total: $140 Million. In 2023-24, the Bradley-Burns tax raised $9.4 billion statewide. Of this amount, local governments paid roughly $140 million—1.5 percent—in rebates. This is:
$3.50 per California resident.
Similar to the amount of Bradley-Burns revenue for the City of Fresno.
Similar to the amount of tax credits allocated by California Competes, one of the state’s major economic development programs.
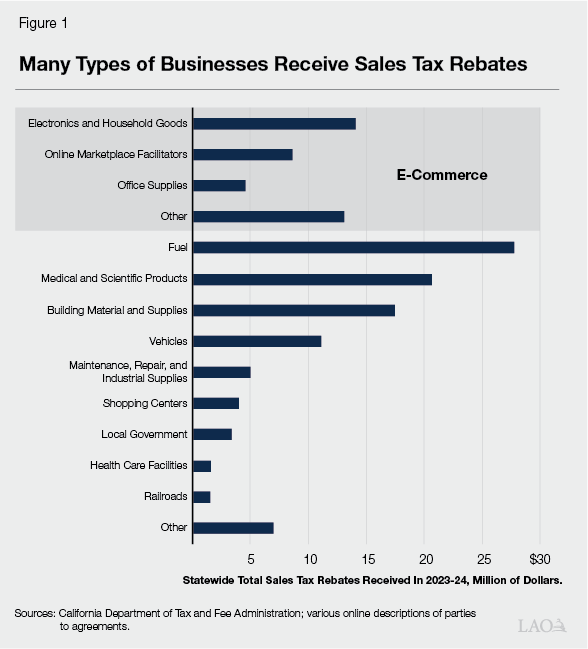
Largest Categories: E-Commerce and Fuel Suppliers. Figure 1 displays the amounts of rebates paid to various types of recipients. Broadly, the biggest category consists of e-commerce distribution centers. Fuel suppliers are another large category, accounting for 20 percent of the total.
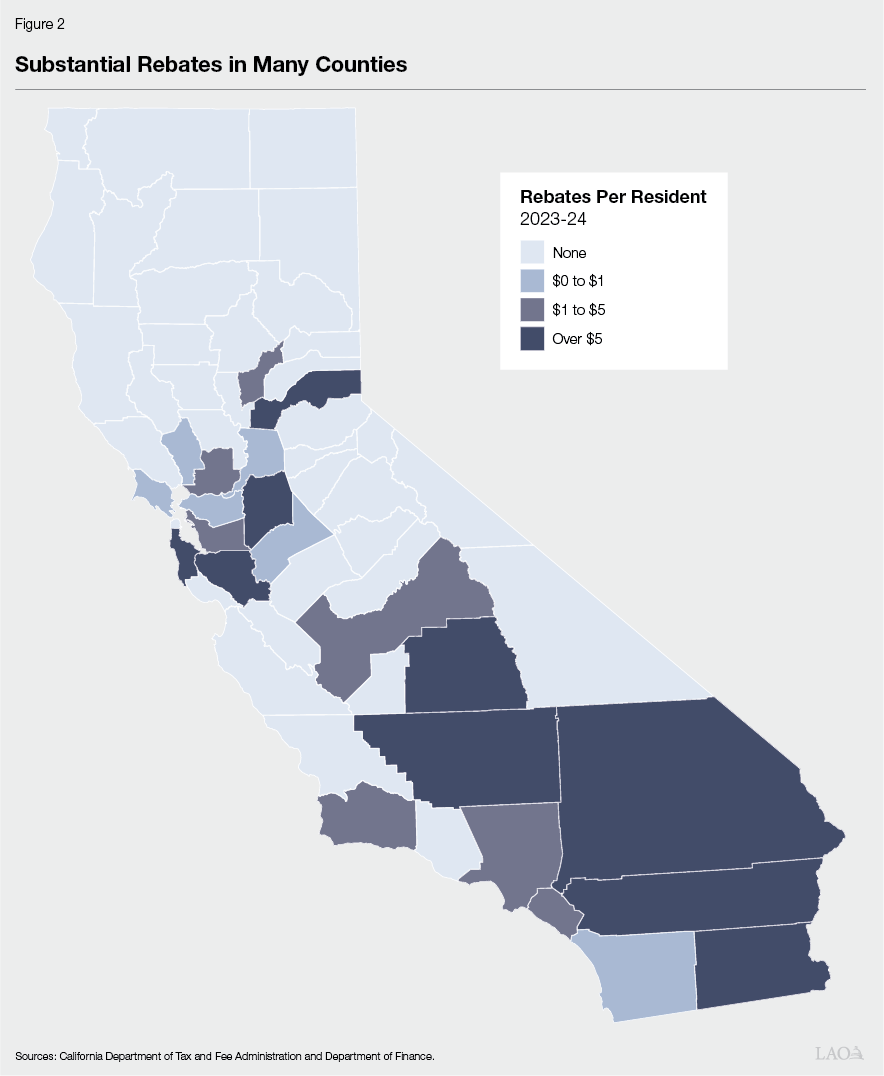
Substantial Rebates in Many Counties… As shown in Figure 2, 2023-24 rebate payments varied across counties. In nine counties, rebates exceeded $5 per resident. In seven others, rebates ranged from $1 to $5 per resident. At the other end of the spectrum, in many counties—mostly less populous counties outside of the state’s major metropolitan areas—no jurisdictions paid any rebates in 2023-24.
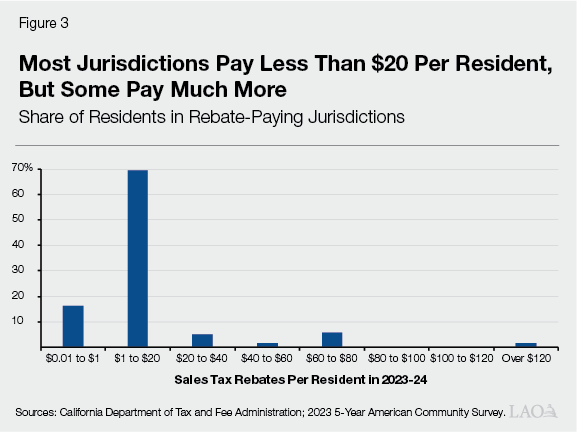
…But Largest Payments Concentrated in a Few Jurisdictions. One-quarter of Californians live in a jurisdiction that paid rebates in 2023-24. Focusing on these areas, Figure 3 displays the distribution of rebate payments across jurisdictions, weighted by the number of residents. One-sixth paid less than $1 per resident. Another two-thirds paid $1 to $20 per resident. One-eighth paid $20 to $80 per resident. A small but nontrivial portion—1.7 percent—paid more than $120 per resident.
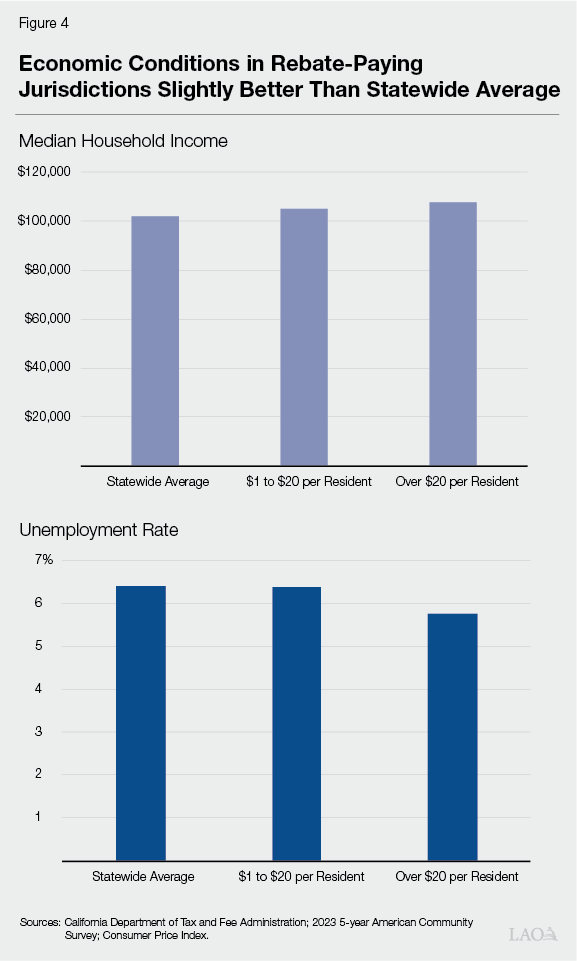
Economic Conditions in Rebate-Paying Jurisdictions Slightly Better Than Statewide Average. Next, we examine some economic and demographic features of two groups of jurisdictions: (1) those whose 2023-24 rebate payments totaled $1 to $20 per resident, and (2) those whose rebate payments totaled more than $20 per resident. Figure 4 compares these areas’ incomes and unemployment rates to the state as a whole. Median annual household incomes in rebate-paying jurisdictions are a bit higher than the statewide average. The average unemployment rate in jurisdictions that paid $1 to $20 per resident is very close to the statewide average. The average unemployment rate in jurisdictions that paid over $20 per resident is noticeably lower than the statewide average.
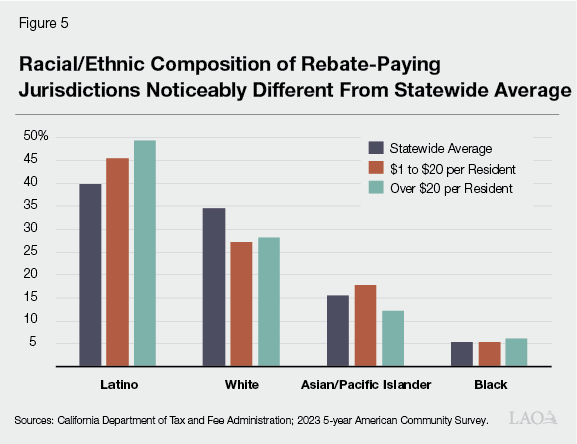
Racial/Ethnic Composition of Rebate-Paying Jurisdictions Noticeably Different From Statewide Average. Figure 5 shows that the racial and ethnic composition of rebate-paying jurisdictions is substantially different from other parts of the state. Jurisdictions that paid $1 to $20 per resident have substantially more Latino residents and fewer white residents than the state as a whole. When we look at jurisdictions that paid over $20 per resident, we see an even larger difference: half of residents in these places are Latino, compared to just 40 percent of the state as a whole. Comparing places that paid more than $20 per resident to those that paid less, the two groups have a similar share of white residents, but places in the higher-rebate group have fewer Asian/Pacific Islander residents.