Lisa Qing

December 10, 2025
Assessment of the Strong Workforce Program
Executive Summary
Career Technical Education (CTE) Is a Key Part of the Community Colleges’ Mission. CTE prepares students to work in a broad range of industry sectors, including information technology, business, and health. CTE accounts for nearly one‑third of instruction at the California Community Colleges (CCC). Like other community college instruction, CTE is primarily supported by general purpose apportionment funding. Several smaller state categorical programs and federal programs provide additional CTE funding. Those programs help address the higher instructional costs of CTE, which are due mainly to the need for specialized equipment and smaller class sizes.
A Decade Ago, State Created Strong Workforce Program (SWP) to Enhance CTE. In 2016‑17, the state created SWP to increase the availability and quality of CTE. Like other workforce development programs, SWP is linked to the broader state goal of preparing individuals for jobs, thus promoting their economic mobility while also providing a skilled workforce for industry. Under SWP, community college districts are grouped into eight regional consortia. Statute requires these consortia to develop regional workforce development plans in collaboration with other stakeholders. The state provides $290 million ongoing Proposition 98 General Fund for SWP (though it is redirecting $60 million of this amount to another purpose annually through 2028‑29). Of the annual amount, about 60 percent is allocated to local districts and about 40 percent is allocated to the regional consortia. Statute directs the CCC Chancellor’s Office to allocate both shares according to a formula that accounts for CTE enrollment levels, unemployment rates, projected job openings, and certain performance measures.
Program Implementation Varies Among Regions. Although all consortia are participating in regional planning, the extent of regional coordination varies by consortium. Five of the eight consortia designate a majority of their regional funds toward projects selected centrally, while the other three consortia pass the majority of their regional funds through to districts to make spending decisions locally. Nonetheless, administrators we spoke with at both types of consortia indicate that regional coordination has had some benefits. For example, it has made it easier for districts to combine funding for strategic purposes, including purchasing, marketing, curriculum development, and professional development.
Program Spending Has Generally Aligned With Program Objectives. SWP funds generally are supporting activities related to increasing CTE availability and quality. Common examples include hiring program faculty and staff as well as updating program equipment to align with industry needs. Districts and consortia are showing sufficient demand for SWP funding, allocating the majority of their funds toward specific purposes within one year of appropriation. Spending down these funds, however, typically takes a few years, with administrators often attributing this time line to the length of hiring, purchasing, and construction processes.
Chancellor’s Office Has Revisited Certain CTE Policies Under Program. The statute creating SWP directed the Chancellor’s Office to revisit certain systemwide policies related to CTE, with the goals of streamlining curriculum development and facilitating instructor hiring. In response, the Chancellor’s Office developed new regulations that delegate the approval of certain new curricula to local districts without additional state review. In addition, the Chancellor’s Office and the Academic Senate developed new guidance to help districts use a process called equivalency to hire industry professionals who would not otherwise meet minimum qualifications to teach at CCC. Despite these efforts, administrators and stakeholders suggest the lengthy curriculum development process and limited pool of instructors remain constraints to expanding CTE.
CTE Enrollment Has Increased Since Program Began. Since 2015‑16 (the year before SWP began), the estimated share of total CCC enrollment in CTE courses has increased from 27 percent to 31 percent. This reverses a historical trend in which CTE had been decreasing as a share of total enrollment for many years prior to SWP. One possible explanation is that the additional SWP funding has allowed colleges to expand high‑cost programs, as intended. The increase in CTE enrollment may also reflect other factors, however, such as a shift in student demand toward these programs.
CTE Awards Have Also Increased, but Likely Due to Other Factors. Since 2015‑16, the number of CCC students earning any CTE award has increased by 50 percent, with particularly rapid growth among certificates. The number of CCC students earning non‑CTE awards, however, has increased even faster. This suggests the increase in awards likely reflects factors beyond SWP, potentially including systemwide efforts to improve student outcomes as well as incentives for districts to confer more awards under the current CCC funding formula.
Impact of Program on Students’ Labor Market Outcomes Is Unclear. The Chancellor’s Office does not report on the employment rate of former CTE students. Instead, it reports on the percentage of former CTE students whose current job is related to their field of study. This data is collected through a survey to which only a small share of former CTE students respond. Better data is available on the earnings of former students who are now employed. A data sharing agreement with the Employment Development Department allows the Chancellor’s Office to report on students’ median annual earnings, their median change in earnings from before entering to after exiting college, and the percentage of students attaining a living wage. Since 2015‑16, all three of these earnings measures have improved for former CTE students. All three earnings measures have also improved at somewhat similar rates for non‑CTE students, however, suggesting these improvements are likely due to labor market dynamics beyond SWP.
Broader Workforce Coordination Issues Remain. Although the state is making some progress toward SWP’s objectives, its experience with the program raises a few issues related to workforce coordination more broadly. First, SWP is one of several workforce development programs that involve regional planning. These programs are using different sets of regions to meet similar planning requirements, resulting in inefficiency and fragmentation. Second, community colleges and local workforce development boards are undertaking similar activities related to employer engagement and labor market research, leading to duplication of effort. Third, the use of different performance measures in different workforce development programs hampers the state’s ability to monitor effectiveness across those programs. The Legislature could consider various actions extending beyond the scope of SWP to address these issues, including adopting a unified set of regions for planning, clarifying the respective roles of the community college system and the workforce development boards, and aligning performance measures across workforce development programs.
Introduction
In 2016‑17, the state created the Strong Workforce Program (SWP) to increase the availability and quality of career technical education (CTE) at the California Community Colleges (CCC). Like other workforce development programs, SWP is broadly intended to prepare individuals for higher‑paying jobs, thus promoting their economic mobility while also providing a skilled workforce for employers. As the program nears its tenth year, this report provides an assessment of its progress toward meeting its objectives. We begin by providing background on CTE and SWP. We then analyze SWP implementation and outcomes. We conclude by raising a few issues for the Legislature to consider relating to workforce coordination more broadly. (This report focuses on the community college component of SWP. We discuss the K‑12 component in a separate brief, Overview of K‑12 Career Technical Education.)
Background
In this section, we first provide background on community college CTE programs and funding sources, then describe the key components of SWP.
Career Technical Education
CTE Is a Key Part of the Community Colleges’ Mission. The CCC system consists of 115 community colleges operated by 72 locally governed districts, plus one statewide online college overseen by the system’s Board of Governors. Under state law, the system’s primary mission is to provide academic and CTE instruction at the lower‑division undergraduate level. CTE accounts for about 30 percent of instruction across the CCC system, based on the estimated number of full‑time equivalent (FTE) students. Like most other community college instruction, the majority of CTE instruction is offered for credit. About 5 percent of CTE instruction is noncredit, typically consisting of short‑term programs at the precollegiate level.
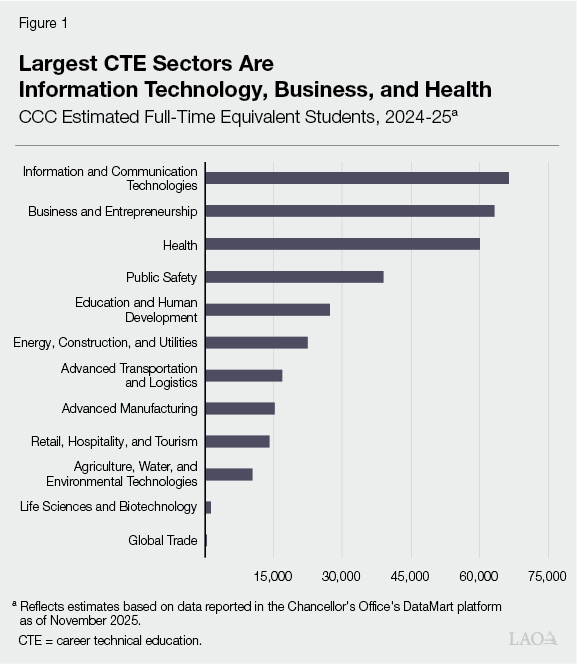
CTE Courses Span a Broad Range of Industry Sectors. The CCC Chancellor’s Office has organized CTE into 12 industry sectors. As Figure 1 shows, the largest sectors by enrollment are information and communication technologies, business and entrepreneurship, and health. These three sectors together account for more than half of total CTE instruction.
Community Colleges Award CTE Certificates and Degrees. Like other community college programs, CTE programs typically lead to either certificates or associate degrees. Community colleges offer CTE certificates in many areas, with just a few examples being accounting, computer networking, and medical assisting. CTE certificates generally focus on occupational skills, and they require anywhere from a few months to more than one year of full‑time study. By comparison, CTE associate degrees include both occupational skills and general education, and they typically entail two years of full‑time study. Since 2015, state law has also authorized CCC to offer bachelor’s degrees if those programs do not duplicate programs offered by the California State University or the University of California. CCC has since launched bachelor’s degrees in fields such as dental hygiene, emergency management, and biomanufacturing. In total, CTE accounts for about 45 percent of certificates, about 30 percent of associate degrees, and all bachelor’s degrees awarded by CCC.
State Primarily Supports CTE Through Apportionments. Community colleges receive the bulk of funding for their core operations through apportionments. The state pays for apportionments using Proposition 98 funding, which consists of state General Fund and local property tax revenue. Since 2018‑19, the state has allocated apportionments to districts using the Student Centered Funding Formula (SCFF). Under SCFF, districts generate funding based on their enrollment, their low‑income student counts, and certain student outcomes (such as the number of students completing a certificate or degree). We estimate CTE instruction generates about $3 billion in apportionments annually. This represents nearly 90 percent of Proposition 98 funding for CTE, as Figure 2 shows. While districts generally have broad discretion over apportionment spending, a state requirement known as the “50 percent law” specifies that at least half of these funds must go toward the salaries and benefits of classroom instructors.
Figure 2
Several State Programs Support Community College CTE
Ongoing Proposition 98 Funding (In Millions), 2025‑26
|
Program |
Description |
Funding |
|
Apportionments |
Provides general purpose funding to community college districts. Amount reflects estimated share of funding generated by CTE programs. |
$3,003a |
|
CCC Strong Workforce Program |
Provides funding to community college districts and regional consortia to increase the availability and quality of CTE programs. |
290b |
|
CCC Apprenticeships |
Supports the classroom instruction component of existing apprenticeship programs, as well as grants to support the launch of new apprenticeship programs in nontraditional sectors. |
66c |
|
Economic and Workforce Development Program |
Provides funding primarily for regional coordination around CTE programs, employer engagement, and labor market research. |
23 |
|
California Adult Education Program |
Provides funding for precollegiate education. Amount reflects estimated share of program funding spent on noncredit CTE programs at CCC. |
16d |
|
Calbright College |
Provides short‑term, competency‑based online programs for working adults. |
15 |
|
Nursing Program Support |
Funds enrollment growth and student support in community college nursing programs. |
13 |
|
Total |
$3,427 |
|
|
aAmount assumes 30 percent of apportionment funding is generated by CTE, reflecting the approximate share of instruction that is classified as CTE. bOf this amount, $60 million annually through 2028‑29 is designated for a nursing initiative. Amount excludes $164 million ongoing for the K‑12 Strong Workforce Program. cAmount excludes $62 million ongoing for apprenticeships affiliated with K‑12 local education agencies. dAmount assumes 12 percent of program funding goes to CCC based on historical trends, and CCC in turn spends 20 percent of those funds on CTE courses based on the approximate share of noncredit instruction that is classified as CTE. |
||
|
CTE = career technical education. |
||
State Also Funds Several CTE Categorical Programs. The largest of these programs is SWP, which we describe further in the next section. Another notable categorical program is the Economic and Workforce Development (EWD) program, which primarily supports regional coordination, employer engagement, and labor market research activities. Other categorical programs fund specific types of CTE programs, including apprenticeships (programs that combine paid on‑the‑job training with related classroom instruction), noncredit programs, online programs, and nursing programs.
Federal Perkins Funding Supports CTE. In addition to state funding, CCC receives federal funding for CTE through the Strengthening Career and Technical Education for the 21st Century Act (Perkins V). In 2025‑26, CCC is receiving $74 million in Perkins V funds. Of this amount, $65 million is for local CTE program costs. The Chancellor’s Office allocates these funds across all local community college districts according to their count of CTE students who are economically disadvantaged. (Under the Perkins V program, students are typically identified as economically disadvantaged based on their receipt of need‑based financial aid or other public assistance.) An additional $7.1 million supports state leadership activities to improve CTE, including regional coordination. The remaining $2.6 million supports state‑level program administration.
Federal Workforce Innovation and Opportunity Act (WIOA) Sets Planning Requirements. In California, WIOA is administered primarily by the California Workforce Development Board and 45 local workforce development boards. Under WIOA and associated state law, each of these boards is required to have representation from industry, labor, and education, with more than half of the members on each board coming from industry. The state board, the local boards, and 15 regional planning units comprised of local boards are each required once every four years to develop an overarching strategic plan for preparing a skilled workforce. These plans are required to set performance goals using specific measures related to participants’ skill gains, certificate or degree attainment, employment, earnings, and retention with the same employer. Beyond setting these planning requirements, WIOA provides funding for various workforce‑related programs. In 2023‑24, 18 CCC districts reported receiving $8 million in WIOA funds, though much of this funding was likely for instruction in basic skills (such as English language and literacy) rather than CTE.
Strong Workforce Program
CCC Convened Task Force to Examine Ways to Improve CTE. In 2014, the CCC Board of Governors convened the Task Force on Workforce, Job Creation, and a Strong Economy—commonly known as the “Strong Workforce Task Force”—to examine ways to produce more industry‑valued certificates and degrees. The task force consisted of 26 members representing CCC and its external stakeholders, including workforce agencies, industry, and labor. The task force developed a series of recommendations for improving CTE in several key areas, including funding, regional coordination, outcomes data, curriculum, and faculty. In fall 2015, the Board of Governors adopted the task force’s recommendations and requested a $200 million ongoing systemwide augmentation to implement them.
State Created New Program to Expand CTE Availability and Quality. The 2016‑17 state budget funded the Board of Governors’ request, providing $200 million ongoing Proposition 98 General Fund to create SWP. Subsequent augmentations have brought the program funding level to $290 million ongoing. (Of this amount, $60 million is currently being redirected to a nursing initiative, as we discuss in the box below.) The program’s statutory objective is “expanding the availability of high‑quality, industry‑valued career technical education and workforce development courses, programs, pathways, credentials, certificates, and degrees.” This objective is commonly summarized as providing “more and better” CTE. Statute links this objective to the broader goal of preparing individuals for jobs, thus promoting their economic mobility while also providing a skilled workforce for industry.
Rebuilding Nursing Infrastructure Grant Program
Recent Redirection of Strong Workforce Funds Is Likely Impacting Programs. The 2024‑25 budget redirected $60 million from the Strong Workforce Program (SWP) toward the Rebuilding Nursing Infrastructure Grant Program, a new initiative that awards competitive grants to districts to develop or expand nursing programs. The redirection is to occur for five years, effectively reducing the annual SWP funding level from $290 million to $230 million through 2028‑29. The state took this budget action based on data showing that districts and consortia had a large amount of unspent funding from previous years. Since then, more detailed data has become available showing that districts and consortia had already allocated much of that funding toward specific purposes—suggesting there was demand for the higher funding level. Accordingly, some administrators indicate the redirection of SWP funds toward the nursing initiative is having negative impacts on other career technical education programs, such as by leaving less funding available to develop new programs or update program equipment.
Program Is Intended to Address High Cost of CTE Instruction. One key issue the Strong Workforce Task Force identified was that CTE programs tend to have relatively high instructional costs. These costs are largely driven by a need for specialized equipment and facilities as well as smaller class sizes. The task force believed that colleges had a disincentive to expand these programs because they received the same per‑student apportionment funding rate as lower‑cost programs. SWP was intended to help address this disincentive by providing categorical funding to expand CTE.
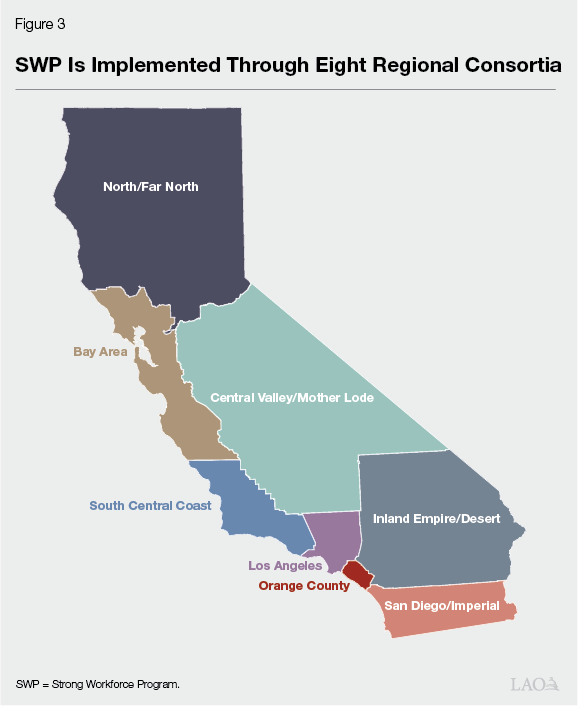
Program Emphasizes Regional Coordination. As a condition of receiving SWP funds, community college districts are required to participate in regional consortia. Statute specifies that the SWP regional consortia are to align to the extent possible with the WIOA regional planning units and expand upon existing CCC consortium infrastructure. The Chancellor’s Office has chosen to implement SWP using a set of existing consortia it created in the 1990s to review new CTE program curricula. Figure 3 shows these eight consortia. Beyond SWP funding, these consortia receive EWD funding. In 2025‑26, EWD is providing the consortia with $12 million ongoing Proposition 98 General Fund to support employer engagement activities. EWD also is providing $7 million ongoing Proposition 98 General Fund for labor market research centers intended to support consortia planning and other CTE activities. Additionally, the consortia are receiving $2.6 million in federal Perkins V funding for their general operations.
Program Has Certain Planning Requirements. Statute requires each SWP consortium to develop a four‑year plan. The plan is to include various components, including the consortium’s governance model, an analysis of regional labor market needs, an inventory of regional and local spending priorities, measurable regional goals, and a description of how the plan aligns with other regional workforce development plans (such as WIOA plans). Each consortium is to collaborate on planning with external stakeholders, including local workforce development boards, industry, and labor representatives. The plan is to be updated annually, allowing the consortia to monitor changes in their regional labor market (such as job growth within specific sectors) and adjust their spending priorities accordingly.
Funding Consists of a Local Share and a Regional Share. Under statute, the annual appropriations for SWP are divided into two main shares—a local share comprising 60 percent of the funds and a regional share comprising 40 percent. (Before calculating these shares, the Chancellor’s Office may set aside up to 5 percent of total SWP funds for systemwide activities.) The local share is allocated directly to districts, while the regional share is allocated to the eight SWP consortia. Both shares are to be used for purposes that align with program objectives and meet the needs of local and regional economies, as identified in regional plans. Beyond this, districts and consortia have broad discretion over how to spend the funds.
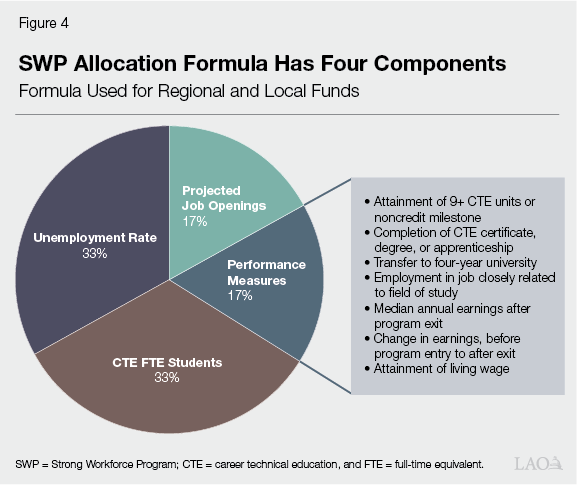
Statute Creates Formula for Allocating Local and Regional Shares. The Chancellor’s Office must allocate both shares according to a four‑part formula, as Figure 4 shows. Under this formula, a district or consortium receives more funding if it has more CTE students, a higher unemployment rate (suggesting more training demand from job seekers), more projected job openings, and better outcomes. Statute specifies that outcomes are to be assessed using the WIOA performance measures. The Chancellor’s Office, however, is using a somewhat different set of performance measures it selected with input from a committee of CCC representatives. As Figure 4 shows, these measures include a mix of academic and labor market outcomes. Districts and consortia receive a certain number of points for each student who attains these outcomes, with points generally doubled if the student is economically disadvantaged (as defined under the Perkins V program). Certain outcomes related to students’ employment and earnings reflect the program’s broader goal of preparing individuals for higher‑paying jobs.
Statute Directs Chancellor’s Office to Expedite Curriculum Approval. The legislation creating SWP required the Chancellor’s Office to develop and implement various policies to improve CTE—including a plan to streamline curriculum approval. The CCC curriculum approval process is established in systemwide regulations and guidance. At the time SWP was created, the process involved many steps at the local, regional, and state levels. Each new CTE course or program had to be reviewed by the district’s curriculum committee and governing board, the regional consortium, and finally the Chancellor’s Office. (The process was similar for non‑CTE courses and programs, except that these did not require review by the regional consortium.) The Strong Workforce Task Force believed this process could be slowing the development of CTE programs, making it harder for colleges to keep pace with changing industry needs.
Statute Also Directs Chancellor’s Office to Eliminate Barriers to Hiring Instructors. The legislation creating SWP also required the Chancellor’s Office to develop policies that eliminate barriers to hiring CTE instructors, including by reevaluating the minimum qualifications for those positions. In general, to be hired as a CCC instructor, an individual must meet certain systemwide minimum qualifications or other criteria that their district approves through a local process known as “equivalency.” The Chancellor’s Office developed and periodically updates the minimum qualifications based on recommendations from the Academic Senate of the California Community Colleges. At the time SWP was created, the minimum qualifications for many CTE disciplines were either a bachelor’s degree and two years of professional experience or an associate degree and six years of professional experience. Certain CTE disciplines, such as business and nursing, required a master’s degree. The Strong Workforce Task Force believed these requirements might be limiting the pool of industry professionals who could serve as CTE instructors.
Assessment
In this section, we analyze how well SWP is meeting its objectives of increasing the availability and quality of CTE. First, we examine whether program implementation has been consistent with these objectives. Then, we review program outcomes, with a focus on trends at CCC over the past decade in CTE student enrollment, award completions, employment, and earnings.
Program Implementation
Regional Consortia Are Mostly Meeting Planning Requirements. Under SWP, all eight consortia have developed four‑year regional plans. As of this writing, five consortia have updated their plan within the past year, while the other three most recently updated their plan between one and two years ago. Although the plans vary in content, they generally cover most of the key components required under statute. One common exception is that many plans do not identify projects supported by the local share, as these spending decisions are typically made by districts without the consortium’s involvement.
Extent of Coordination Varies Across Regions. Of the eight consortia, five designate a majority of their SWP regional share toward projects selected centrally by the consortium. The other three consortia (Bay Area, North/Far North, and South Central Coast) designate only a small percentage of their regional share toward such projects. These three consortia allocate the majority of their regional share to their member community college districts, with the districts deciding locally how to spend these funds. On the one hand, this latter approach does not promote as much strategic planning and regional coordination—key components of the SWP program. On the other hand, CCC administrators in these three regions indicate their decentralized approach provides more flexibility for their districts to address local priorities, which can be particularly helpful given their regions are geographically dispersed or have distinct sub‑regional economies.
CCC Administrators Indicate Some Benefits to Regional Coordination. Based on conversations with both consortium and district administrators, regional coordination under SWP has had benefits. Anecdotally, it has allowed districts to combine their resources for various purposes, including equipment and software purchases, marketing campaigns, curriculum development, and professional development. Some administrators also indicate that consortia have become more effective at reviewing new program curricula under SWP, potentially helping reduce unnecessary program duplication across colleges. Data quantifying these benefits, however, is not available.
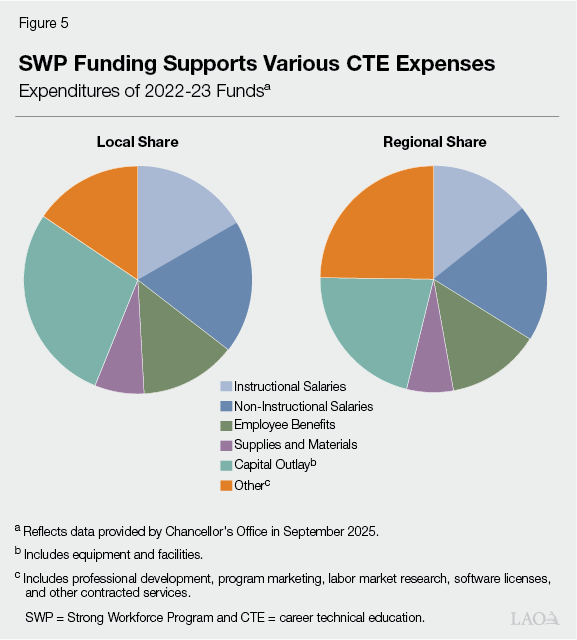
Use of Funds Is Broadly Consistent With Program Objectives. Based on our review of regional plans and spending data, SWP funds generally are supporting activities related to increasing the availability and quality of CTE. As Figure 5 shows, the regional and local shares support a range of expenses. Nearly half of both shares go toward employee compensation, which includes salaries and benefits for CTE instructors as well as a broad range of non‑instructional positions such as CTE deans and career services staff. (One reason the share going toward instructional salaries is not larger is that the 50 percent law leads districts to cover these costs primarily using apportionments rather than categorical funds.) Beyond employee compensation, the next largest expense type for the local share is capital outlay, which typically consists of purchasing equipment and renovating applied learning spaces. For the regional share, a notable amount of funding goes toward “other” expenses, common examples of which include professional development, program marketing, labor market research, software licenses, and other contracted services.
Districts and Consortia Are Showing Sufficient Demand for Funding. Based on data from the Chancellor’s Office, districts and consortia allocate the majority of their SWP funds toward specific purposes within one year. For example, 94 percent of 2024‑25 SWP funds had been allocated toward specific purposes by June 30, 2025. Spending down the funds takes longer, however—typically two or three years. Administrators indicate this is because SWP spending often involves lengthy purchasing, construction, or hiring processes after allocation decisions have been made. As a result, a large amount of SWP funding that has been allocated toward specific purposes (often in the few hundreds of millions of dollars) is not yet spent at any given time. Because there are planned uses for these funds, redirecting them has programmatic impacts. This is likely occurring with the recent redirection of SWP funds toward a new nursing initiative, as we discuss in the box above.
Curriculum Approval Process Has Been Streamlined, but Still Takes Time. In response to the statutory requirement to streamline curriculum approval, the Chancellor’s Office has developed new regulations. These regulations delegate the review of all new courses and many new programs to local governing boards, without requiring additional state review from the Chancellor’s Office. (As before, new CTE programs still need to be reviewed by their regional consortium.) To qualify for this streamlined process, new CTE programs must meet certain criteria, including having their courses aligned with a common course numbering system. CTE programs that do not meet these criteria for streamlined approval still require state review, though this step may occur faster than before because of the overall reduction in curriculum review workload at the Chancellor’s Office. Despite this new process, CCC administrators indicate it still commonly takes 18 months or more to develop a new CTE program. Based on conversations with CCC administrators and external stakeholders, there is still a common perception among industry that this process moves slowly relative to changes in employer demand.
Hiring Instructors Likely Remains a Barrier to CTE Expansion. In response to the statutory requirement to eliminate barriers to hiring CTE instructors, the Chancellor’s Office and the Academic Senate established a work group on minimum qualifications. Although the work group did not recommend notable changes to minimum qualifications, it did develop new guidance to help districts use the existing equivalency process. This guidance is intended to facilitate the hiring of industry professionals who do not have certain academic degrees but have demonstrated equivalent skills through work experience. Data is not available on whether the use of equivalency has increased since this guidance was issued. Based on conversations with CCC administrators, hiring instructors remains a key constraint to expanding CTE. In addition to finding instructors who meet minimum qualifications, administrators cited barriers related to providing competitive pay, particularly in fields where individuals can earn much higher salaries working in industry than teaching.
Program Outcomes
In Break From Earlier Trend, CTE Is Increasing as Share of Total Enrollment. Figure 6 shows CTE as a percentage of total estimated CCC FTE students since 1992‑93, the earliest year for which the Chancellor’s Office reports this data. For nearly 25 years prior to the creation of SWP, CTE had generally been decreasing as a share of total enrollment. As Figure 6 shows, this trend has since reversed. From 2015‑16 (the year before SWP began) to 2024‑25, CTE as a share of total enrollment increased from 27 percent to 31 percent.

CTE Enrollment Increases Could Be Due to SWP or Other Factors. One possible reason that CTE is increasing as a share of enrollment is that SWP funding has helped overcome the disincentive for colleges to expand high‑cost programs, as intended. The trend may also reflect other factors, however, such as a shift in student demand toward CTE programs. One sign that other factors may be involved is that CTE enrollment is also increasing as a share of total enrollment in other states. Based on the most recent National Student Clearinghouse fall enrollment report, we estimate the percentage of community college students majoring in CTE programs nationally increased from 47 percent in fall 2019 to 49 percent in fall 2024.
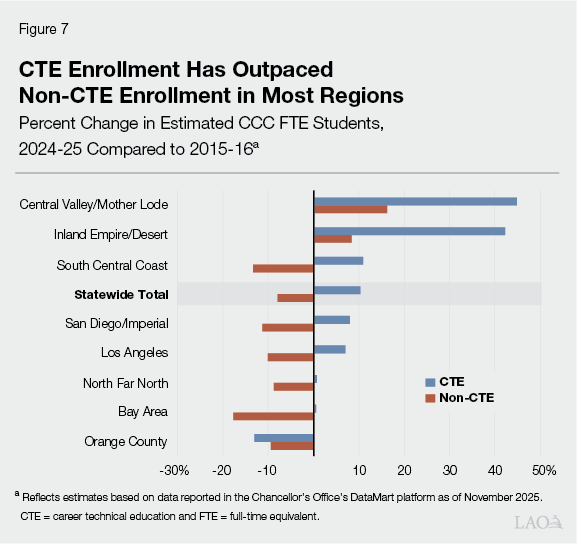
CTE Enrollment Is Up in Most Regions. Over the past decade, the estimated number of FTE students enrolled in CTE increased notably in five of the eight SWP regions, as Figure 7 shows. Meanwhile, CTE enrollment was about flat in two regions and declined in one region. During this period, the Central Valley/Mother Lode and the Inland Empire/Desert regions had by far the fastest rates of CTE enrollment growth. These two regions also had the most robust non‑CTE enrollment trends, likely reflecting broader demographic growth. In all but one region (Orange County), CTE enrollment outpaced non‑CTE enrollment during the period.
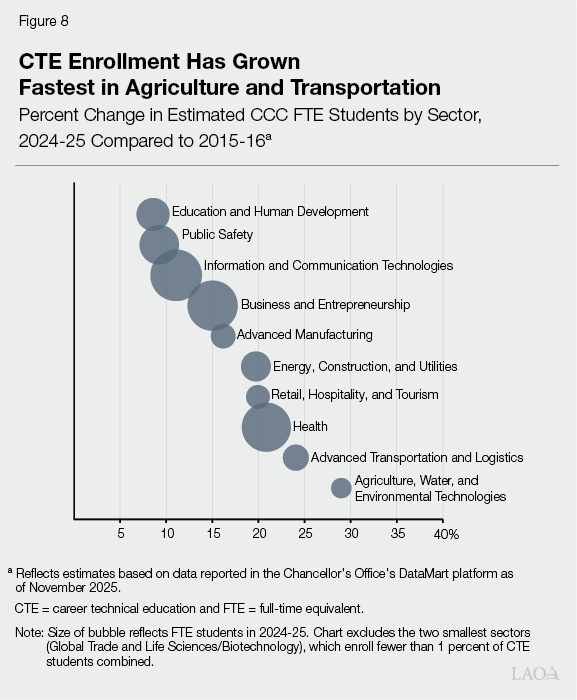
CTE Enrollment Is Up Across All Major Sectors. While the estimated number of FTE students enrolled in all major industry sectors has grown over the past decade, the growth rate has varied notably by sector, as Figure 8 shows. The fastest growth rates occurred in two smaller sectors: (1) agriculture, water, and environmental technologies and (2) advanced transportation and logistics. Health, a much larger sector, also had a relatively fast growth rate. Education and human development, meanwhile, had the lowest growth rate.
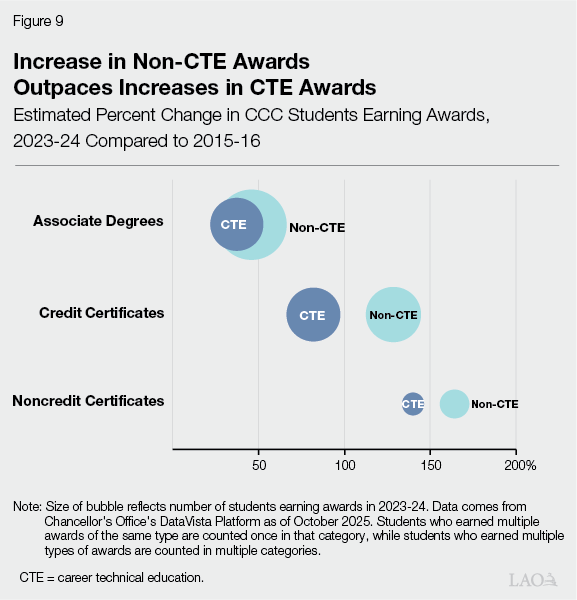
CTE Awards Have Increased Substantially, Likely Due to Factors Beyond SWP. The Chancellor’s Office provides data on students’ academic and labor market outcomes through DataVista, a public dashboard launched in fall 2024. Based on this data, the number of students earning any CTE award increased by 50 percent from 2015‑16 to 2023‑24. Figure 9 shows the increase by award type. During this period, the number of students earning each type of CTE award increased significantly. The number of students earning each of these types of awards in non‑CTE fields, however, increased even faster. This suggests the increase in CTE awards likely reflects broader factors beyond SWP. For example, these factors might include systemwide efforts to improve student outcomes as well as an incentive created under SCFF for districts to confer more awards in order to generate more apportionment funding.
Data on Employment Outcomes Has Notable Limitations. One common way to measure the effectiveness of workforce development programs is by examining participants’ employment rates, as the box below discusses. The employment rate for CTE students after exiting college is not one of the SWP performance measures, however, and this data is not reported. Instead, the most relevant SWP performance measure looks at how closely the current jobs of former CTE students are related to their field of study. Data on this measure comes from a survey that CCC sends to former CTE students who exited college about 18 months to two years earlier. Since 2015‑16, the percentage of employed respondents who reported their job is very closely or closely related to their field of study has been in the range of 71 percent to 74 percent. (The survey defines “very close” to mean the job is in the same field, while it defines “close” to mean that the job is in a different field but still uses what the student learned.) We do not know, however, whether these respondents are representative of CTE students more broadly, especially because only a small share of students receiving the survey choose to respond (between 14 percent and 33 percent annually).
Effectiveness of Workforce Development Programs
Research on Workforce Development Programs Has Had Mixed Findings. Over the years, numerous studies have examined the effectiveness of workforce development programs. Some studies have found that these programs increase participants’ employment and/or earnings, while other studies have found no effect. A 2022 report commissioned by the U.S. Department of Health and Human Services’ Office of Planning, Research, and Evaluation reviewed existing studies of 144 employment and training programs for low‑income individuals. It concluded that these programs on average had small, positive effects for participants (equivalent to an annual earnings increase of about $1,000), with the effect size varying across programs. Based on the broader research, some of the most effective workforce development programs have certain shared characteristics, including a focus on specific high‑demand industry sectors and work‑based learning components.
Earnings Outcomes Differ for CTE Versus Non‑CTE Students. To measure earnings outcomes for former students who are now employed, the Chancellor’s Office has a data sharing agreement with the Employment Development Department. Figure 10 summarizes trends in three earnings measures for former students who enrolled in CTE courses compared to former students who enrolled in non‑CTE courses. (Some students are included in both categories.) In the year after exiting college, former CTE students have higher median annual earnings than non‑CTE students. Correspondingly, a higher share of former CTE students than non‑CTE students attain a living wage, based on certain estimated expenses for a single adult in their county. The median change in earnings from before entering to after exiting college, however, is slightly lower for CTE students than non‑CTE students. One possible explanation for this combination of outcomes is that CTE students could on average have higher wages than non‑CTE students before entering college.

Earnings Have Improved, Likely Reflecting Broader Factors Beyond SWP. From 2015‑16 to 2022‑23, all three earnings measures in Figure 10 improved for CTE students. This might be a sign that SWP is making progress toward the broader economic goal of preparing individuals for higher‑paying jobs. During this period, however, non‑CTE students also saw improvements in all three earnings measures, and at somewhat similar rates as CTE students. This suggests the earnings improvements reflect factors beyond SWP, likely including the overall growth in wages in the broader economy during the period.
Some Regions Have Seen Larger Improvements in Earnings Measures. Figure 11 shows the median change in earnings from before entering to after exiting college for CTE students by region. Of the three earnings measures, this one arguably comes closest to reflecting the added value of college. All regions saw improvements in this measure between 2015‑16 and 2022‑23. For example, in the San Diego/Imperial region, CTE students who last enrolled in 2015‑16 saw a median earnings increase of 20 percent, while CTE students who last enrolled in 2022‑23 saw a median earnings increase of 30 percent—an improvement of 10 percentage points over the period. The amount of this improvement varied across regions. Notably, in the four regions that saw the largest improvements, the consortia make SWP regional spending decisions centrally. This might be a sign that better regional coordination is contributing to larger improvements in the industry value of CTE programs. It is also possible, however, that other factors (such as regional differences in labor markets) are leading some regions to see larger improvements than others on this particular performance measure. Looking across all SWP measures, there is not a clear pattern of some regions consistently seeing larger improvements than others since the beginning of the program.
Figure 11
Earnings Improvements Vary Somewhat by Region
Median Change in Earnings for CCC CTE Students
|
2015‑16a |
2022‑23a |
2022‑23 Compared |
|
|
San Diego/Imperial |
20% |
30% |
9.9% |
|
Orange County |
22 |
31 |
9.4 |
|
Central Valley/Mother Lode |
24 |
31 |
7.8 |
|
Inland Empire/Desert |
27 |
33 |
5.4 |
|
Bay Area |
28 |
31 |
3.6 |
|
Los Angeles |
25 |
29 |
3.5 |
|
South Central Coast |
25 |
28 |
3.3 |
|
North/Far North |
25 |
28 |
3.0 |
|
aReflects median percent change in earnings for CTE students from two quarters prior to the start of the academic year they first enrolled to two quarters after the end of the academic year they last enrolled. Earnings are adjusted for inflation. Figure shows data for students who last enrolled in the selected years and enrolled in at least one CTE course in that year. bReflects percentage point improvement in median change in earnings. |
|||
|
CTE = career technical education. |
|||
Issues to Consider
In this section, we raise a few issues for the Legislature to consider stemming from our review of SWP. Although the state is making progress toward SWP objectives, its experience with the program raises several key questions related to planning, coordination, and oversight across workforce development programs more broadly.
State Has Made Some Progress Toward SWP Objectives. Over the past decade, SWP has funded many activities that support the program’s objectives of increasing CTE availability (such as hiring faculty) and CTE quality (such as updating program equipment to align with industry needs). Likewise, enrollment in CTE courses has increased, and the number of students completing CTE certificates and degrees has grown notably. While SWP funding could have contributed to these trends, the trends also could reflect other factors—such as shifts in student enrollment demand, systemwide efforts to improve student outcomes, and incentives under SCFF for districts to confer more awards. Moreover, based on our analysis, it is difficult to conclude how well SWP is achieving the broader economic goal of preparing individuals for higher‑paying jobs. Data on employment outcomes for CTE students is incomplete, and data on earnings show similar trends among CTE and non‑CTE students. These findings suggest broader dynamics in the labor market could be at work. The Legislature could weigh all of this information when considering future programmatic or funding decisions related to SWP.
Regional Planning Remains Fragmented Across Workforce Development Programs. The state’s workforce development efforts require significant coordination to ensure that its many different education and training providers are producing workers that align with the needs of its numerous employers. One way the state has tried to address this coordination challenge is through regional planning. Regional planning is a key component of not only SWP and WIOA, but also various other state programs such as the California Adult Education Program, the California Jobs First Initiative, and the K‑16 Regional Collaboratives. These programs, however, are using different sets of regional coordinating entities to meet similar planning requirements. The current approach is inefficient, as it requires many of the same groups (including community colleges, workforce development boards, and industry representatives) to participate in multiple planning efforts with overlapping objectives. Keeping these planning efforts separate may also contribute to fragmentation in program delivery. To address these issues, the Legislature could consider moving toward one unified set of regions and planning requirements across workforce development programs. A unified set of regions could plan more holistically and better coordinate the use of federal and state workforce development funding.
State Has Duplicative Structures for Assessing Industry Needs. As part of its efforts to improve the quality of CTE, the community college system has created a structure to assess industry needs using employer engagement staff and labor market research centers. A similar structure also exists in the workforce development system. Local boards are also responsible for employer engagement, with more than half of each board’s members coming from industry. Moreover, local boards also conduct labor market research, often using the same public data sets and purchasing the same proprietary analytics tools as CCC’s labor market research centers. Although these activities are important to ensuring that workforce development programs have industry value, having two systems responsible for the same work is inefficient. To reduce duplication of effort, the Legislature could consider clarifying the roles of the community college system and the workforce development system as it relates to assessing industry needs.
Different Performance Measures Across Programs Weakens Oversight. Although statute requires the use of WIOA performance measures in SWP, the program instead uses its own set of measures. This makes it more challenging for the Legislature to monitor effectiveness across workforce development programs. For example, while the percentage of participants who are employed after exiting the program is a key performance measure for WIOA programs, this data is not reported for SWP. The Legislature could consider directing the Chancellor’s Office to use WIOA performance measures in SWP, as originally intended. Doing so would make it easier to combine outcomes data across programs, providing a more complete view of the state’s efforts to promote economic mobility and prepare a skilled workforce. It would also allow the Legislature to compare outcomes across programs in a more consistent way.