Natalie Gonzalez

December 10, 2025
Assessment of CSU’s Graduation Initiative 2025
Executive Summary
Nationally, Universities Heighten Focus on Student Outcomes. At the beginning of the 21st century, universities began extending their focus from enrolling more students to graduating more students. In concert with these national efforts, the California State University (CSU) launched a graduation initiative in 2009 with the goal of increasing its six‑year graduation rate for first‑time freshmen from 46 percent to 54 percent and cutting its equity gaps in half by 2015. (CSU adopted the national definition of equity gap, which was the difference in graduation rates between American Indian/Alaska Native, Black/African American, and Hispanic/Latino students and their peers.) CSU increased its six‑year graduation rate, surpassing its goal by 3 percentage points. CSU’s systemwide equity gap, however, remained nearly unchanged.
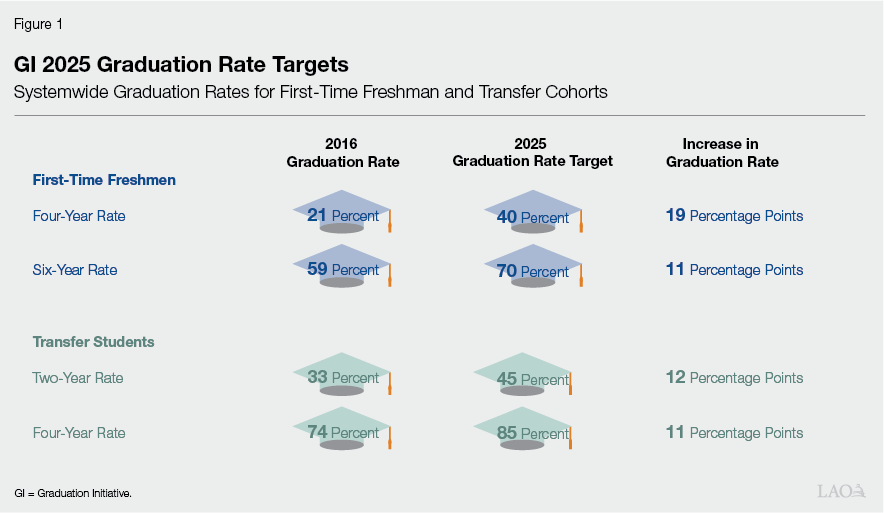
CSU Created New Graduation Initiative as Previous One Ended. As CSU’s prior graduation initiative was ending, faculty, students, and campus leaders met to set new graduation rate and equity gap targets for CSU’s next graduation initiative. Under Graduation Initiative 2025 (GI 2025), CSU added a four‑year first‑time graduation rate target and placed greater focus on transfer graduation rates. CSU aimed to increase its systemwide four‑year first‑time graduation rate to 40 percent, six‑year first‑time rate to 70 percent, two‑year transfer rate to 45 percent, and four‑year transfer rate to 85 percent by 2025. In addition to the systemwide targets, each campus had campus‑specific targets. CSU also expanded its equity gap targets to include income and first‑generation status. CSU aimed to eliminate equity gaps in graduation rates by race/ethnicity, income, and first‑generation status by 2025 at the systemwide and campus levels.
Both State Funding and Tuition Revenue Support GI 2025. The state began funding GI 2025 in 2016‑17, with an initial appropriation of $10 million ongoing General Fund. The amount of annual state funding for GI 2025 has increased over time—reaching $347 million in 2024‑25. Nearly 90 percent of state funding for GI 2025 is used for general GI 2025 activities, whereas the remainder is designated for student basic needs and mental health services. In addition to state funding, CSU dedicated $75 million in ongoing tuition revenue for GI 2025 starting in 2017‑18. In 2024‑25, total ongoing funding for GI 2025 was $422 million.
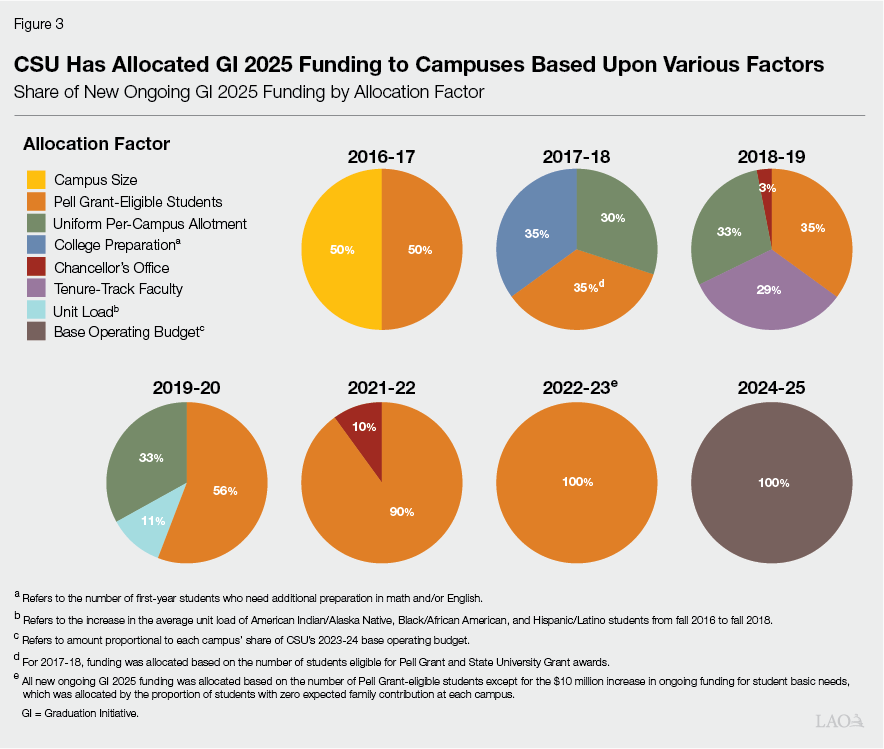
CSU Chancellor’s Office Allocates GI 2025 Funding to Campuses. The CSU Chancellor’s Office does not have a set formula to allocate GI 2025 funding to campuses. In some years, new funding has been allocated based on multiple factors (such as the number of students eligible for Pell Grants at each campus, a uniform per‑campus allotment, and campus performance outcomes). In other years, funding has been allocated based on a single factor (such as the number of students eligible for Pell Grants at each campus).
Campuses Have Discretion in How to Use Funding, With a Few Exceptions. When the state has provided funding for GI 2025, it usually has not specified how funding must be spent. Campuses generally have discretion in how to use GI 2025 funding. Campuses report using their GI 2025 funding for activities focused on helping students graduate faster (such as offering more course sections) or helping students who may be at risk of dropping out persist to the following year (such as offering emergency financial assistance). In a few instances, the state designated GI 2025 funding for targeted purposes, such as hiring more tenure‑track faculty.
CSU Met One Systemwide GI 2025 Target. Of all its GI 2025 targets, CSU surpassed one—exceeding its two‑year transfer graduation rate target by 1 percentage point. Since the start of the initiative, CSU increased its four‑year graduation rate for first‑time freshman cohorts by 15 percentage points but fell short of meeting its target by 3 percentage points. The six‑year rate, on the other hand, only increased by 3 percentage points, and CSU was 8 percentage points short of meeting this target. CSU also was 8 percentage points short of meeting its four‑year transfer graduation rate target. Thus, CSU saw greater success at graduating students faster compared to graduating more students altogether. Moreover, equity gaps by race/ethnicity, income, and first‑generation status have remained wide for first‑time freshman cohorts.
Campuses Saw Mixed Success in Meeting GI 2025 Targets. Though CSU did not reach most of its systemwide targets, 5 campuses met or surpassed their four‑year first‑time graduation rate target and 13 campuses met or surpassed their two‑year transfer graduation rate target. No campus met their six‑year first‑time graduation rate target, and only one campus met their four‑year transfer graduation rate target. Most campuses did not close equity gaps for first‑time students, with some campuses having wider gaps than at the start of the initiative.
Tying State Funding to GI 2025 Provided Some Benefits. Prior to GI 2025, CSU was already using some of its unrestricted funding for activities designed to improve student outcomes. Tying some state funding directly to GI 2025, however, helped increase transparency and institutional accountability around student success, improved data collection processes among campuses, and set an expectation that improving graduation outcomes is a joint effort between campuses and students.
GI 2025’s Program Structure Had Some Drawbacks. Having multiple program objectives seemed to make it challenging for campuses to pursue all of them, especially given campuses implemented different types of activities in response to different objectives. For example, activities designed to help students graduate faster are different from those activities intended to close equity gaps. Additionally, GI 2025 funding has not been allocated to campuses consistently in a way that has been tightly linked to program objectives. Finally, a lack of consistent reporting on cost and utilization rates for GI 2025 activities makes determining the relative cost‑effectiveness of those activities challenging.
CSU Is Transitioning to Its Next Graduation Initiative. CSU’s next graduation initiative expands upon GI 2025. In addition to setting new graduation rate targets, CSU is introducing other measures of student success, including student retention rates and job/graduate school placement. CSU is currently in the process of finalizing its systemwide and campus‑specific targets for each metric and will begin tracking progress with the entering fall 2027 cohort.
Recommend Legislature Make Structural Changes if Continuing GI Support. Given the state continues to have a structural imbalance between its revenues and spending, we recommend the Legislature continue to set a high bar for new spending moving forward. This implies weighing CSU’s next graduation initiative against the state’s other budget priorities. We recommend three statutory changes if the Legislature decides to maintain its current level of GI 2025 funding or provide additional GI funding. Specifically, we recommend the Legislature tie GI funding to specific objectives (with each objective having a set amount of dedicated funding), adopt a statutory allocation formula to distribute funding to campuses based on the specified objectives, and adopt an annual reporting requirement to track the use of funds. These changes could help improve the efficacy of the initiative as well as its cost‑effectiveness.
Introduction
Almost a decade ago, CSU launched its Graduation Initiative 2025 (GI 2025). The objectives were to increase graduation rates and close gaps in graduation rates among particular student groups by 2025. Since 2016, the state has provided a total of $1.7 billion General Fund for GI 2025. In 2024‑25, the state provided $347 million ongoing General Fund for GI 2025—representing 6.9 percent of CSU’s total ongoing General Fund support. The end of GI 2025 presents an opportune time for the state to reflect upon the initiative and identify lessons that could guide its role in future graduation initiatives. In this report, we first provide background on GI 2025, then discuss GI 2025 funding and activities. Next, we analyze the outcomes and assess the benefits and drawbacks of GI 2025. Lastly, we make recommendations for the Legislature to consider as it contemplates its involvement in CSU’s next graduation initiative.
Background
In this section, we provide background on CSU’s graduation initiative prior to GI 2025, then describe the transition to GI 2025.
Previous Graduation Initiative
About 20 Years Ago, Colleges Began Placing Greater Focus on Student Outcomes. Historically, many colleges have focused on expanding access by increasing enrollment. In the 2000s, some colleges across the nation heightened their focus on student outcomes, with an interest not only in enrolling students but helping them through to graduation. In 2007, the six‑year graduation rate for first‑time, full‑time students at four‑year public institutions was 55 percent. Hence, many students entering four‑year public institutions were leaving without a degree. Over the past 20 years, researchers have identified various barriers to college graduation. Financially, some students have challenges covering college costs, including their housing costs. Programmatically, some students lack available courses or timely advising. Administratively, some students have difficulty transferring course credits, registering for classes, and completing financial aid forms. On a personal level, some students have certain family obligations, health issues arise, or social connections wane.
National Push Emerges to Increase Graduation Rates and Close Equity Gaps. Graduating more college students became a heightened national priority in the mid‑2000s. The push was driven by an acknowledgment that existing graduation rates were low and graduating more students from all student groups could help the United States remain competitive, fulfill its workforce needs, and reduce income inequality. In 2007, leaders at 22 public higher education systems (including CSU) collaborated on an initiative to increase the number of college graduates nationwide and reduce gaps in graduation rates between students who had been traditionally underrepresented in higher education and their peers.
CSU Set Graduation Rate and Equity Gap Targets Prior to GI 2025. Emanating in part from what was happening nationally, CSU leaders met independently in fall 2009 to discuss how the CSU system could improve its own graduation rates, especially for students with historically lower graduation rates. Though CSU’s six‑year graduation rate was higher than many of its peers at this time, less than half of first‑time freshmen entering CSU were graduating in six years. To track its progress on improving student outcomes, CSU adopted the national performance metrics of the six‑year graduation rate and equity gap by race/ethnicity. (Consistent with the approach being used nationally, CSU measured equity gaps as the difference in the graduation rates of American Indian/Alaska Native, Black/African American, and Hispanic/Latino students—students with historically lower graduation rates—and Asian, multiracial, and white students.) For each metric, CSU set targets. Specifically, CSU aimed to increase its systemwide six‑year graduation rate from 46 percent to 54 percent by 2015. It aimed to reduce its equity gap by half—narrowing from a gap of 13 to 6.5 percentage points.
Each CSU Campus Set a Graduation Rate Target. Under this initiative, each CSU campus committed to increasing the six‑year graduation rate for its first‑time freshman cohorts to bring the systemwide rate within the top quartile of national universities. Campuses that already were in the top quartile of national universities committed to increasing their six‑year graduation rate by six percentage points. All campuses committed to reducing their equity gaps by half.
CSU Surpassed Systemwide Six‑Year Graduation Rate Target but Equity Gap Remained Nearly Unchanged. CSU exceeded its six‑year target—raising its systemwide graduation rate to 57 percent in 2015. CSU did not, however, reduce its equity gap by half. Both sets of student groups saw an increase in their six‑year graduation rate, but the systemwide equity gap remained nearly unchanged.
Transition to GI 2025
CSU Expanded Set of Graduation Rate Targets. As this earlier initiative was nearing its close, CSU planned to continue improving its graduation rates. To this end, CSU faculty, students, and campus leaders met to set new graduation rate targets for 2025. Whereas the prior initiative stemmed from a national focus on the six‑year graduation rate, the new initiative added a focus on the four‑year graduation rate. Graduating students in fewer years (four rather than six) was a key state priority, as graduating in less time reduces the overall cost of college (if unit‑taking is reduced or additional academic terms are avoided) and allows students to enter the workforce full time earlier. Additionally, transfer graduation rates became a greater focus, with CSU placing more emphasis on its two‑year transfer graduation rate. CSU established its GI 2025 graduation rate targets in fall 2016. As Figure 1 shows, CSU aimed to increase its four‑year graduation rate for its first‑time freshman cohorts by 19 percentage points and its two‑year graduation rate for its transfer student cohorts by 12 percentage points.
CSU Used New Methodology for Setting GI 2025 Targets. Similar to its earlier graduation initiative, CSU established both systemwide and campus‑specific targets under GI 2025. However, the methodology to determine each campus target changed under GI 2025. For graduation rates for first‑time freshman cohorts, each campus aligned its 2025 targets with high‑performing peer institutions. Specifically, each campus set its target based on the average graduation rate and average growth in graduation rates over the past five years of its top five peers. (CSU identified peer institutions based on similarities in certain metrics, including enrollment, student‑to‑faculty ratio, and percent of Pell Grant students.) For transfer students, CSU believed existing available data indicated it already had relatively high graduation rates compared to peer institutions. Rather than benchmarking its outcomes to a set of peers, CSU directed campuses to increase their graduation rate targets for transfer students a minimum of 10 percentage points above their current rates.
CSU Also Expanded Definition of Equity Gaps and Set New Equity Targets. During the process of finalizing GI 2025 graduation rate targets, CSU representatives also met to discuss new equity gap targets. CSU decided to expand its measurement of equity gaps to capture additional aspects of its student body. While continuing to measure the graduation rate gap based on student race/ethnicity, GI 2025 also focused on the graduation rate gap between low‑income students and their peers, as well as first‑generation students and their peers. For this purpose, CSU defines “low‑income students” as those who receive a Pell Grant, which is a federal financial aid award given to students with financial need. CSU defines “first‑generation students” as those who report that neither of their parents attended any college. In fall 2016, CSU established its 2025 targets to eliminate gaps in graduation rates by race/ethnicity, income, and first‑generation status.
Funding
Funding for GI 2025 Has Increased Substantially Over Past Nine Years. CSU receives funding from two main sources—state General Fund and student tuition revenue. Most of this funding is unrestricted, meaning CSU can decide how to use it. Some of this funding, however, is designated for specified categorical purposes (such as providing certain student services). Whereas the 2009 graduation initiative received no direct funding, GI 2025 has received both state funding and student tuition revenue. Most of this categorical funding is ongoing, but CSU also received small amounts of one‑time state funding for GI 2025 in its early years of implementation. As Figure 2 shows, total annual funding for GI 2025 has grown from $50 million in 2016‑17 to $422 million in 2024‑25. Roughly 80 percent of the ongoing funding for GI 2025 is from the state. When CSU raised tuition in 2017‑18, it dedicated $75 million in tuition revenue (out of an additional $119 million) toward GI 2025, comprising the rest of the ongoing funding.
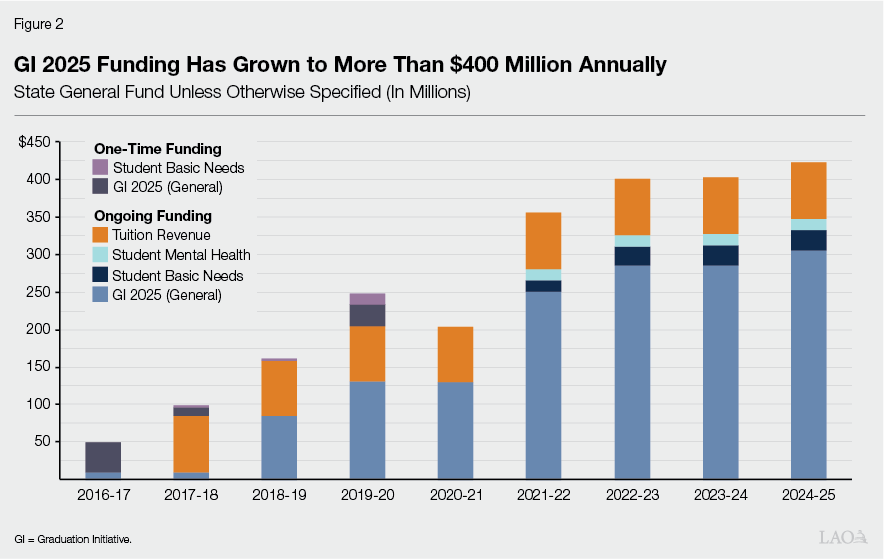
State Also Started Funding Student Basic Needs and Mental Health Programs. The state appropriates three pots of GI 2025 funds—a general pot and two earmarked pots (for student basic needs and mental health services, respectively). The state first provided ongoing funding for the two earmarked pots in 2021‑22. In 2024‑25, $42 million (12 percent) of the ongoing state funding for GI 2025 was for student basic needs and mental health services while the remaining $305 million (88 percent) was for general GI 2025 purposes. Campuses may use student basic needs funding for food pantries, meal voucher programs, free access to local bus services, emergency funds for housing, additional counselors, and wellness workshops, among other similar uses. CSU considers funding for basic needs and mental health services as part of its overall GI 2025 efforts, as these types of services help reduce barriers to graduation.
General GI 2025 Pot of Funding Has Come With a Few Strings From the State. The general pot of GI 2025 funding can be used for any GI 2025 purpose, with a few exceptions. In 2018‑19, the state dedicated $25 million of new ongoing GI 2025 funding to increase the number of tenure‑track faculty at CSU. Across the 2018‑19 through 2020‑21 period, CSU reported spending $52 million for this purpose using a mix of GI 2025 and other funding. (The intent of hiring additional tenure‑track faculty was to offer students more mentoring and advising, further flexibility in meeting with faculty, and increased research opportunities with professors.) In 2024‑25, the state required CSU to use $35 million of its existing ongoing GI 2025 funding for efforts specifically aimed at closing equity gaps.
Chancellor’s Office Determines How GI 2025 Funds Are Allocated Across Campuses. The state did not establish statutory rules for how GI 2025 funding is allocated to campuses. This has been decided by the Chancellor’s Office in consultation with campus leadership. As Figure 3 shows, CSU’s formula to allocate new ongoing GI 2025 funding has varied over the years. The most common factor CSU has used in its allocation formula has been campuses’ Pell Grant counts. The next most common has been providing a uniform amount per campus (for example, $960,000 per campus). Other factors have included the number of tenure‑track faculty at each campus (with campuses lower than the systemwide average receiving more funding) and average unit load of certain student groups (with campuses seeing unit‑load increases receiving funding).
GI 2025 Activities
Campuses Have Notable Discretion in How They Use GI 2025 Funds. Apart from the purposes noted earlier, the state generally has not required CSU campuses to use GI 2025 funds for specified activities. When launching GI 2025, the CSU Chancellor’s Office identified six priority areas to guide campuses’ spending decisions. Figure 4 lists these priority areas. The CSU Chancellor’s Office identified the priority areas based on national research and best practices on improving graduation rates. Campuses are to align their GI 2025 activities with these priority areas, but campuses have considerable discretion in deciding the specific set of activities they implement using GI 2025 funds.
Figure 4
GI 2025 Activities Are Related to Six Priority Areas
|
Priority Area |
Example of GI 2025 Activity |
|
Academic Preparation |
Created new centralized tutoring center and increased group‑study sessions for challenging classes. |
|
Enrollment Management |
Increased number of sections offered per semester for high‑demand courses. |
|
Student Engagement and Well‑Being |
Provided services for students facing housing and/or food insecurity. |
|
Student Financial Support |
Provided financial support to graduating seniors facing unexpected costs to help them stay in school and complete their courses. |
|
Data‑Informed Decision Making |
Improved tracking of course‑level performance data to understand which courses had highest dropout, failure, and withdrawal rates. |
|
Administrative Improvements and Efficiencies |
Replaced some paper forms with electronic forms to help students complete administrative requests faster. |
|
GI = Graduation Initiative. |
|
Real‑Time Data Also Guide Activities. Campuses rely on real‑time data to help them make specific decisions regarding how to use GI 2025 funds. Real‑time data can include students’ course enrollment, degree progress, and grades. Many campuses use real‑time data in these areas to identify students who are not on track to graduate. Campuses then reach out to those students at risk of dropping out to understand what barriers are impeding them from graduating. This helps inform which GI 2025 activities would best serve those students. For example, a campus might decide to provide a particular student with a grant to complete courses during the summer or expand tutoring services for courses that have high failure rates.
Some Activities Focus on Time to Graduation. To meet their four‑year graduation rate targets, campuses must help some students graduate faster. To this end, campuses implement activities that are focused on time to graduation. These types of activities include increasing the number of units that students can take each term and increasing the number of sections for high‑demand and required courses each term. These types of activities help students progress more quickly and potentially more efficiently through their graduation requirements.
Some Activities Focus on Graduating More Students. To increase graduation rates and close equity gaps, campuses must also graduate more students. About one‑third of students that enter CSU as freshmen end up leaving rather than graduating. Many of these students do not make it to the end of their sophomore year. Once students leave a campus, it is challenging to bring them back. To address this concern, some GI 2025 activities focus on student retention, with many of these activities directed at retaining first‑ and second‑year students. Examples of these activities include providing a summer program for entering freshmen who need additional academic preparation and operating a first‑year mentorship program to help students adjust to college life.
Outcomes
In this section, we first analyze CSU’s graduation rate outcomes both at the systemwide and campus levels, then turn to equity gaps. The outcomes data includes graduation rates through the final year of GI 2025.
Graduation Rate
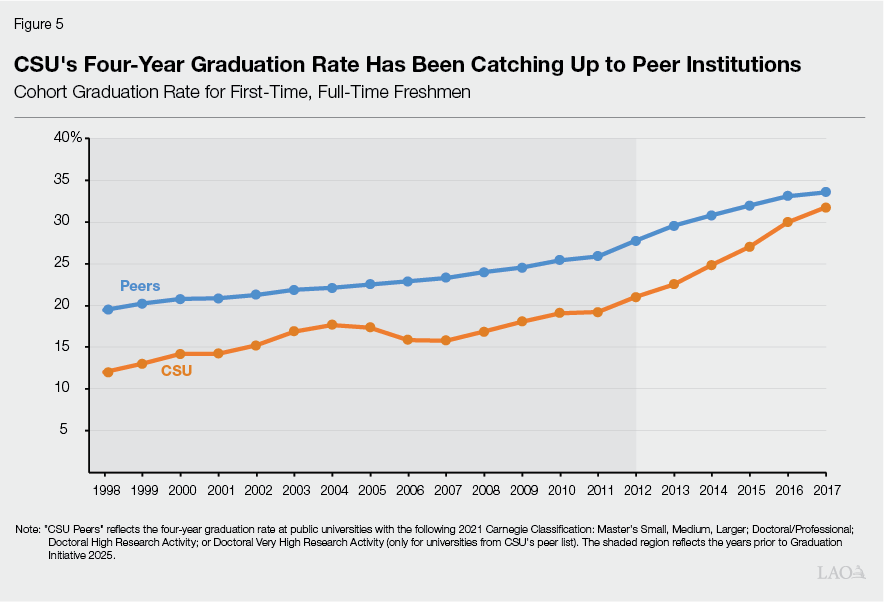
CSU Increased Four‑Year Graduation Rate at Faster Rate Than Peers. Historically, CSU’s four‑year graduation rate has been lower than its peers. The year prior to the start of GI 2025, the rate was 7 percentage points lower. However, as Figure 5 shows, CSU saw a sharper increase in the four‑year rate during the years of GI 2025 compared to its peers. The most recent data (2017 entering freshman cohort graduating in 2021) indicates CSU’s four‑year graduation rate was just 2 percentage points lower than its peers. (Six‑year graduation rates at CSU are generally higher than peer institutions—both before and during GI 2025 efforts.)
CSU Almost Reached Its Four‑Year Target for First‑Time Freshmen. CSU’s sharp increase in its four‑year graduation rate brought it close to meeting its systemwide target. As Figure 6 shows, CSU was 3 percentage points away from hitting its four‑year graduation rate target of 40 percent for its first‑time freshman cohorts. The four‑year graduation rate steadily increased under GI 2025, rising 15 percentage points since the launch of the initiative (beginning with the 2017 graduation year). Of all the GI 2025 objectives, CSU made the most progress on this metric—helping students graduate faster. Shortening time to degree likely has corresponded with other positive outcomes, including lowering overall college costs (by reducing excess units and academic terms) and increasing college access (by freeing up enrollment slots sooner).
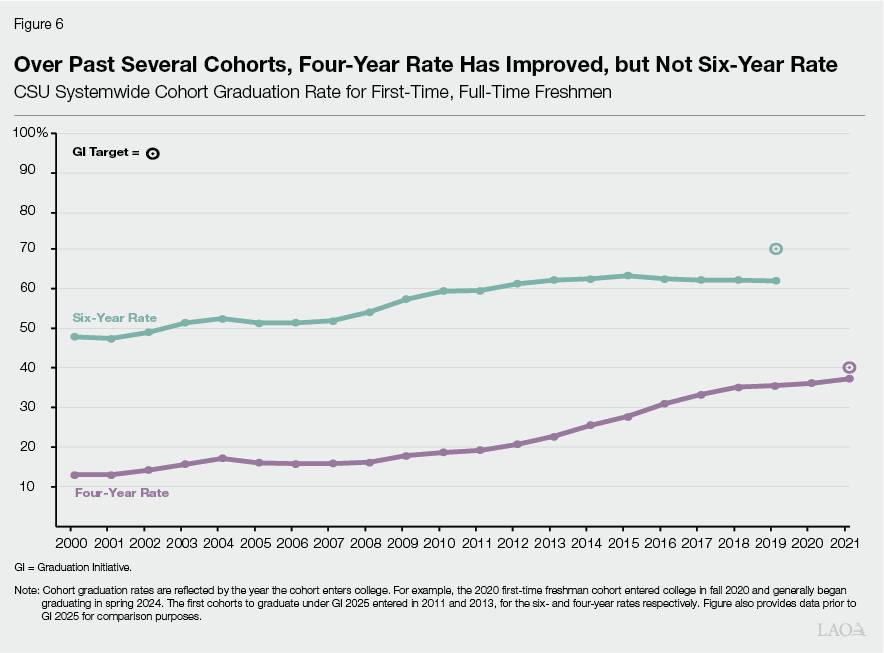
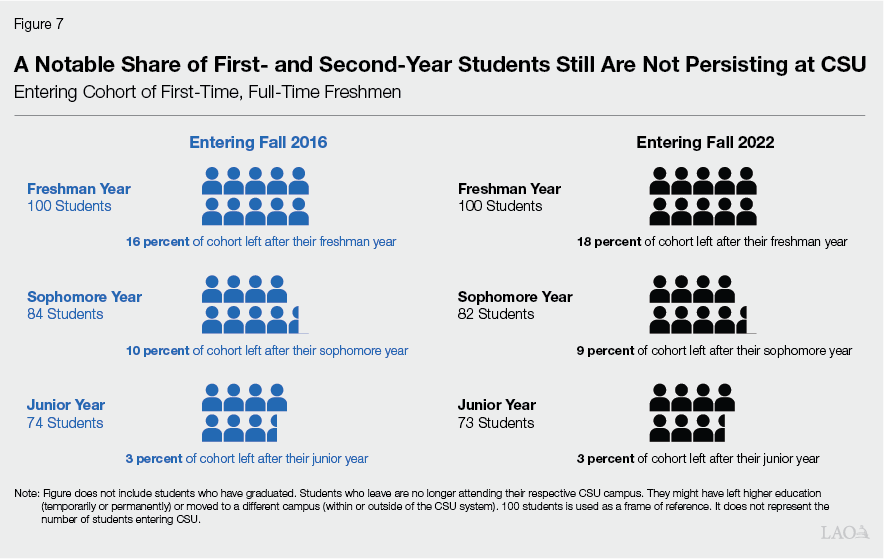
CSU Had Little Improvement in Its Six‑Year Rate, Reflecting Little Change in Underlying Student Persistence. In contrast to the four‑year graduation rate for freshman cohorts, the six‑year rate was relatively flat throughout GI 2025, with an increase of only 3 percentage points. CSU was 8 percentage points short of its six‑year target of 70 percent. One reason the six‑year graduation rate has been stagnant is because underlying student persistence rates have not improved. CSU tracks the share of students that persist to the next year of college at their campus of origin. As Figure 7 shows, CSU’s persistence rates were slightly worse for students entering in fall 2022 compared to fall 2016 (the year prior to the launch of GI 2025). Unlike with the four‑year rate where the focus is on graduating students faster, CSU has to graduate more students altogether to increase the six‑year rate. To do so, campuses must focus on retaining students at risk of dropping out. Focusing on these students could entail more resource‑intensive activities than helping those students already on track to graduate.
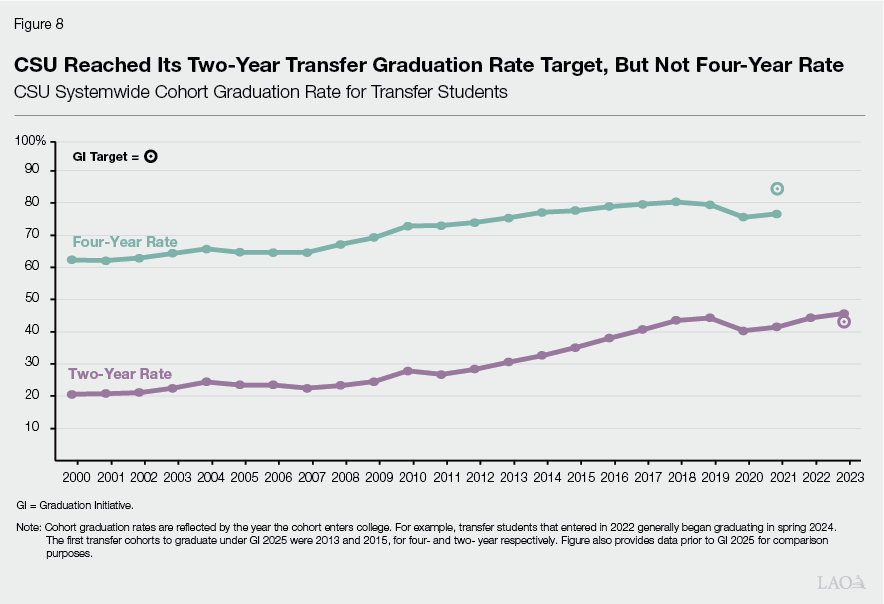
For Transfer Students, CSU Increased Its Two‑Year Rate Faster Than Four‑Year Rate. As Figure 8 shows, CSU surpassed its two‑year graduation rate target for transfer students by 1 percentage point. With the exception of 2020, which likely was affected by the pandemic, this rate steadily increased under GI 2025, rising 11 percentage points. The four‑year graduation rate for transfer students increased more slowly. CSU fell short of its four‑year graduation rate target for its transfer cohorts by 8 percentage points. Similar to the trends for first‑time freshman cohorts, CSU saw more improvement in graduating transfer students in less time compared to graduating more transfer students overall. Its persistence rate for transfer students remained about the same as it had been at the start of GI 2025.
Campuses Trends Parallel Systemwide Trends. As Figure 9 shows, five CSU campuses surpassed their four‑year graduation rate target for first‑time students, but no CSU campus met its six‑year graduation rate target. Similarly, 13 CSU campuses surpassed their two‑year target for transfer students, but only 1 CSU campus met its four‑year target for transfer students. Comparing freshman and transfer cohorts, more campuses met their transfer targets. Whereas nine campuses fell more than 10 percentage points short of their six‑year graduation rate targets for first‑time freshman cohorts, only two campuses fell more than 10 percentage points short of their four‑year graduation rate target for transfer students.
Figure 9
Most Campuses Did Not Meet
All Their Targets
Number of Campuses in Each Range From
Graduation Rate Targets
|
Number of |
|
|
First‑Time Students |
|
|
Four‑Year Rate |
|
|
At or above target |
5 |
|
Less than 5 percentage points from target |
10 |
|
5 to 10 percentage points from target |
3 |
|
More than 10 percentage points from target |
5 |
|
Six‑Year Rate |
|
|
At or above target |
— |
|
Less than 5 percentage points from target |
3 |
|
5 to 10 percentage points from target |
11 |
|
More than 10 percentage points from target |
9 |
|
Transfer Students |
|
|
Two‑Year Rate |
|
|
At or above target |
13 |
|
Less than 5 percentage points from target |
8 |
|
5 to 10 percentage points from target |
2 |
|
More than 10 percentage points from target |
— |
|
Four‑Year Rate |
|
|
At or above target |
1 |
|
Less than 5 percentage points from target |
6 |
|
5 to 10 percentage points from target |
14 |
|
More than 10 percentage points from target |
2 |
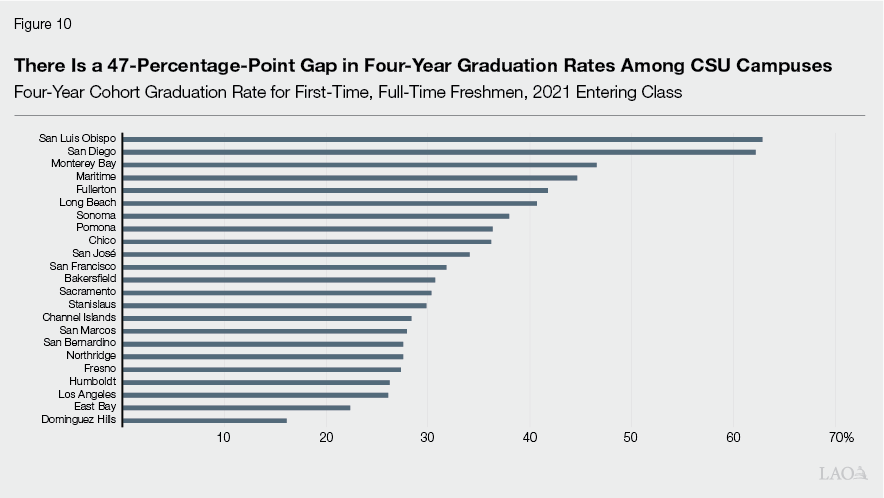
Disparities in Graduation Rates Across Campuses Remain Large. As Figure 10 shows, large gaps in graduation rates continue to exist among CSU campuses. Moreover, the gap in graduation rates between the highest‑performing and lowest‑performing campuses has grown since the start of GI 2025. (Part of this could be due to GI 2025 not initially setting higher targets for campuses with lower graduation rates.) The implication is that students’ likelihood of graduating remains tightly linked to the campus they attend, even beyond the traditional equity gaps discussed next. For example, 50 percent of first‑time Pell Grant students at San Luis Obispo graduate in four years compared to 16 percent of non‑Pell Grant students at Dominguez Hills. That is, the likelihood of graduating is much higher overall for students at San Luis Obispo.
Equity Gaps
Systemwide Equity Gaps in Graduation Rates Remain Notable for First‑Time Students. As Figure 11 shows, equity gaps in graduation rates by race/ethnicity, income, and first‑generation status persist. (As discussed in the box below, equity gaps in graduation rates by gender also persist.) Generally consistent with how institutions across the nation have been tracking equity gaps, CSU continues to measure the gap in graduation rates of American Indian/Alaska Native, Black/African American, and Hispanic/Latino students compared to their peers. (This report uses these categories to maintain consistency with CSU’s data.) Since the start of GI 2025, the equity gap by race/ethnicity has grown from 13 to 16 percentage points for the four‑year graduation rate and from 13 to 15 percentage points for the six‑year rate. The equity gap by income has decreased from 15 to 14 percentage points for the four‑year rate but increased from 11 to 12 percentage points for the six‑year rate. The equity gap by first‑generation status has remained nearly unchanged at 17 percentage points for the four‑year rate and 14 percentage points for the six‑year rate.
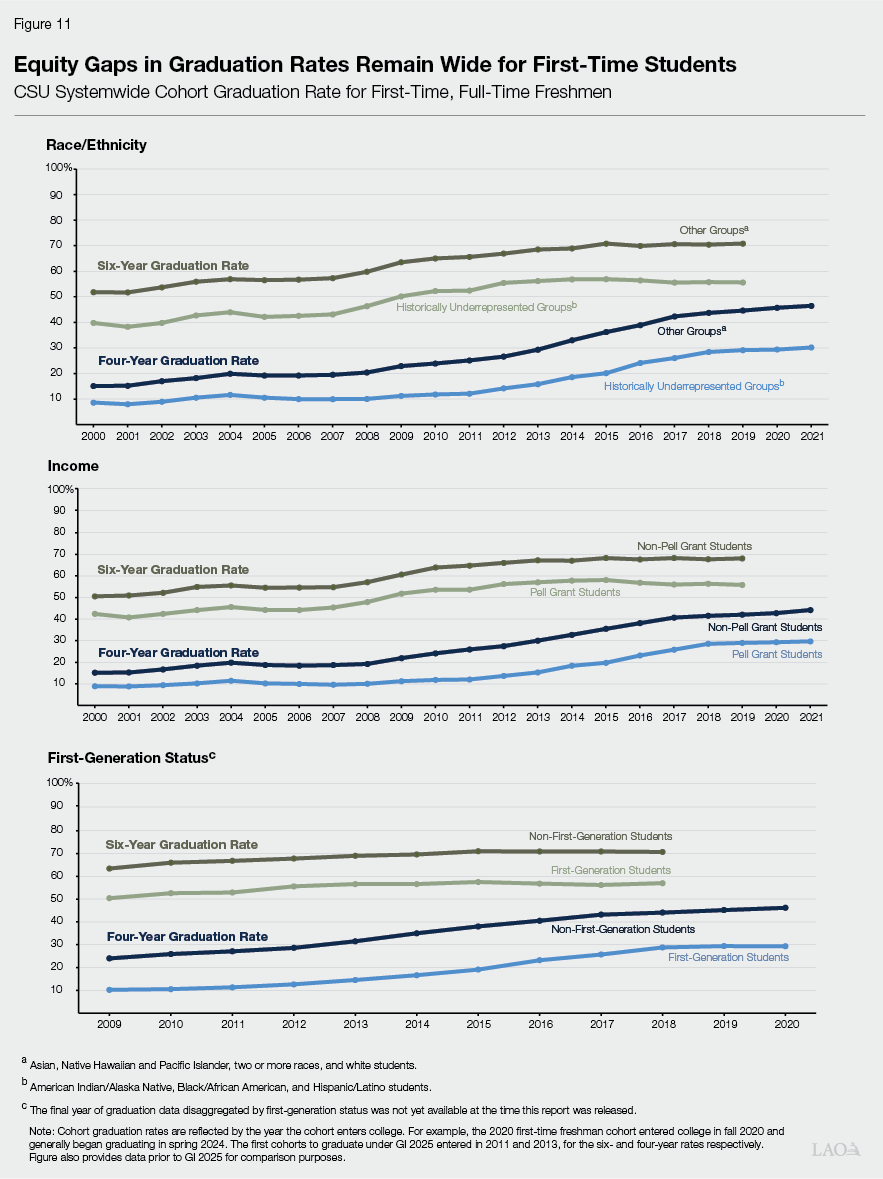
Equity Gaps by Gender Are Notable
Male Students Continue to Graduate at Lower Rates Than Female Students. The designers of the Graduation Initiative 2025 (GI 2025) expanded the notion of equity gap to include not only race/ethnicity but also income and first‑generation status. GI 2025 did not, however, include a focus on gender, despite male students historically having lower graduation rates than their female peers. The gender gap has persisted throughout GI 2025. Based on the most recent data, CSU’s systemwide four‑year graduation rate is 42 percent for first‑time female students compared to 31 percent for first‑time male students. (CSU does not provide graduation data for students who identify as neither male nor female.) Though this gap is somewhat smaller compared to the gaps by race/ethnicity, income, and first‑generation status, it is still notable. Moreover, the four‑year graduation rate gap by gender has become slightly wider since the start of GI 2025 (2 percentage points wider) while the six‑year gap remains nearly unchanged.
More Campuses Have Widened Equity Gap by Race/Ethnicity Than Narrowed It for First‑Time Students. For equity gaps by race/ethnicity at the campus level, 11 campuses narrowed or eliminated the gap in four‑year graduation rates for first‑time freshman cohorts, while 12 campuses had gaps that widened since the start of GI 2025. The pattern was the same for six‑year graduation rates, with 14 campuses widening their gaps. Stanislaus is the only campus to eliminate the gap in the four‑year first‑time graduation rate for American Indian/Alaska Native, Black/African American, and Hispanic/Latino students and their peers. For the six‑year rate, Bakersfield and Monterey Bay are the only campuses to eliminate this gap.
Campus Trends in Equity Gaps by Income for First‑Time Students Are More Nuanced. Since the start of GI 2025, 16 campuses have narrowed or eliminated the gap in four‑year graduation rates between first‑time Pell Grant students and their peers, while 7 campuses have widened the gap. The trend is somewhat different for six‑year graduation rates, with only 9 campuses having narrowed or eliminated the gap, while 14 campuses have widened it. Dominguez Hills is the only campus to eliminate the gap in the four‑year first‑time graduation rate for Pell Grant students and their peers. For the six‑year rate, Dominguez Hills and San Bernardino are the only campuses to eliminate this gap. (CSU does not provide campus‑level data on equity gaps by first‑generation status.)
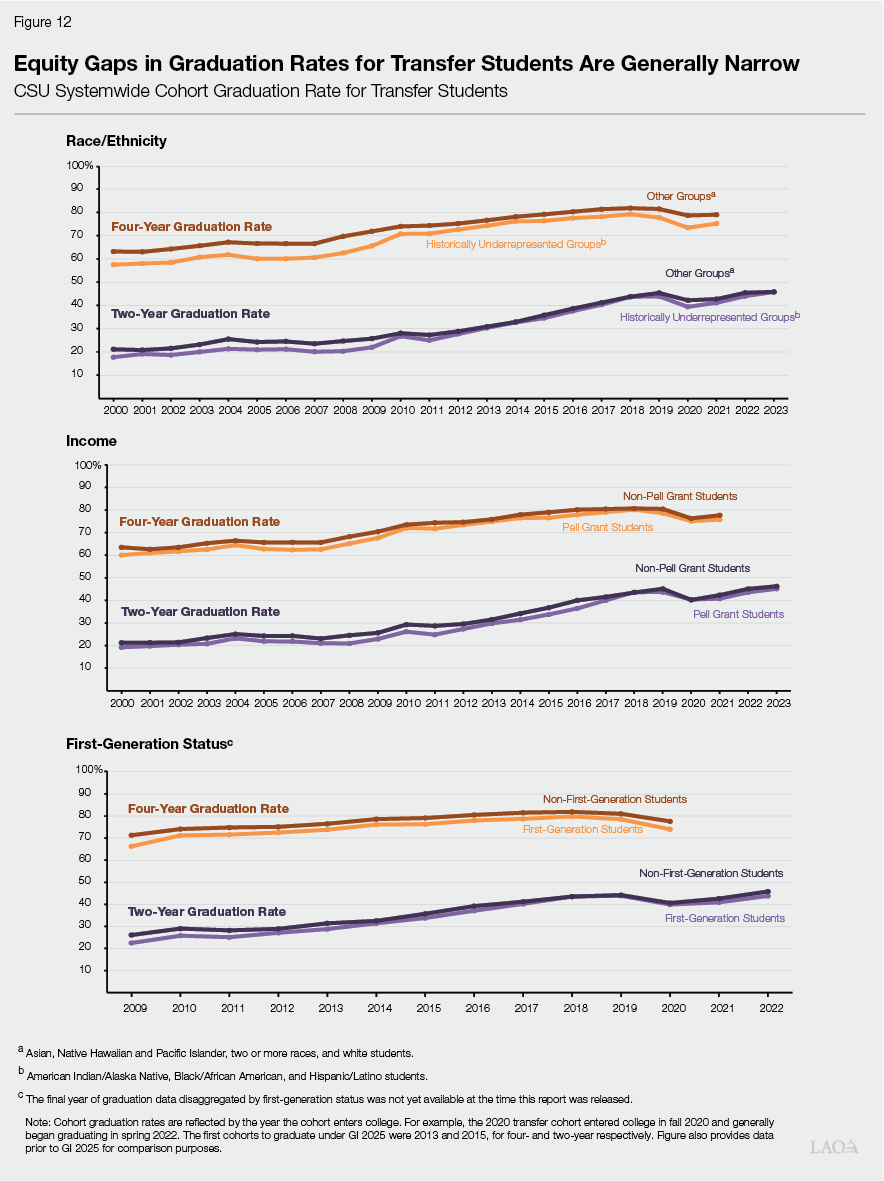
Systemwide Equity Gaps Remain Narrow for Transfer Students. Equity gaps among transfer students have historically been much narrower compared to the gaps among first‑time freshman cohorts. One reason for this is likely because transfer students arrive at CSU having already completed their initial years of college and having overcome associated challenges. As Figure 12 shows, equity gaps are almost closed for the two‑year transfer graduation rate. For the four‑year transfer graduation rate, however, equity gaps have slightly widened since the start of GI 2025.
Assessment
In this section, we first discuss the benefits of GI 2025, then identify its drawbacks.
Tying State Funding to CSU’s Graduation Initiative Had Some Benefits. Prior to GI 2025, CSU was already using some of its unrestricted state funding for activities designed to improve student outcomes, including increasing graduation rates. The CSU administrators we interviewed, however, believed that tying state funding to GI 2025 directly helped cast greater legislative, systemwide, and campus focus on graduation rates and equity gaps. In our review, we identified three specific benefits of GI 2025:
- Enhanced Transparency and Institutional Accountability. Though CSU’s longstanding mission has been to educate and graduate students, GI 2025 tied state funding to specific objectives with specific performance targets. Setting GI 2025 targets heightened public attention on CSU’s performance. In doing so, the CSU system and each of its campuses felt greater institutional accountability to demonstrate improved outcomes.
- Improved Data. Campuses had to improve their data collection efforts and upgrade their data systems to better understand what activities would help them reach their GI 2025 targets. Through these improvements, campuses indicate they now are able to better identify students at risk of dropping out or not graduating on time and provide relevant support services.
- Set Expectation That Improving Graduation Outcomes Is a Joint Effort. CSU administrators shared with us that implementing GI 2025 helped shift the expectation of graduation from being the sole responsibility of the student to being the joint responsibility of the student and institution. Thus, GI 2025 placed a greater emphasis on the campus’ role in helping students succeed.
Having Multiple Program Objectives Led to Challenging Campus Decisions. Though GI 2025 tied state funding to a clear set of objectives, having multiple objectives meant campuses had to make key choices regarding how much effort and resources to dedicate to each objective. Whenever a program has multiple objectives, having to prioritize among those objectives can be a challenge. In the case of GI 2025, one key complicating factor was that campuses generally had to implement different types of activities to achieve each objective. For example, to increase the six‑year rate, campuses had to focus on activities that helped students, primarily first‑ and second‑year students, persist. These activities (such as offering math supplemental instruction for freshmen) differ from the activities needed to help students graduate faster (such as offering more course sections). Similarly, the activities aimed at improving overall graduation rates (such as hiring more advisors) differ somewhat from those activities aimed specifically at closing equity gaps (such as creating a peer mentorship program for first‑generation students). Moreover, the activities aimed at addressing certain equity gaps differ from those aimed at addressing other equity gaps. Based on the outcomes data, campuses appear to have compromised progress on some program objectives in order to make progress on other program objectives.
CSU’s Allocation Formula Has Been Inconsistent and Not Tightly Linked With Core Objectives. With little state guidance in how to allocate GI 2025 funds across campuses, CSU itself has decided how to make these allocations. Every year since the inception of GI 2025 in 2016‑17, CSU has used a different formula to allocate new GI 2025 funds, such that campuses have not known one year from the next what it takes to obtain program funding. Moreover, CSU’s allocation factors have varied from strongly linked with program objectives (for example, Pell Grant counts) to not linked (for example, providing a flat amount to every campus regardless of need or performance).
State Has Not Received Data on Cost or Utilization of GI 2025 Activities. The state required CSU to submit three reports on GI 2025 activities. Those reports contained considerable narrative around the GI 2025 activities that campuses were implementing. The reports did not, however, include the amount of money campuses spent on each activity. Additionally, they did not include utilization rates for GI 2025 activities. Activities—such as tutoring, advising, and mentoring services—are only beneficial if students, especially those who need them most, are using them. Recent data from CSU indicates that utilization rates are low for these types of services across many student groups. Specifically, recent survey results indicate that more than 70 percent of students do not utilize or rarely utilize services such as tutoring, diversity and inclusion programs, counseling, and career services. Low utilization could be cause for concern. Alternatively, though overall utilization is low, the small group of students most in need of certain support services could be the ones accessing them. (For example, a 10 percent utilization rate for math tutoring services may seem low, but if it is the 10 percent of students at risk of failing their math general education course, the activity is reaching the intended students.) Unfortunately, available data is not granular enough to draw clear conclusions.
Data on Cost‑Effectiveness of GI Activities Correspondingly Is Not Available. Without required reporting on how much campuses are spending on particular GI 2025 activities and how many and which students are using them, the Legislature cannot know which activities are most cost‑effective. Currently, the Legislature cannot compare the cost‑effectiveness of even the most common types of GI 2025 activities, such as tutoring, first‑year mentoring programs, grants for graduating seniors, and additional high‑demand course sections.
Recommendations
In this section, we first recommend the Legislature consider how CSU’s graduation initiative fits within its overall state and higher education priorities. If the Legislature desires to maintain or augment state funding for a new CSU graduation initiative, we have three specific recommendations for it to consider. These three recommendations incorporate lessons learned from GI 2025, while also incorporating best practices in state program design. (With CSU’s existing graduation initiative phasing out in 2025, CSU has turned its attention to its next graduation initiative. In September 2025, CSU finished its “Year of Engagement.” We provide more detail about these efforts in the box below.)
CSU’s Year of Engagement
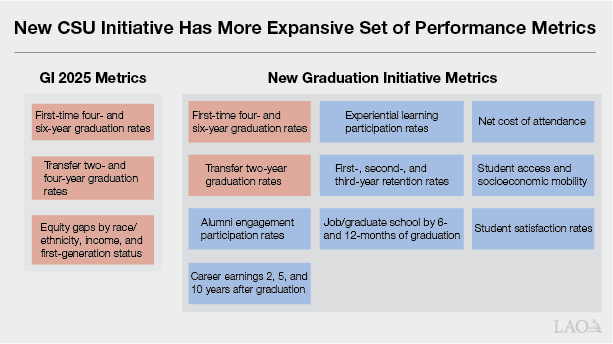
Year of Engagement Sets Up CSU’s Next Graduation Initiative. Over the past year, CSU has been working on developing its next graduation initiative. To develop the framework of the new initiative, CSU gathered feedback from faculty, students, campus leaders, staff, alumni, and community partners. It also analyzed CSU and peer data, reviewed national research, and conducted various focus groups. The new framework goes beyond the GI 2025 objectives of increasing graduation rates and closing equity gaps by adding new objectives and several new metrics. One notable new objective is ensuring all students are able to graduate with a first career job or pathway to graduate education. The figure below compares the metrics that CSU used under GI 2025 with the broader set of metrics under the new initiative. CSU will continue to measure graduation rates but will also measure retention rates, student satisfaction, and alumni engagement, among other metrics. Though the Year of Engagement framework mentions the importance of closing equity gaps in educational outcomes, it does not include an explicit equity metric.
CSU Is Setting New Targets. CSU is planning to set targets for each of the identified metrics. CSU already has set new systemwide graduation rate targets: 50 percent first‑time four‑year graduation rate (a 13‑percentage‑point increase by the 2031 graduation year), 72 percent first‑time six‑year graduation rate (a 10‑percentage‑point increase by the 2033 graduation year), and 52 percent two‑year transfer graduation rate (a 6‑percentage‑point increase by the 2029 graduation year). CSU has also already set systemwide retention rate targets for the 2027 fall cohort: 88 percent first‑year retention rate (a 4‑percentage‑point increase), 81 percent second‑year rate (a 9‑percentage‑point increase), and 78 percent third‑year rate (an 8‑percentage‑point increase). CSU set these targets by looking at the system’s historical graduation and retention rate performance, the performance of its peers, and the performance of aspirational institutions (peers who increased their graduation rates after implementing similar initiatives).
CSU Is Beginning Two‑Year Transition Period. CSU plans to undertake a two‑year transition period intended to give campuses time to develop the data tools, processes, and infrastructure needed to pursue its new objectives and ultimately reach its new targets. Over the coming months, CSU also will work with campuses to set campus‑level graduation and retention rate targets, as well as targets for the remaining metrics. Given this transition period, CSU plans to measure outcomes beginning with the student cohort entering in fall 2027.
Consider New Graduation Initiative Within Broader State Context. We recommend the Legislature consider any new CSU graduation initiative within the broader state context—weighing the CSU initiative against other policy and budget priorities. Especially because the state continues to have a structural imbalance between its revenues and spending, we recommend the Legislature continue to set a high bar for new spending moving forward. We also recommend the Legislature continue to monitor whether existing programs are meeting their objectives cost‑effectively and make adjustments accordingly. While a new CSU graduation initiative likely would provide some state benefits (such as enhanced economic mobility), those benefits could be less sizable or less significant than the potential public benefits of other state programs.
Tie Funding to Each State‑Identified Graduation Objective. If the Legislature decides to maintain its current level of GI funding or provide additional GI funding, we recommend the state tie that funding to specified objectives. We think doing so is particularly important given the state’s recent experience with GI 2025, which had multiple objectives. Under GI 2025, CSU came close to meeting some objectives but remained far from meeting others. If the state desires to see improvement on a particular objective (such as increasing the six‑year graduation rate), then tying funding more tightly to that one objective will increase the chances campuses focus on that objective. It also will minimize the risk that campuses spread their efforts too thin or direct their efforts toward some objectives but not others. Establishing each program objective and setting the associated amount of funding for it would depend on the Legislature’s priorities and the state budget condition.
Create Statutory Formula to Allocate GI Funds Across Campuses. Rather than continuing with the practice of CSU determining how to allocate GI 2025 funding across campuses, we recommend the Legislature adopt a statutory allocation formula for ongoing GI 2025 funding and any potential new GI funding. Having a statutory allocation formula provides two main benefits. First, it allows the state to link funding to each of its intended objectives. For example, if the state’s objective is to improve student retention rates, funds could be allocated to campuses based on the number of first‑year students enrolled in certain courses or the improvement in retention rates over time. Second, a statutory allocation formula ensures consistency over time, with attention maintained on the program’s objectives. For these reasons, the state typically creates a statutory allocation formula at the same time it establishes a new categorical program.
Require an Annual Program Report. Another best practice in state program design is to require reporting on whether the program is achieving its statutory objectives in a cost‑effective manner. To this end, we recommend the Legislature adopt an annual reporting requirement to track the use of current, and any new, GI funds. Specifically, we recommend each campus provide a short description of each of its program activities as well as the cost of each activity, how many students are served, and, when relevant, the utilization rate for each activity. We recommend each campus provide this information in a consistent table format, such that the report is easier for campuses to prepare, more concise, and more useful than previous GI 2025 reports. We recommend requiring the CSU Chancellor’s Office to compile these tables into one consolidated report that highlights key takeaways, including identifying which activities it found most cost‑effective in meeting each of the program’s objectives. We recommend the report be submitted to the Legislature early each spring to help inform budget deliberations.