Michael Alferes

May 1, 2026
The 2026-27 Budget
Update on Local Control Funding Formula Costs
Introduction
School Districts Report Attendance Data Three Times Per Year. California requires school districts to track the average daily attendance (ADA) of their students—the average number of students in class each day throughout the school year. School districts report their ADA to the state three times per year. The first report (known as “P-1”) covers attendance data from the beginning of the school year through December and is typically certified by the California Department of Education (CDE) in late February. The second report (known as “P-2”) runs from the beginning of the school year through April 15 and is certified in June. The third report (known as “Annual”) covers the entire school year and is certified in February of the following school year.
Attendance Affects Most State Funding for Schools. The department uses attendance data to allocate state funding for various programs, including the Local Control Funding Formula (LCFF) and special education. The role of the P-1 report is to provide an interim estimate of attendance until better data become available. For most programs, the state finalizes funding based on the P-2 attendance data. For a few programs—generally those operated by county offices of education (COEs)—the state waits to finalize funding until it receives annual data.
Post Analyzes Preliminary Data for 2025-26. In February 2026, CDE certified P-1 data for 2025-26 and annual data for 2024-25. In addition to preliminary ADA, the P-1 data also includes preliminary estimates of total LCFF costs and other associated data. In this post, we describe our findings from the updated data and the fiscal implications of this data on the Governor’s January budget LCFF estimates for 2025-26 and 2026-27.
Findings From Recent Data
2025-26 Attendance Is Tracking Lower Than Budget Projections. The Governor’s January budget assumed a 0.58 percent increase in statewide attendance from 2024-25 to 2025-26 and a 0.3 percent decline in 2026-27. The recent data released by CDE shows statewide attendance is down 0.04 percent (about 2,100 students) from 2024-25 to 2025-26—0.62 percentage points lower than the Governor’s most recent estimate.
Transitional Kindergarten (TK) Attendance Tracking Somewhat Lower Than Governor’s Budget Estimate. The Governor’s January budget assumes roughly 200,000 TK ADA for 2025-26 and about 216,000 for 2026-27. The 2025-26 P-1 data released by CDE shows roughly 196,000 TK ADA, which is tracking about 2 percent lower than the estimate included in the Governor’s budget.
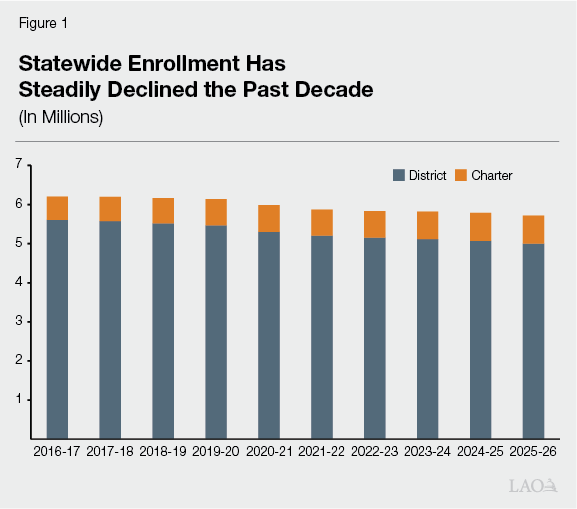
Overall Enrollment Declined Slightly. One important factor causing the drop in attendance is the statewide decrease in student enrollment. The state tracks enrollment annually on the first Wednesday in October (known as Census Day), to establish a baseline count of the number of students enrolled in each school. Census Day enrollment in 2025-26 has declined 1.2 percent (about 72,000 students) from 2024-25. As Figure 1 shows, overall enrollment for school districts and charter schools has declined 7.8 percent (close to 485,000 students) since 2016-17. Over this period, enrollment for school districts has declined about 11 percent (about 608,000 students) while charter school enrollment has increased by about 21 percent (roughly 124,000 students).
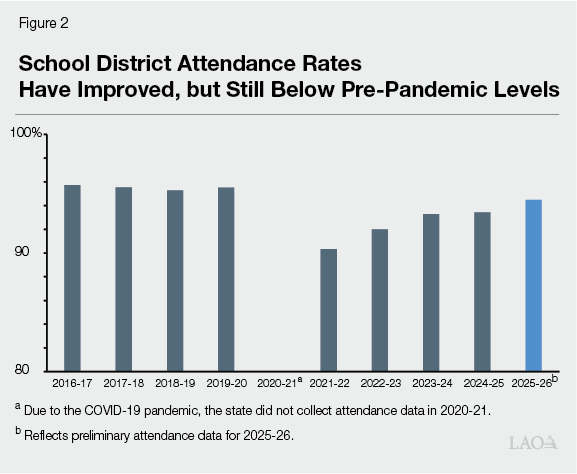
Attendance Rates Have Improved but Are Still Below Pre-Pandemic Levels. The attendance rate for school districts—the ADA for the school year divided by the Census Day enrollment—was relatively stable prior to the COVID-19 pandemic, averaging 95.7 percent from 2013-14 to 2019-20 (Figure 2). The statewide attendance rate decreased sharply during the pandemic, to a low of 90.3 percent in 2021-22. (The state did not collect attendance information in 2020-21.) Since then, attendance rates have steadily increased. The preliminary 2025-26 data shows the attendance rate for school districts increased to 94.5 percent, from 93.4 percent in 2024-25.
Minimal Attendance Recovery ADA Reported. The 2024-25 budget package created a new attendance recovery program that allows local education agencies to generate additional attendance-based funding through LCFF. Beginning July 1, 2025, school districts and charter schools are able to generate attendance-based funding by providing instruction outside of the regular school day to students in classroom-based programs who were absent from school, if they meet certain staffing and instructional requirements. The preliminary data from CDE shows school districts reported about 2,200 ADA from attendance recovery—less than 0.1 percent of total statewide ADA. This suggests that school districts have been slow to build out their attendance recovery programs or may not yet be separately reporting the associated ADA.
Districts With Declining Attendance Benefitting From Recent Changes. For funding purposes, the state credits school districts with their ADA in the current year, prior year, or the average of three prior years, whichever is higher. (This policy does not apply to charter schools.) The preliminary data for 2025-26 shows 43 percent of school districts are expected to be funded on their current year ADA, 19 percent on their prior year ADA, and 38 percent on the rolling average of their three prior years of ADA. The ability to use attendance from the prior year or the average of the three prior years results in districts being credited with roughly 74,000 more ADA (1.5 percent) than if the state funded districts on current year ADA only. Compared to 2024-25, more districts are expected to be funded on their current year ADA (up from 33 percent). This change is likely due to a number of factors, such as the expansion of TK, and pandemic-era attendance levels no longer being part of the three year rolling average calculations for school districts.
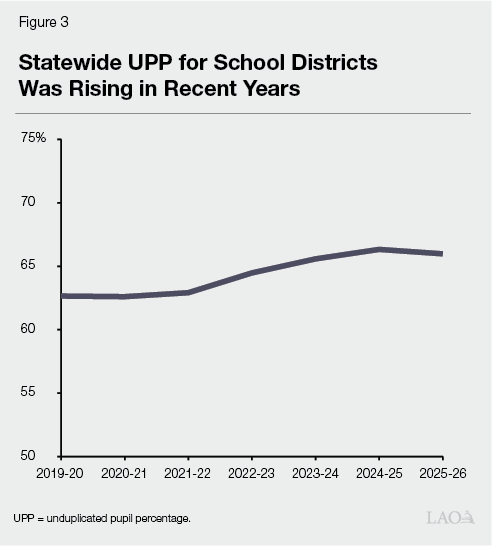
Statewide Unduplicated Pupil Percentage Down Slightly. As Figure 3 shows, the statewide share of students who are English Learners, low-income, or foster youth—commonly referred to as the unduplicated pupil percentage—has been increasing in recent years. For school districts, this percentage increased from 62.6 percent in 2019-20 to 66.3 percent in 2024-25—a 3.7 percentage point increase. For 2025-26, preliminary CDE data shows a 0.3 percent decline from 2024-25.
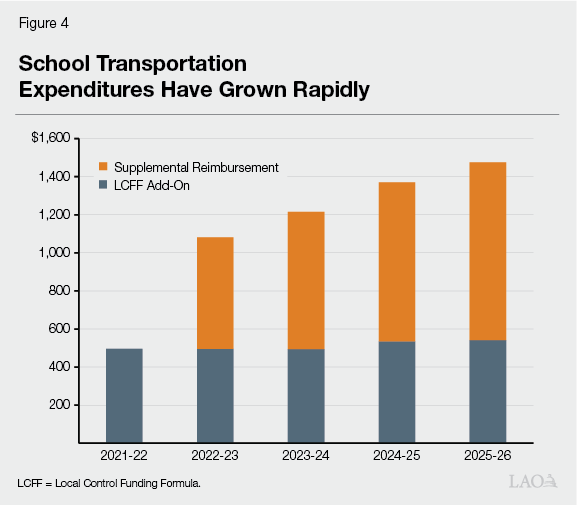
School Transportation Expenditures Have Grown Rapidly. Prior to 2022-23, school districts and COEs received an “add-on” to their LCFF allotments based on the amount of funding they received for school transportation in 2012-13. These add-ons totaled $496 million statewide. The Legislature significantly increased transportation funding in 2022-23 by establishing a new funding stream to supplement these add-ons. Specifically, school districts and COEs receive an annual allotment equal to the difference between their add-on amounts and 60 percent of the eligible transportation expenditures they reported in the previous year. As Figure 4 shows, school transportation funding has almost tripled since 2021-22. The Governor’s budget assumes $1.4 billion in transportation-related costs in 2025-26, which is $14 million lower than the amount reported in the recent data released by CDE.
Fiscal Implications
Preliminary 2025-26 LCFF Costs Are $2 Billion Below Governor’s Budget Estimates. As Figure 5 shows, the recent data from CDE shows LCFF costs $2 billion lower than the Governor’s January budget estimates. Most of the lower costs are due to lower reported ADA in P-1. The final spending levels will be affected by a number of factors, including attendance in the remaining months and the degree to which districts report higher levels of attendance recovery ADA.
Figure 5
Preliminary Data Show $2 Billion in Lower LCFF Costs in 2025‑26
(In Thousands)
|
Governor’s Budget |
Preliminary CDE Data |
Difference |
|
|
Main Components |
|||
|
Base Fundinga |
$64,762 |
$63,174 |
‑$1,588 |
|
Supplemental Funding |
8,410 |
8,248 |
‑162 |
|
Concentration Funding |
6,488 |
6,419 |
‑68 |
|
Subtotals |
($79,660) |
($77,841) |
(‑$1,818) |
|
Add‑Ons |
|||
|
School transportation |
$1,445 |
$1,459 |
$14 |
|
TIIG and Economic Recovery Target |
916 |
916 |
— |
|
Transitional kindergarten lower staffing ratios |
1,110 |
951 |
‑159 |
|
Minimum State Aid |
288 |
260 |
‑28 |
|
Otherb |
123 |
129 |
6 |
|
Subtotals |
($3,882) |
(3,715) |
(‑167) |
|
Totals |
$83,541 |
$81,556 |
‑$1,985 |
|
aIncludes funding for Necessary Small Schools. bIncludes funding related to inter‑district transfer students, support for the State Special Schools, the Education Protection Account, and $3.5 million to support the Exploratorium in San Francisco. |
|||
|
LCFF = Local Control Funding Formula; CDE = California Department of Education; and TIIG = Targeted Instructional Improvement Grant. |
|||
Lower LCFF Costs Also Likely in 2026-27. The Governor’s January budget assumes total LCFF costs of $85.8 billion, an increase of $2.7 billion from the estimated 2025-26 costs. This estimate is built off of the administration’s assumptions for 2025-26 spending. Applying the same growth and statutory cost-of-living adjustment (COLA) for 2026-27 to the lower 2025-26 costs reported by CDE results in similar cost savings of $2 billion moving forward. Actual costs will vary depending on various factors, such as the statutory COLA, changes in ADA, and attendance recovery participation.
Lower Costs Could Free Up Funding for Other School Priorities. Proposition 98 (1988) establishes a minimum funding level each year for schools and community colleges, commonly known as the minimum guarantee. The state calculates the guarantee using a set of formulas that take into account certain inputs, such as state General Fund revenue, local property tax revenue, and K-12 student attendance. Lower LCFF costs would mean that additional funding is available for the Legislature to use for other school or community college priorities. As part of the May Revision, the administration will update its estimates of the Proposition 98 minimum guarantee, as well as estimates of the costs of various school and community college programs. The exact amount of funding freed up from lower LCFF costs will depend on these other factors.