
May 6, 2026
The Rise of Remote Work:
Effects on California’s Labor Market
- Introduction
- Recent Trends in Remote Work
- Remote Work Has Transformed Wide Swath of Jobs
- Remote Work’s Effects on Labor Market
- Issues for Legislative Consideration
- Appendix
Executive Summary
Remote Work Rates Remain Much Higher Than Before Pandemic. Remote work expanded rapidly in the early part of the COVID‑19 pandemic. As health restrictions eased and many people returned to in‑person work, the share of people working remotely declined. Since 2023, these declines have slowed, resulting in persistently higher rates of remote work. Today, one‑eighth of all California employees work mainly from home—three times as many as in 2019.
Remote Work Has Transformed Wide Swath of Jobs. The expansion of remote work has been especially pronounced for four key job groups: technology, finance and accounting, business and government operations, and sales and marketing. Roughly one‑third of workers in these jobs are now fully remote.
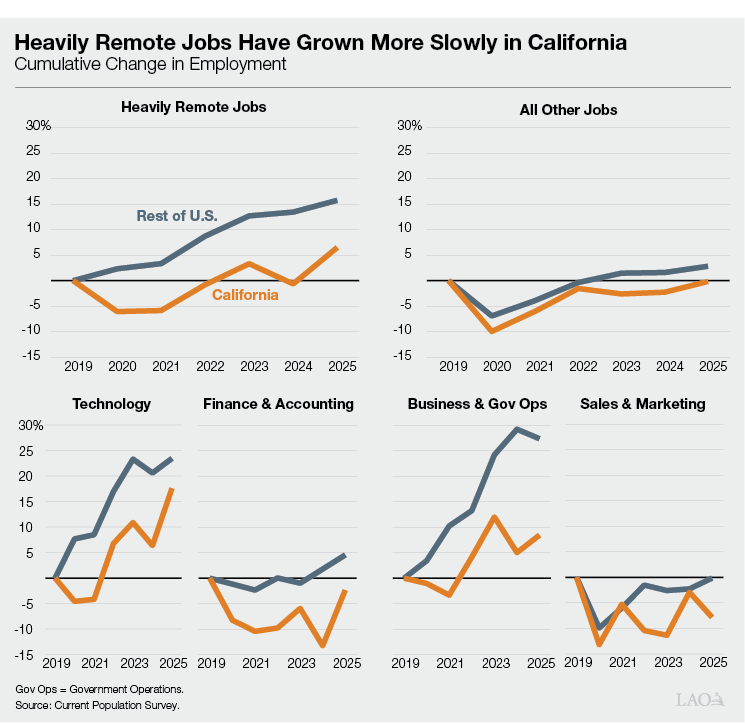
Heavily Remote Jobs Have Grown More Than Twice as Fast Outside California. Since the pandemic, the state’s job growth in fields that are not heavily remote has tracked somewhat closely with the national trend (top right panel in the figure below). Yet in heavily remote jobs, employment has grown 16 percent in the rest of the U.S. but just 7 percent in California (top left). Across each of the heavily remote job groups, the state’s job growth has lagged behind the rest of the country (bottom four panels).
Since Pandemic, Workers in These Jobs Have Been Leaving California. Before the pandemic, more workers in heavily remote job groups moved to California than left. Since the pandemic, this pattern has reversed, with more of these workers moving out of California than in.
Remote Work Has Altered the Labor Market Landscape. California has long benefited from a concentration of industries that define the information economy and have attracted skilled workers and investment money from around the world. This has always presented trade‑offs: compared to other states, California’s workers face a higher cost of living but tend to earn higher wages. Employers, for their part, face higher costs but gain access to talented workers and industry clusters. The rise of remote work has changed the way workers and employers balance these competing forces. Employers who once recruited locally can now draw from a national pool of workers. Workers who would have come to California to pursue these opportunities can now live elsewhere. This labor market transformation heightens the urgency of discussions about improving California’s affordability and quality of life. It also raises new questions, such as how to support affected workers and how to tax income earned from remote work.
Introduction
For decades, California’s economy has benefited from a concentration of industries that define the information economy: technology, finance, marketing, and business operations. Dense industry and university networks, especially in the Bay Area and parts of Southern California, have attracted skilled workers and investment money from around the world. These factors have compounded over time, generating the wages, tax revenue, and economic activity that have helped make the state prosperous.
The rise of remote work has weakened this economic engine. As work in these fields has become less connected to physical location, the geographic link between these industries and their workers—software developers, accountants, human resources workers, financial advisors, information systems managers, and many others—has decoupled. Employers who once recruited locally can now draw from a national pool of workers. Workers who would have come to California to pursue these opportunities can now live elsewhere. In this report, we describe trends in remote work in California and examine key implications for workers in certain types of jobs. (This includes some government workers, but the report does not evaluate the merits of the state government’s remote work policies.)
The first section of the report summarizes overall trends in remote work in California and the U.S. The second section looks at the types of jobs that have been transformed by remote work. Subsequent sections examine how the rise of remote work has changed California’s labor market and raise issues for legislative consideration.
Recent Trends in Remote Work
COVID‑19 Pandemic Led to Dramatic Growth in Remote Work
Pandemic Severely Disrupted In‑Person Work. COVID‑19 reached California in late January 2020. As the virus spread across the state, policy responses—such as school closures and shelter‑in‑place orders—placed major limits on in‑person work activity. For many workers and employers, the pandemic necessitated the rapid adoption of video meetings, chat channels, cloud storage, online project coordination, and e‑signatures. In just weeks, jobs that involved analyzing, overseeing, or managing digital information no longer needed to happen in a specific location. (In the box nearby, we define remote work and related terms used in this report.)
Key Definitions
Information About Remote Work Comes Mainly From Two Surveys. Our assessment of remote work relies mainly on two national surveys, the Current Population Survey (CPS) and the American Community Survey (ACS). The CPS is a monthly survey designed to provide timely information about U.S. labor markets. The ACS is a larger annual survey that covers a wider range of economic and demographic topics, such as migration. To make the best use of the data, this report considers a few distinct concepts related to remote work, which we define below.
Remote Work. We define remote work as work that an employee performs when they are not at an employer’s work site or at the same location as a client or customer. Since October 2022, the CPS has asked workers whether they teleworked or worked from home at any point during the prior week. Workers who teleworked or worked from home also report how many hours they teleworked or worked from home and how many hours they worked overall. We classify workers as fully remote if they teleworked or worked from home for all their reported hours.
Work From Home. We define work from home as work performed at the place where the employee lives. The ACS asks workers how they usually get to work, with “worked from home” as one option. This captures regular work patterns over the course of the year, so we consider workers mainly remote if they gave this answer. For many types of jobs, this likely is a good proxy for remote work, but there are some notable exceptions. On one hand, these responses do not include remote work performed in other locations, such as co‑working spaces, libraries, or coffee shops. On the other hand, they also include non‑remote workers who happen to work at home, such as in‑home childcare providers and self‑employed artists. To address the latter issue, our analysis focuses on jobs with relatively low rates of self‑employment.
Hybrid Work. Hybrid workers work some hours remotely and some hours in person. We can identify these workers in the CPS but not in the ACS. These workers are not the focus of this report because, unlike fully remote workers, they remain geographically connected to their employer’s location.
Key Indicators of Remote Work Grew Rapidly in Early Part of Pandemic. Figures 1 and 2 show how key measures of remote work changed over the first couple of years of the pandemic. Figure 1 displays the share of employees who worked mainly from home before and after the pandemic. These data come from the American Community Survey (ACS), a very large household survey covering a wide range of demographic and economic issues. The figure shows that the share of employees working mainly from home was growing gradually before the pandemic, reaching 4 percent by 2019. As described above, the pandemic accelerated this growth dramatically. By 2021, this number had risen to 21 percent in California and 16 percent in the rest of the country. If remote work instead had continued its gradual pre‑pandemic growth trend, it would have taken many years to reach these levels.
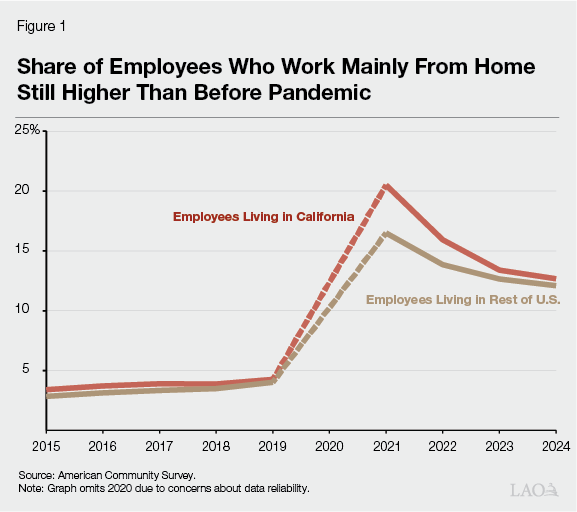
The data in Figure 1 have a couple of notable limitations. One is that they identify California‑based workers but not California‑based employers. Another is that they omit 2020 because the pandemic disrupted household surveys, so they do not tell us how remote work changed in the turbulent early months of the pandemic.
Figure 2 complements Figure 1 with some data on the share of online job postings that offer remote (including hybrid) work. These data reflect the employer’s location. The figure shows that some employers responded very quickly to changing conditions in the early months of the pandemic. In particular, the number of ads offering remote work roughly doubled from March 2020 to April 2020.
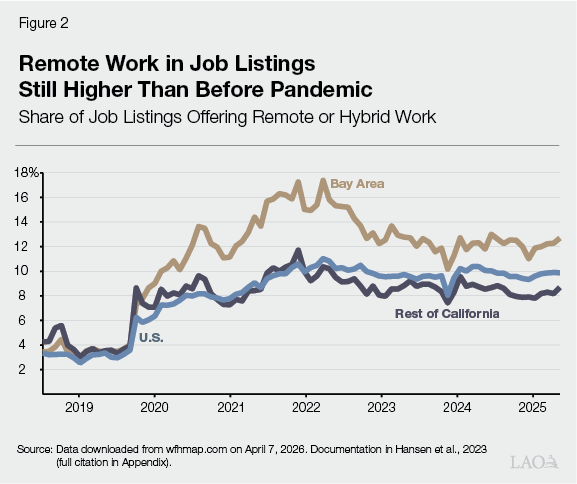
In First Year of Pandemic, Measure Based on Job Ads Grew Faster in Bay Area. After April 2020, jobs posted by Bay Area employers followed a noticeably different trend from the rest of the state and the nation. After rising from 4 percent in March to 7 percent in April, remote work offerings by Bay Area employers continued to grow at a fast clip, exceeding 13 percent by February 2021. In contrast, after the sharp uptick in April 2020, remote work offerings by employers in other parts of the state and the nation grew more modestly and were still below 10 percent in February 2021.
Remote Work Rates Still Much Higher Than Before Pandemic
In recent years, much of the public discourse about remote work has focused on its purported decline, sometimes called return‑to‑office. We find:
- Key indicators of remote work declined from their early‑pandemic peak to 2023.
- Declines in remote work since 2023 have been quite modest.
- Rates of remote work remain elevated far above pre‑pandemic levels.
In the rest of this section, we discuss these findings in more detail.
Declines Through 2023. In Figure 1, the share of employees working mainly from home peaked in 2021. From 2021 to 2023, the work‑from‑home share dropped from 21 percent to 13 percent in California and from 16 percent to 13 percent in the rest of the country. In Figure 2, the share of job listings offering remote work peaked around mid‑2022. At this point, 16 percent of Bay Area employers’ listings offered remote work, compared to 11 percent in the rest of the state and nationwide. By the middle of 2023, remote work offerings had dropped to 13 percent in the Bay Area, 8 percent in the rest of the state, and 10 percent nationwide.
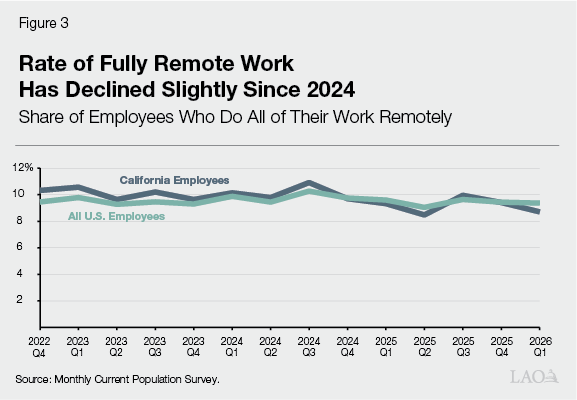
Rather Modest Declines Since 2023. Since October 2022, the Current Population Survey (CPS), a major monthly labor market survey, has asked respondents about remote work. In our view, this is the most reliable ongoing measurement of remote work at the state and national level. Figure 3 tracks the share of employees who report fully remote work in the CPS each quarter. From 2023 through early 2026, the nationwide rate of fully remote work held steady around 9 percent, while the rate for California residents declined from 10 percent to 9 percent. Similarly, Figure 1 shows that the statewide and nationwide work‑from‑home rates in the ACS dropped by less than 1 percentage point from 2023 to 2024, and Figure 2 shows barely perceptible declines in remote work offerings from 2023 to 2025.
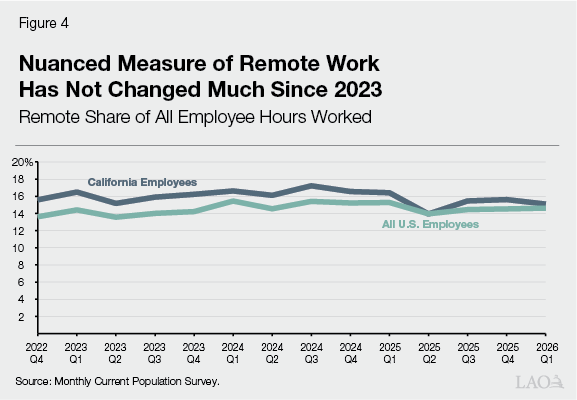
Nuanced Measure Suggests Return‑to‑Office Has Not Been Widespread. So far, we have reviewed relatively coarse, binary measures of remote work—a job is either remote or it is not. In practice, however, discussions about return‑to‑office often focus on more nuanced, continuous measures of remote work, such as reducing remote work from five days a week to three. With the CPS data, we can look at remote work trends in a way that accommodates this nuanced continuum. To do this, we look at two key metrics: (1) the total number of hours that all employees work; and (2) the number of hours that employees work remotely. We take (2) and divide it by (1) to get the remote share of all employee work hours, a number that should capture any movements in the continuum between working remotely and in person.
Figure 4 displays statewide and nationwide trends in the remote share of all employee hours. Throughout the period from 2023 through early 2026, the nationwide share has held steady around 14 percent to 15 percent. The California share currently is around 15 percent, about 1 to 2 percentage points below its 2024 peak. These numbers suggest that the overall scale of recent return‑to‑office has been limited.
Remote Work Remains Much More Prevalent Than Before Pandemic. Looking back over Figures 1 and 2, we can see that the most recent data show rates of remote work that far exceed 2019 levels. In 2024, 13 percent of California employees and 12 percent of U.S. employees worked mainly from home—triple the pre‑pandemic rates. Twelve percent of jobs posted by Bay Area employers, 8 percent by other California employers, and 10 percent nationwide offered remote work—also much higher than before the pandemic.
Remote Work Has Transformed Wide Swath of Jobs
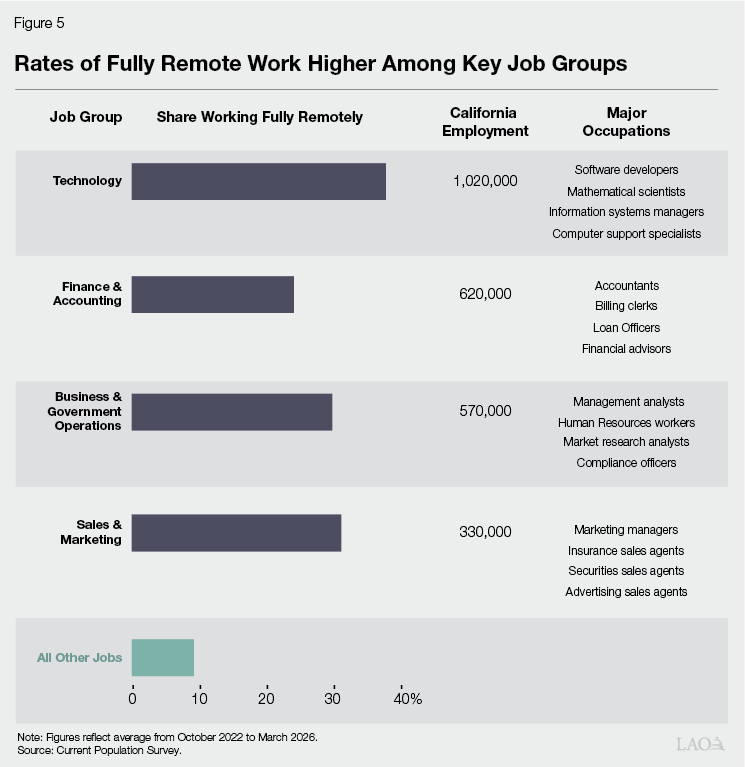
Remote Work Has Become Commonplace for Many Types of Jobs. The new, higher overall prevalence of remote work is driven by dramatic structural changes towards remote work in several key groups of jobs. Most workers in these roles produce or oversee information, analysis, communication, or decisions rather than physical goods or services. These jobs tend to be well‑compensated—on average, they pay hourly wages that are twice as high as other jobs. Figure 5 shows rates of remote work for the job groups that have undergone the largest structural changes: technology jobs, finance and accounting jobs, business and government operations jobs, and sales and marketing jobs. Workers in the technology group were most likely to work remotely (38 percent of workers), followed by sales and marketing (31 percent), business and government operations (30 percent), and finance and accounting (24 percent). These four groups include roughly 2.6 million California workers, or about 1 in 7 workers statewide. In this report, we refer to these groups as “heavily remote.” (See the appendix for more detail about these job groups.)
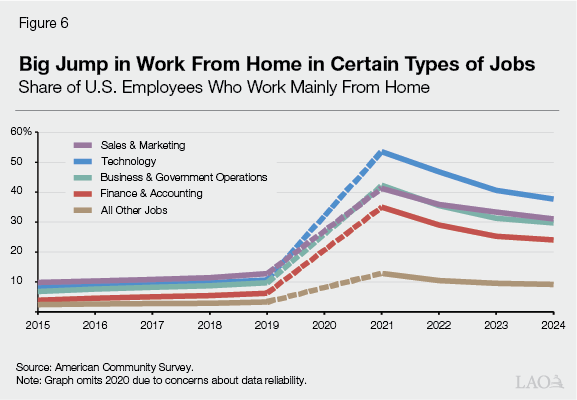
Remote Work Rates Jumped During Pandemic, Signaling New Work Environment for These Jobs. Figure 6 tracks work from home in heavily remote job groups over time. Even before the pandemic, workers in these job groups were more likely to work from home than other workers. Nevertheless, more than 90 percent of these workers worked in person. Pandemic stay‑at‑home orders brought about the widespread adoption of remote work among these job groups. By 2021, between 35 percent and 55 percent of workers in each heavily remote job group were working from home. Rates of remote work then declined in 2023, after health restrictions had eased. Since 2023, these employers and workers—now accustomed to remote work arrangements—appear to have settled into persistent, higher rates of remote work.
Likelihood of Working in These Jobs Varies by Age and Race. Before we examine the labor market consequences of this shift to remote work, we will take a closer look at which Californians are most likely to be affected. Figure 7 displays the shares of various demographic groups that work in the heavily remote groups of jobs identified above. As shown in the figure:
- Workers age 25 and up are more than twice as likely to work in these jobs as those under 25.
- Asian/Pacific Islander workers are about three times as likely to work in these jobs as Latino workers, with other racial/ethnic groups falling in between those extremes.
- Men and women are about equally likely to work in these jobs.
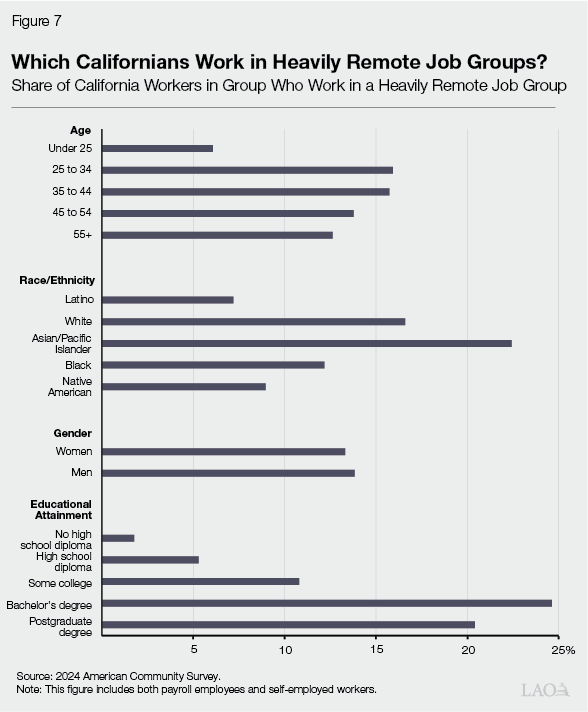
Likelihood of Working in These Jobs Varies by Educational Background. Rates of work in these jobs vary most dramatically by educational background. Workers with a bachelor’s degree but no postgraduate degree are 14 times as likely to work in these jobs as workers without a high school diploma, and four and a half times as likely to work in these jobs as workers who graduated from high school but did not attend college. Workers with a postgraduate degree are more likely to work in these jobs than most groups, but somewhat less likely than those with just a bachelor’s degree.
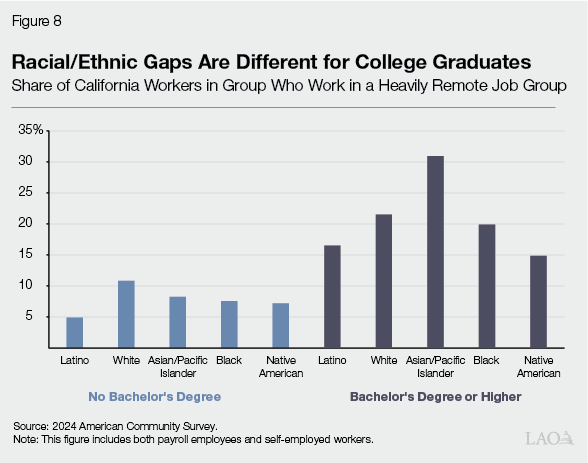
Racial Differences Vary by Educational Background. In Figure 8, we take a closer look at the overlap between race/ethnicity and educational background. Among Californians who do not have a bachelor’s degree, white workers are somewhat more likely to work in one of the heavily remote job groups than other workers. Among workers with at least a bachelor’s degree, however, Asian/Pacific Islander workers are by far the most likely to work in one of the heavily remote job groups.
Remote Work’s Effects on Labor Market
In this section, we first look at employment and migration trends for the heavily remote job groups described above. We then discuss some of the economic forces that could be driving these trends.
Employment Trends
Heavily Remote Jobs Have Grown More Than Twice as Fast Outside California. Figure 9 displays job growth trends in California and the rest of the U.S. for heavily remote jobs and all other jobs. The two main figures demonstrate that the number of California non‑remote jobs has tracked somewhat closely with the national trend, yet the number of California heavily remote jobs has not kept pace with growth seen in the rest of the country. Relative to 2019, California has added 160,000 (7 percent) heavily remote jobs. Meanwhile, the rest of the U.S. has seen 2.6 million (16 percent) new heavily remote jobs.
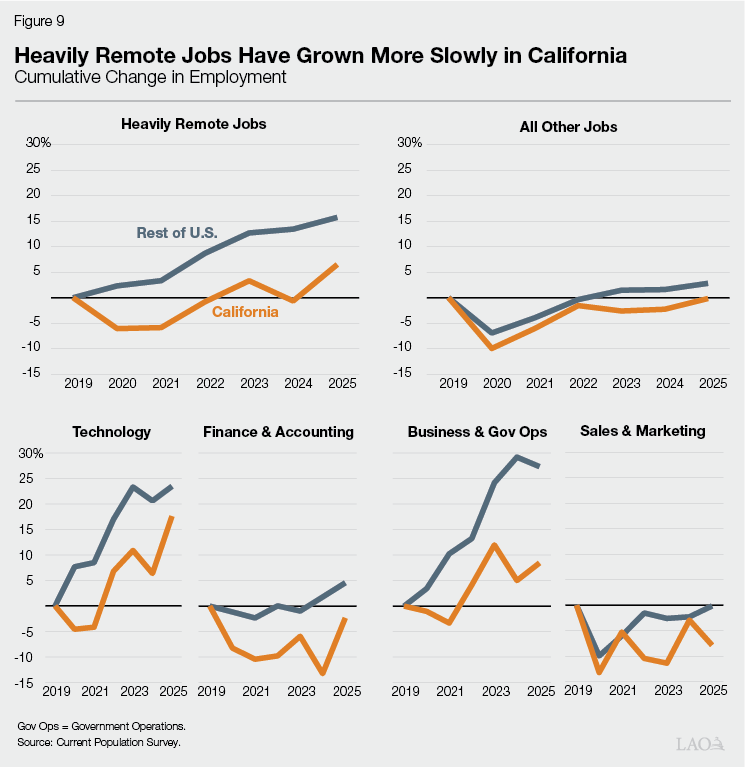
California Job Growth Slower Across Each Heavily Remote Job Group. The four smaller graphs in Figure 9 show the same comparison for each of our four main job groups: technology, finance and accounting, business and government operations, and sales and marketing. In each case, heavily remote jobs have grown faster outside of California than within California since the pandemic started.
Among Job Groups, Gap Largest for Business and Government Operations. Had California heavily remote job growth kept pace with the rest of the country, the state would have added about 200,000 more heavily remote jobs than it has. Nearly half (90,000) of “missing” jobs are within the business and government operations group, while the remaining gap is distributed evenly among technology jobs, finance and accounting jobs, and sales and marketing jobs.
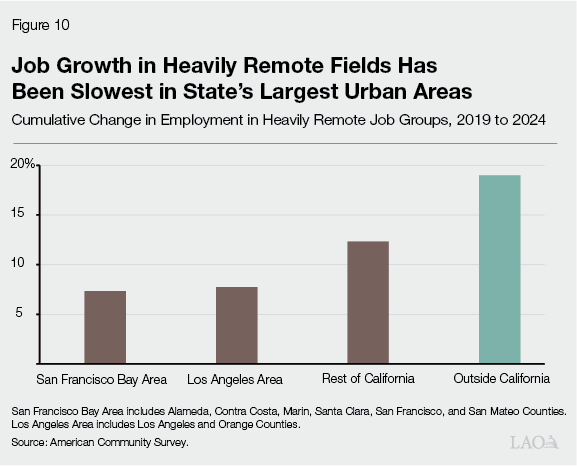
Within California, Slowdown Driven by Lagging Job Growth in Largest Urban Areas. Figure 10 compares the pace of recent job growth in heavily remote roles for different parts of the state and the rest of the U.S. Heavily remote roles have grown more slowly in the six‑county Bay Area and the Los Angeles area (Los Angeles and Orange Counties), while growing somewhat faster in the less urban parts of the state.
Migration Trends
Before Pandemic, Workers in These Jobs Were Coming to California. Overall, the number of people leaving California has consistently exceeded the number of people coming here from other states for about a quarter‑century. Against this backdrop, heavily remote job groups once served as a bright spot. As shown in Figure 11, before the pandemic, around 55,000 workers in these job groups would move to California in a typical year, while 50,000 would move to other states, yielding a net inflow of 5,000 workers.
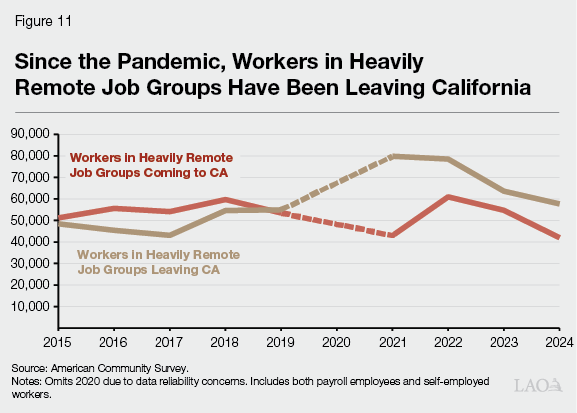
Since Pandemic, Workers in These Jobs Have Been Leaving California. As shown in the figure, the pandemic changed both the inflow and the outflow of workers in these job groups. In 2021, 43,000 of these workers moved to California from other states, while 80,000 left—a net outflow of 37,000 in that year alone. After 2021, the net outflow of these workers shrank but has remained substantial.
Fewer Workers in Heavily Remote Jobs Moving to Largest Urban Areas From Other States… In Figure 12, we look at net migration separately for California’s largest urban areas (the Bay Area and the Los Angeles area) and the rest of the state. We can see that the net positive migration of these workers to California before the pandemic was concentrated entirely in these urban areas. By 2019, however, net migration from other states to these urban areas already was declining substantially. The pandemic accelerated this trend, resulting in net outflows. These net outflows from the major urban areas to other states were biggest in 2021 but remain substantial.
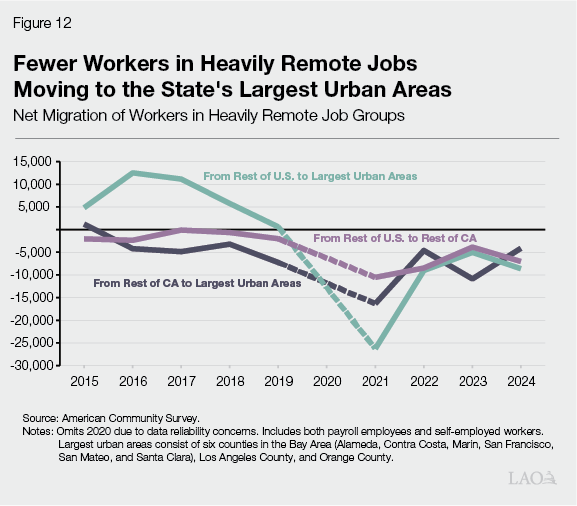
…And From Other Parts of California. Even before the pandemic, Californians in these heavily remote occupations were somewhat more likely to migrate outward from California’s largest urban areas to other parts of the state than to migrate inward. This net outflow from the largest urban areas accelerated in 2021, driven entirely by workers moving out of these urban areas. The number of workers moving into these areas from other parts of California remained close to the pre‑pandemic average.
What Economic Forces Are Driving These Trends?
Before we turn to a brief discussion of potential policy implications, we consider some economic forces that underlie employers’ and workers’ decisions and likely have contributed to California’s weak growth in heavily remote jobs.
Wages Are Higher in California. At a basic level, an employer’s decision to hire a worker depends on the worker’s productivity relative to the costs of employing them. Productivity and some employment costs are hard to measure, but data on wages are readily available. Figure 13 shows pre‑pandemic wages for heavily remote jobs in California compared to wages for the same jobs in the rest of the U.S. For most of these jobs, wages tend to be higher in California. All else equal, this means employers can reduce their costs by moving jobs elsewhere.
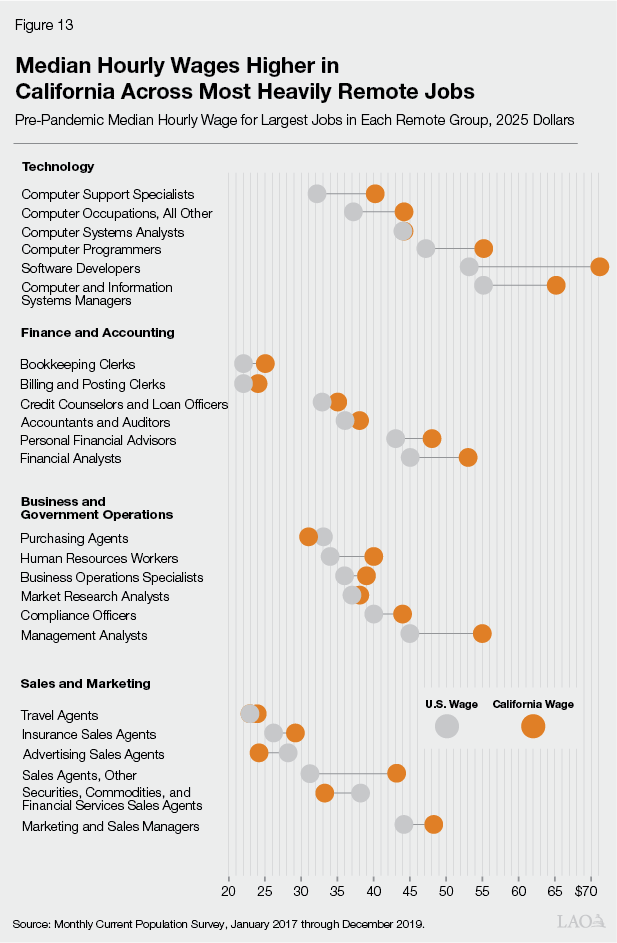
Higher Wages Typically Come With Higher Productivity. Many California employers also have locations elsewhere, and many California businesses compete directly against businesses elsewhere. These competitive forces put pressure on employers to reduce costs, yet they nevertheless have paid higher wages in California. This suggests that hiring these workers likely has provided a commensurate benefit—namely, higher productivity.
Living in California Is Expensive. Historically, jobs have been one of the main factors driving people’s decisions about where to live. California’s largest urban areas are expensive, yet many have been willing to pay these high costs in exchange for labor market opportunities and other amenities.
Remote Work Has Altered the Landscape. The widespread adoption of remote work arrangements has changed the way employers and workers balance the competing forces described above. This has altered the landscape of the state’s labor market in several ways, each with potentially different policy implications:
- California Workers Can Move to Less Expensive Places Without Losing Access to Jobs. California‑based fully remote workers can keep their jobs but leave the state. Their decisions about where to live may no longer depend on their employer’s location. For example, an advertising sales representative employed by an Orange County company can now relocate to another state and retain their job.
- Out‑of‑State Workers Can Access California Jobs Without Taking on Higher Living Costs. Out‑of‑state applicants for many California‑based roles no longer must move to California and instead can remain in their current location, working remotely. For example, a graduating computer science major in Austin, Texas could start their career with a Sunnyvale company without leaving Texas, as they would have been expected to before the pandemic.
- Workers Who Remain in California Face Greater Competition. Californians competing for remote roles with in‑state employers now face competition from applicants across the country. For example, a longtime San Diego resident competing for a remote public relations position may lose out to a candidate from elsewhere.
- California Employers Can Hire Workers Across the Country. California employers can now hire remote workers from a national labor pool rather than a regional labor pool. Businesses that once needed to attract workers who reside in higher‑cost areas of California can now hire from anywhere in the country. For example, a San Jose financial services company hiring a remote operations manager no longer needs to limit its search to candidates in Silicon Valley. Accessing this broader pool of workers can make it easier for businesses to find high‑productivity workers at lower costs.
- Employers May Have Less Incentive to Locate in Industry Hubs. In a world dominated by in‑person interactions at work and elsewhere, workers and businesses become more productive when they are close together—a phenomenon that economists call “agglomeration.” This productivity boost can be an additional factor drawing employers to the largest urban areas. The rise of remote work—and the broader shift from in‑person interaction to online interaction—could diminish the economic benefits of agglomeration.
Migration Accounts for Large Part of Jobs Trend. Some of the ways that remote work has contributed to weak job growth in California involve changes in migration, while others do not. We can get a rough sense of the importance of migration by combining some of the information presented earlier in Figures 9 and 11:
- From 2019 to 2024, if California’s employment in heavily remote job groups had grown at the nationwide rate, the state would have had 200,000 more jobs in 2024 than it actually had. This is the basic “jobs gap” that we are trying to explain.
- If workers in heavily remote job groups had continued to move into the state at the same rate as before the pandemic, the state would have had around 25,000 more of these workers in 2024. This suggests that the lower inflow of workers accounts for about one‑eighth of the jobs gap.
- If workers in heavily remote job groups had continued to move out of the state at the same rate as before the pandemic, the state would have lost fewer people and had around 100,000 more of these workers in 2024. This suggests that the higher outflow of workers accounts for about half of the jobs gap.
Remainder Driven by Employer Shifts to Hiring Out‑of‑State Applicants. As described above, people moving into and out of California account for slightly more than half of the overall jobs gap we identify in heavily remote job groups. The rest of the gap is the result of employer choices during the era of remote work to hire applicants who live outside California when previously they may have hired an in‑state resident for these roles.
Issues for Legislative Consideration
Remote Work Has Transformed California’s Labor Market. Recent artificial intelligence advances have captured policymakers’ interest as observers try to anticipate the technology’s potential to displace workers across many types of jobs. While this possibility remains on the horizon, another labor market transformation has already taken hold—the rise of remote work. For many jobs, remote work has quietly restructured where Californians work, where they live, and where employers look to hire.
How Can the State Attract and Retain Remote Workers? Remote workers can now make decisions about where to live based more heavily on quality of life and cost of living. To the extent that the state’s high housing costs and overall cost of living have contributed to out‑migration of remote workers, the rise of remote work heightens the urgency of discussions about improving California’s affordability and quality of life.
What Tools Does the State Have to Support Affected Workers? With remote work expanding the pool of workers available to California‑based employers, California workers face broader competition for positions for which they once may have been top candidates. This could lead to new types of labor market dislocation. The state’s longstanding retraining programs for dislocated workers tend to focus on in‑person manufacturing and energy plant closures—for example, when a local oil refinery closes. This approach may not be well‑calibrated to assisting workers in heavily remote jobs. Additionally, for higher‑wage workers who become unemployed due to the remote work transformation, California’s Unemployment Insurance (UI) benefits might not support them long enough to find another job in their field. The state limits UI benefits to $450 per week, well below the wages that many higher‑income technology, finance, operations, and sales workers typically earn.
Should the State Revisit How It Taxes Income From Remote Work? Under longstanding tax policy, the state taxes income mainly based on where workers are physically located while they are working. Workers who leave the state retain their California employment but no longer owe state income taxes. Likewise, out‑of‑state workers who take a remote job with a California employer owe no taxes. Several states, including New York, have begun to tax earnings paid by in‑state employers regardless of where the work is performed. Such an approach could expand the state’s income tax base but is not without risks. For one, taxing remote income would make it more difficult for California employers to hire out‑of‑state remote workers. If employers responded by leaving the state entirely, they would take their business income—another key source of tax revenue—with them. Additionally, such a policy might compel other states to respond with reciprocal taxes on California residents who work remotely for employers in those states. This could offset any revenue benefits and needlessly complicate the tax system for workers and employers.
Appendix
Classification of Jobs
Appendix Figure 1
List of Job Group Occupations
|
Technology |
Total Employment |
Remote Share |
|
Software Developers |
460,000 |
33% |
|
Computer Occupations, All Other |
120,000 |
27 |
|
Computer and Information Systems Managers |
80,000 |
36 |
|
Miscellaneous Mathematical Science Occupations |
70,000 |
37 |
|
Computer Support Specialists |
70,000 |
37 |
|
Computer Systems Analysts |
60,000 |
35 |
|
Computer Programmers |
42,000 |
38 |
|
Web Developers |
24,000 |
58 |
|
Operations Research Analysts |
22,000 |
22 |
|
Information Security Analysts |
19,000 |
37 |
|
Network and Computer Systems Administrators |
18,000 |
21 |
|
Database Administrators |
13,000 |
41 |
|
Computer Network Architects |
11,000 |
35 |
|
Computer and Information Research Scientists |
7,000 |
25 |
|
Actuaries |
2,000 |
44 |
|
Total Employment |
1,020,000 |
|
|
Business and Government Operations |
Total Employment |
Remote Share |
|
Management Analysts |
120,000 |
41% |
|
Human Resources Workers |
110,000 |
30 |
|
Market Research Analysts and Marketing Specialists |
80,000 |
32 |
|
Business Operations Specialists, All Other |
60,000 |
22 |
|
Compliance Officers |
32,000 |
22 |
|
Purchasing Agents, Except Wholesale, Retail, and Farm Products |
27,000 |
13 |
|
Claims Adjusters, Appraisers, Examiners, and Investigators |
23,000 |
41 |
|
Meeting, Convention, and Event Planners |
22,000 |
12 |
|
Cost Estimators |
21,000 |
7 |
|
Logisticians |
20,000 |
11 |
|
Wholesale and Retail Buyers, Except Farm Products |
19,000 |
12 |
|
Training and Development Specialists |
13,000 |
34 |
|
Fundraisers |
12,000 |
22 |
|
Agents and Business Managers of Artists, Performers, and Athletes |
7,000 |
31 |
|
Compensation, Benefits, and Job Analysis Specialists |
5,000 |
35 |
|
Total Employment |
570,000 |
|
|
Finance and Accounting |
Total Employment |
Remote Share |
|
Accountants and Auditors |
190,000 |
26% |
|
Bookkeeping, Accounting, and Auditing Clerks |
140,000 |
18 |
|
Personal Financial Advisors |
49,000 |
29 |
|
Billing and Posting Clerks |
38,000 |
33 |
|
Financial Analysts |
35,000 |
19 |
|
Credit Counselors and Loan Officers |
33,000 |
30 |
|
Financial Clerks, All Other |
21,000 |
18 |
|
Payroll and Timekeeping Clerks |
21,000 |
20 |
|
Tax Preparers |
18,000 |
20 |
|
Financial Specialists, All Other |
13,000 |
22 |
|
Insurance Underwriters |
13,000 |
38 |
|
Appraisers and Assessors of Real Estate |
11,000 |
21 |
|
Loan Interviewers and Clerks |
9,000 |
36 |
|
Tax Examiners and Collectors, and Revenue Agents |
8,000 |
15 |
|
Budget Analysts |
8,000 |
3 |
|
Bill and Account Collectors |
5,000 |
6 |
|
Credit Analysts |
5,000 |
20 |
|
Procurement Clerks |
5,000 |
30 |
|
Financial Examiners |
2,000 |
33 |
|
Total employment |
620,000 |
|
|
Sales and Marketing |
Total Employment |
Remote Share |
|
Marketing and Sales Managers |
150,000 |
26% |
|
Sales Representatives, Services, All Other |
80,000 |
33 |
|
Insurance Sales Agents |
60,000 |
31 |
|
Securities, Commodities, and Financial Services Sales Agents |
22,000 |
39 |
|
Advertising Sales Agents |
11,000 |
34 |
|
Travel Agents |
7,000 |
37 |
|
Total Employment |
330,000 |
|
|
Employment is average number of jobs in California from October 2022 through March 2026. |
||
Selected References
Agrawal, David R. and Jan K. Brueckner (2025). “Taxes and Telework: The Impacts of State Income Taxes in a Work‑From‑Home Economy.” Journal of Urban Economics 145.
Agrawal, David R. and Kirk J. Stark (2022). “Will the Remote Work Revolution Undermine Progressive State Income Taxes?” Virginia Law Review 42.
Akan, Mert, Jose Maria Barrero, Nicholas Bloom, Tom Bown, Shelby Buckman, Steven J. Davis, and Hyoseul Kim (2025). “The New Geography of Labor Markets.” National Bureau of Economic Research Working Paper 33582.
Bick, Alexander, Adam Blandin, Aidan Caplan, and Tristan Caplan (2025). “Measuring Trends in Work From Home: Evidence from Six U.S. Datasets.” Federal Reserve Bank of St. Louis Review, Fourth Quarter 2025.
Bick, Alexander, Adam Blandin, Karel Mertens, and Hannah Rubinton (2024). “Work From Home and Interstate Migration.” Federal Reserve Bank of St. Louis Working Paper 2024‑012A.
Boarnet, Marlon, Andre Comandon, Seva Rodnyansky, Marley Randazzo, and Bonnie Wang (2024). “The Impact of Remote Work on Job and Housing Location in the Bay Area‑Central Valley Region: An Analysis of the Relationship Between Traffic, Telecommuting, and Migration During and After COVID‑19.” Pacific Southwest Region University Transportation Center.
Hansen, Stephen, Peter John Lambert, Nicholas Bloom, Steven J. Davis, Raffaella Sadun, and Bledi Taska (2023). “Remote Work Across Jobs, Companies, and Space.” National Bureau of Economic Research Working Paper 31007.
Li, Wenli and Yichen Su (2026). “The Great Reshuffle: Remote Work and Residential Sorting.” European Economic Review 182.
Liu, Sitian and Yichen Su (2025). “The Effect of Working from Home on the Agglomeration Economies of Cities: Evidence from Advertised Wages.” Review of Economics and Statistics, forthcoming.