Part 1
In this part of the report, we analyze major budget issues involving Proposition 98, which largely governs how much funding is provided for K–12 education, child care and development (CCD), and the California Community Colleges (CCC). Voters enacted Proposition 98 in 1988 as an amendment to the California Constitution. The measure, which was later modified by Proposition 111, establishes a minimum annual funding level to support K–14 education. Proposition 98 funding constitutes around two–thirds of total K–14 funding, with the remainder of support coming from federal funds, special funds (such as lottery revenues), fee revenue (such as CCC enrollment fees), and non–Proposition 98 General Fund dollars (which are largely dedicated to debt service on school facilities and costs for teacher retirement).
We begin this part by providing some background information on the mechanics of Proposition 98. We then discuss an ongoing controversy regarding certain constitutional provisions relating to Proposition 98. Next, we summarize the Governor’s Proposition 98 plan as well as provide our assessment of that plan. Lastly, we offer an alternative plan intended to provide the Legislature with more options for crafting its education budget.
The minimum Proposition 98 funding requirement—commonly called the minimum guarantee—is determined by one of three formulas (or “tests”) set forth in the Constitution. Figure 1 briefly explains these tests. The five major factors underlying the Proposition 98 tests are (1) General Fund revenues, (2) state population, (3) personal income, (4) local property taxes, and (5) K–12 average daily attendance (ADA). In most years, the key determinants of the Proposition 98 minimum guarantee are changes in K–12 ADA, per capita personal income, and per capita General Fund revenues.
Figure 1
Proposition 98 Basics
|
|
|
Three Formulas (“Tests”) Used to Determine K–14 Funding:
|
|
Test 1—Share of General Fund. Provides roughly 40 percent of General Fund revenues to K–14 education. From 1988–89 through 2007–08, this test was applied only once (1988–89).
|
|
Test 2—Growth in Per Capita Personal Income. Adjusts prior–year funding for changes in attendance and per capita personal income. This test was operative 13 of the last 20 years.
|
|
Test 3—Growth in General Fund Revenues. Adjusts prior–year funding for changes in attendance and per capita General Fund revenues. Generally, this test is operative when General Fund revenues grow more slowly than per capita personal income. This test was operative 6 of the last 20 years.
|
Applicable Test Determined Automatically. The applicable test used to determine the Proposition 98 minimum guarantee is triggered automatically depending on the inputs. Until inputs are finalized (which can take up to 12 months after the close of a fiscal year for revenue and K–12 attendance factors), the applicable test can fluctuate and the minimum guarantee can change significantly.
State Can Provide More or Less Than Minimum Guarantee. Although the Proposition 98 tests apply automatically, the Legislature can provide more or less funding than the tests require. For example, in 1999–00, when state revenues were booming, the Legislature decided to spend $1.8 billion more than the minimum guarantee. Alternatively, in 2004–05, the Legislature suspended the minimum guarantee and provided less than would have been required. To suspend the minimum guarantee requires a two–thirds vote of each house of the Legislature and creates out–year obligations to return K–14 funding to where it otherwise would have been absent the suspension.
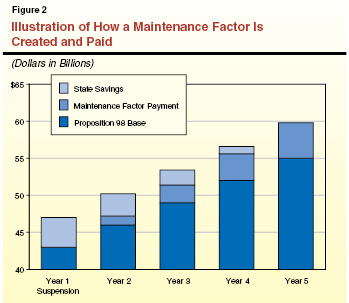
State Creates “Maintenance Factor” Obligation in Certain Years. Over the long run, Proposition 98 has grown annually by attendance and growth in the economy (Test 2). The provisions of Proposition 98 allow the state to provide less funding than the Test 2 level in certain situations. This has occurred in Test 3 or suspension years. In these years, the state has created a maintenance factor obligation—a long–term commitment to restore Proposition 98 funding to what it otherwise would have been had funding been determined by Test 2. The state keeps track of the total amount of funding required to return schools to funding levels had it grown with the economy. At the end of 2007–08, the state had an outstanding maintenance factor obligation of $1.3 billion. As we will discuss later, the outstanding maintenance factor obligation entering 2009–10 is a subject of contention.
Maintenance Factor Payments Based on Growth in General Fund Revenues. Figure 2 illustrates how maintenance factor payments are made. Proposition 98 requires the state to provide additional payments in future years until funding has been built up to the level it otherwise would have reached under Test 2 or absent suspension. (Until all maintenance factor is paid off, the state generates savings each year compared to the level it otherwise would have been required to spend.) The required maintenance factor payment depends on how quickly state revenues grow. When state revenues grow quickly, larger payments are made and the obligation is paid off in a shorter period of time.
During the course of the 2008–09 fiscal year, conflicting interpretations of the constitutional provisions of Proposition 98 led to uncertainty over the amount of maintenance factor owed at the close of 2008–09. The Legislature and Governor made two attempts to resolve the issue. Below, we discuss the different constitutional interpretations as well as the state’s two responses to the controversy.
2008–09 Scenario Leads to Uncertainty. When budget and economic data was updated as part of the February 2009 budget package, an unprecedented Proposition 98 scenario arose. Test 1 was applicable, though the Test 1 funding level provided substantially less than if funding had grown with the economy and attendance (Test 2). As discussed earlier, in the past a maintenance factor obligation has been created when Test 3 applies, which is lower than Test 2. Different opinions exist as to whether a maintenance factor is created when Test 1 applies and is lower than Test 2. The administration believes that no maintenance factor is created in this situation. Others, however, believe that a maintenance factor obligation is created in any situation where funding is below Test 2 (whether Test 1 or Test 3 be applicable). Whether maintenance factor is or is not created in 2008–09 changes the state’s long–term obligation to schools by billions of dollars.
Proposition 1B Attempted to Resolve Issue Constitutionally. To resolve the issue on a one–time basis, the February 2009 budget agreement placed Proposition 1B on the May 2009 ballot. The measure proposed to amend the State Constitution to require $9.3 billion in supplemental payments beginning in 2011–12. In essence, the measure was a compromise to acknowledge a large 2008–09 maintenance factor obligation but to delay the start of payments for a few years. The measure, however, was rejected by voters.
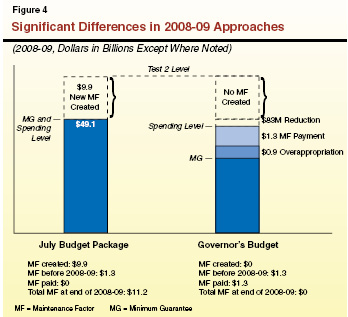
July Budget Agreement Attempted to Resolve Statutorily. An alternative solution was adopted in the July budget. This agreement statutorily set the 2008–09 Proposition 98 minimum guarantee at $49.1 billion, without specifying the applicable test. It also established a maintenance factor obligation of $11.2 billion at the end of 2008–09—$1.3 billion from previously existing obligations and a new $9.9 billion obligation created in 2008–09. The agreement also required that associated maintenance factor payments be made as otherwise specified in the Constitution. As we discuss below, the Governor’s budget departs from this agreement—in essence reopening the controversy surrounding the creation and payment of a potential 2008–09 maintenance factor obligation.
Figure 3 shows Proposition 98 spending from 2007–08 (actual) to 2010–11 (proposed) for K–12 education, CCC, and other Proposition 98–supported agencies (including the state special schools and juvenile justice). As shown in the figure, the Governor‘s January proposal has total Proposition 98 spending virtually flat from 2009–10 to 2010–11. Despite this, the state’s General fund share would increase (4.1 percent). This is caused by local property tax revenues decreasing (8.7 percent) due to sagging property tax values and a one–time shift of local government revenues in 2009–10.
Figure 3
Proposition 98 Spending Stays Virtually Flat Under Governor’s Plan
(Dollars in Millions)
|
|
2007–08
Final |
2008–09
Final
|
2009–10
Revised
|
2010–11
Proposed
|
Change From 2009–10
|
|
|
Amount
|
Percent
|
|
K–12 Education
|
|
|
|
|
|
|
|
General Fund
|
$37,752
|
$30,260
|
$30,844
|
$32,023
|
$1,179
|
3.8%
|
|
Local property tax revenue
|
12,592
|
12,726
|
13,237a
|
11,950
|
–1,287
|
–9.7
|
|
Subtotals
|
($50,344)
|
($42,986)
|
($44,082)
|
($43,974)
|
(–$108)
|
(–0.2%)
|
|
California Community Colleges
|
|
|
|
|
|
|
General Fund
|
$4,142
|
$3,918
|
$3,722
|
$3,981
|
$259
|
7.0%
|
|
Local property tax revenue
|
1,971
|
2,011
|
1,953
|
1,913
|
–40
|
–2.0
|
|
Subtotals
|
($6,112)
|
($5,929)
|
($5,675)
|
($5,895)
|
($219)
|
(3.9%)
|
|
Other Agencies
|
$121
|
$105
|
$94
|
$85
|
–$9
|
–9.1%
|
|
Totals, Proposition 98
|
$56,577
|
$49,019
|
$49,851
|
$49,954
|
$103
|
0.2%
|
|
General Fund
|
$42,015
|
$34,282
|
$34,660
|
$36,090
|
$1,430
|
4.1%
|
|
Local property tax revenue
|
14,563
|
14,737
|
15,191a
|
13,864
|
–1,327
|
–8.7
|
The Governor states his plan funds K–14 education at the minimum guarantee in both 2009–10 and 2010–11. His plan, however, makes various assumptions and policy changes that affect the minimum guarantee. Most notably, his plan departs in several ways from the July budget agreement. Coupled with other components, these budget assumptions result in a lower minimum guarantee in 2008–09, 2009–10, and 2010–11. Each of these assumptions is described in more detail below.
Governor Does Not Recognize New Constitutional Maintenance Factor Obligation in 2008–09, Retires Old Obligation. The Governor’s budget makes several changes associated with 2008–09. Figure 4 shows these changes—comparing the July budget plan with the Governor’s January plan. One of the major changes is associated with the amount of new maintenance factor believed to have been created in 2008–09. As shown, under the July budget agreement, the state recognizes a large new obligation whereas no new 2008–09 maintenance factor is believed to have been created under the Governor’s plan. Not only does the Governor’s plan assume no new maintenance factor is created in 2008–09, it also assumes that old maintenance factor ($1.3 billion created in prior years) can be retired. (This is possible because the minimum guarantee for 2008–09 has dropped even further since the July budget package, leaving an “overappropriation” that can count toward old maintenance factor obligation.)
Actions in 2008–09 Lower Minimum Guarantee in 2009–10 and 2010–11. If the state were to have a large maintenance factor obligation entering 2009–10, it would be required to make payments in 2009–10 and 2010–11. (These payments need to be made because the year–to–year growth rates in the state General Fund are relatively healthy due to the various revenue increases adopted by the state.) Under the Governor’s plan, the state would enter 2009–10 with no outstanding constitutional maintenance factor as a result of his proposed 2008–09 actions. By not having to make these payments, the minimum guarantee drops and the Governor is able to generate substantial state savings. Although the Governor does not recognize a constitutional maintenance factor obligation entering 2009–10, he does propose to make $11.2 billion of “in lieu” payments starting in 2011–12.
Minimum Guarantee in 2010–11 Further Lowered Due to Loss of Transportation Revenues. The 2010–11 Proposition 98 minimum guarantee is also affected by the Governor’s proposal to eliminate the sales tax on fuel (which is currently counted as General Fund revenue for purposes of calculating the minimum guarantee) and replace it with an excise tax (which would not be counted as General Fund revenue). The elimination of the sales tax reduces General Fund revenues by $1.6 billion in 2010–11, which reduces the minimum guarantee by either $640 million or $830 million (depending on related maintenance factor assumptions).
The American Recovery and Reinvestment Act (ARRA) of 2009 provided California with almost $5 billion in general purpose education funding through the State Fiscal Stabilization Fund (SFSF). As a condition of receiving SFSF monies for education, states are required to maintain state support for both K–12 and higher education at or above the level provided in 2005–06. This maintenance–of–effort (MOE) requirement applies through 2010–11. For K–12 education and CCC, state support is defined in California’s approved SFSF application as all funding provided to districts through Proposition 98 (excluding local property taxes) and the Quality Education Investment Act (QEIA). For the University of California (UC) and California State University, the calculation is based on state General Fund support.
Proposal Includes Fund Shift to Meet 2009–10 MOE Requirements. As approved in the July budget, 2009–10 spending for K–12 and higher education was only slightly above the MOE levels ($125 million and $3 million, respectively). As discussed in more detail below, the Governor proposes to reduce K–12 spending in 2009–10, which, when combined with various other technical adjustments, would drop the state below the K–12 MOE requirement by slightly more than $200 million. To stay above the MOE level, the Governor proposes to make an early payment for the 2010–11 QEIA program. Specifically, the proposal would shift $250 million in K–12 QEIA payments that would otherwise have been provided in October 2010 to June 2010. As a result, the funds would count toward 2009–10 support and keep 2009–10 funding above the MOE level. The administration proposes a similar shift of $30 million in CCC QEIA funding to ensure the state meets the 2009–10 MOE requirement for higher education. (The administration estimates that state higher education funding would otherwise fall below the MOE requirement due to an unanticipated current–year drop in UC’s lease–revenue payments.)
Proposed K–12 Funding Level Requires Waiver. In 2010–11, the administration’s proposed level of K–12 spending is roughly $600 million below the K–12 MOE requirement. By comparison, the administration’s proposal for higher education is almost $900 million above the higher education MOE requirement. To provide fiscal relief to states, the federal government can waive K–12 and/or higher education MOE requirements. However, to be eligible for a waiver, states must maintain the same or more support for education (K–12 and higher education combined) as a share of total state support as in the prior fiscal year. Based on preliminary estimates, the state would qualify for a waiver in 2010–11. The administration has submitted the required application to seek federal permission to spend below the K–12 MOE level. Final approval will not be granted until several months after the close of 2010–11, when final expenditure data are available.
Figure 5 summarizes the major components of the Governor’s Proposition 98 proposal. Despite a small year–to–year increase in Proposition 98 funding, a heavy reliance on one–time solutions in 2009–10 necessitates large reductions to existing programs. The major pieces of the plan are discussed below.
Figure 5
Proposition 98: Governor’s Major Spending Proposals
(In Millions)
|
|
|
|
Midyear 2009–10 Proposals
|
|
|
Recognize K–3 Class Size Reduction (CSR) savings
|
–$340
|
|
Make various other baseline adjustments
|
–228
|
|
Total Changes
|
–$568
|
|
2010–11 Proposals
|
|
|
Backfill prior–year one–time solutions
|
$1,908
|
|
Make various other adjustments
|
238a
|
|
Reduce K–12 revenue limits:
|
|
|
Spend less on noninstructional activities
|
–1,184
|
|
Remove restrictions on contracting out
|
–300
|
|
Consolidate County Office of Education functions
|
–45
|
|
Make K–14 cost–of–living adjustments (–0.38 percent)
|
–230
|
|
Recognize additional K–3 CSR savings
|
–210
|
|
Reduce CalWORKs Stage 3 child care funding
|
–123
|
|
Reduce child care reimbursement rates
|
–77
|
|
Fund CCC apportionment growth (2.21 percent)
|
126
|
|
Total Changes
|
$103
|
Small Midyear Reductions. The Governor proposes to reduce 2009–10 Proposition 98 spending by $568 million. The reduction, which includes two major components, largely reflects a recapturing of funding expected to go unused and thus would have no programmatic effect on school districts. One part of the reduction is $340 million in savings from the K–3 Class Size Reduction (CSR) program. Beginning in 2008–09, the state allowed school districts to increase class size above the previous 20–student cap but provides reduced levels of funding (“penalties”) to those who choose to do so. As some districts increased K–3 class sizes for the 2009–10 school year, these funding reductions are leading to sizeable statewide savings. The remainder of the reduction is due to various technical adjustments, which are due primarily to K–12 attendance being slightly lower than projected.
One–Time Solutions in 2009–10 Lead to More Than $2 Billion in 2010–11 Reductions. Although the Governor proposes to keep overall Proposition 98 spending virtually flat across the two years, his plan contains $2.2 billion in budget–year programmatic reductions (detailed in Figure 5). These reductions are necessitated by the heavy reliance on one–time solutions in 2009–10. Most notably, the state achieved $1.8 billion in one–time Proposition 98 savings in 2009–10 by deferring K–12 revenue limit payments and community college payments. These deferrals essentially allowed school districts to operate a program in 2009–10 that the state could not afford. In 2010–11, the Governor’s proposal would require school districts to reduce their ongoing program consistent with available ongoing resources.
Most of Reduction Is to K–12 Revenue Limits. The largest of the proposed reductions for 2010–11 is a $1.5 billion cut to K–12 general purpose funding (commonly known as revenue limits). The reduction is tied to three policy changes the administration expects will provide savings at the local level. First, his plan would require school districts to spend less on noninstructional activities, for anticipated savings of $1.2 billion. His plan also would ease existing restrictions on the contracting out of noninstructional services, with $300 million in expected local savings. (The Governor’s budget eases similar restrictions for CCC, but does not propose a corresponding reduction in CCC apportionments.) Both of these reductions would be made uniformly to all school districts, regardless of whether the district is able to achieve savings from these new policy changes. Third, his plan would require county offices of education (COEs) to consolidate certain functions, for anticipated savings of $45 million. As with the proposed cut to school district revenue limits, this reduction would be made uniformly to all COE revenue limits, regardless of the level of county savings achieved.
Makes $200 Million Reduction to Child Care. The Governor proposes two major changes to the state’s child care and development programs. He proposes to eliminate roughly 18,000 slots from California Work Opportunity and Responsibility to Kids (CalWORKs) Stage 3 child care, for savings of $123 million. In addition, he proposes to reduce reimbursement rates for voucher–based child care programs, for $77 million in Proposition 98 savings (and $55 million in non–Proposition 98 savings). Specifically, he proposes to lower reimbursement rates for licensed providers from the 85th percentile of the regional market rate (RMR) to the 75th percentile. He proposes to lower the reimbursement rate for license–exempt providers from 90 percent of the licensed rate to 70 percent. He proposes to link both licensed and licensed–exempt rates to the 2005 RMR survey.
Other Adjustments. The Governor proposes to apply a cost–of–living adjustment (COLA) of –0.38 percent to most K–14 programs. Applying the negative COLA results in savings of $230 million ($201 million for K–12 education, $23 million for CCC, and $6 million for CCD). Partly offsetting these reductions, the administration proposes funding increases in two major areas. The Governor proposes to fund 2.2 percent growth in community college enrollment (for a cost of $126 million). He also proposes to fund three K–12 mandates (for a cost of $79 million). Specifically, he would fund the mandates associated with behavioral intervention plans for special education students ($65 million), inter– and intradistrict transfers ($7.7 million), and the California High School Exit Exam ($6.8 million). The administration proposes to suspend all other K–14 mandates, except for a mandate related to high school science graduation requirements, which the administration is challenging in court.
New Flexibility Options Proposed for 2010–11. To provide some help to districts as they respond to another tight budget, the administration proposes new flexibility options, which primarily relate to the state’s teacher policies. For K–12 teachers, the Governor proposes to: (1) extend the layoff notification window specified in state law to the last day of the school year and eliminate layoff hearings; (2) amend state law to eliminate teacher seniority rules that apply to layoffs, as well as assignments, reassignments, transfers, and hires; (3) eliminate state rules regarding priority and pay for laid–off teachers serving as substitute teachers; (4) extend the observation window for probationary teachers to four years; and (5) make numerous changes to the teacher dismissal process. For CCC faculty, he proposes to suspend requirements related to the number of full–time faculty that districts must employ. The administration’s proposal also increases the number of categorical programs in the CCC’s “flex item” from 12 to 14 (out of 21 total programs).
The Governor’s overall Proposition 98 funding plan is tenuously held together. As a result, the plan could quickly unravel under certain circumstances related to constitutional interpretation, revenue assumptions, and federal requirements. If any of the Governor’s key assumptions do not come to pass, then the plan would no longer be workable. Below, we discuss each of these major risks and then lay out two alternative courses of action.
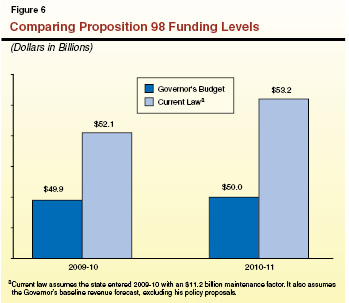
Governor’s Proposal Has Some Legal Risk. As mentioned previously, the Governor’s proposed funding level is based on his interpretation of the constitutional provisions of Proposition 98 regarding the creation and payment of maintenance factor. If a different interpretation were to prevail, the minimum guarantee would be significantly higher. Figure 6 compares what the Proposition 98 minimum guarantee is under the Governor’s plan with what it would be under current law. (By current law, we mean that the state entered 2009–10 with an $11.2 billion maintenance factor. We also assume the Governor’s baseline revenue forecast, excluding his policy proposals.) As the figure shows, the minimum guarantee would be $2.2 billion higher in 2009–10 and more than $3.2 billion higher 2010–11.
Minimum Guarantee for 2010–11 Could Increase Due to Interaction With Revenue Proposals. Apart from issues of constitutional interpretation, the Proposition 98 minimum guarantee could be significantly affected by changes to state General Fund revenues. If the Governor’s proposal to eliminate the sales tax on fuel were not adopted, then the minimum guarantee would increase by $640 million (if no outstanding maintenance factor exists) or $830 million (if outstanding maintenance factor does exist). The minimum guarantee also would increase if the Governor’s “trigger” proposals were to go into effect. The Governor’s proposal includes $2.3 billion in revenue increases that would be implemented if the state did not receive a total of $6.9 billion in federal funds. Should the trigger go into effect, the Proposition 98 minimum guarantee would increase by $900 million to $1.3 billion (also depending on maintenance factor assumptions).
State Needs Education Waiver, Which Is Connected to All Other State Spending. Apart from assumptions about state constitutional issues and state revenue proposals, the Governor’s plan also assumes the state will meet the federal criterion for receiving a waiver from the ARRA education MOE requirement. To qualify for this waiver, the state must show that state support for education (K–12 and higher education combined) as a share of total state support does not decrease from 2009–10 to 2010–11. Though the administration’s January plan meets the waiver criterion, changes to state spending—either in education or in other areas of state government—could affect the state’s ability to qualify for a waiver. For instance, should the state choose to spend $6 billion in other areas of the state budget in 2010–11, education’s share of state support would be reduced and leave the state unable to qualify for a waiver.
Given how tenuously the pieces of the Governor’s funding plan are held together, the Legislature will want to consider other possible courses of action. While accepting the Governor’s approach would help the state balance its budget, it would come with serious risks. The Legislature has two basic alternatives—both of which involve their own difficult choices. First, one alternative would be to suspend the Proposition 98 minimum guarantee. This option is the safest legal course of action and offers the Legislature the most flexibility in building both the education and the overall state budget. A second option would be to spend more on education than the Governor proposes to meet the higher current–law funding requirements—either by reducing spending more in other areas or by raising additional revenues.
Suspend Proposition 98. Suspending Proposition 98 in 2009–10 and 2010–11 would allow the state to decide the level of funding it could afford for K–14 education, regardless of the Proposition 98 formulas, constitutional interpretations of maintenance factor, and otherwise interacting revenue proposals. Suspension requires a two–thirds vote of each house of the Legislature. (Under suspension, the state creates a new maintenance factor obligation, which would require additional payments in future years.)
Raise Additional Revenues or Cut Other Spending to Meet Higher Current–Law Funding Levels. The Legislature could take another course of action and either raise enough additional revenues or make further spending reductions elsewhere in the budget to meet the higher current–law K–14 funding level for 2010–11 ($3.2 billion). To the extent the Legislature used new tax revenues to provide this supplemental funding, the initial $3.2 billion gap would grow. This is because without suspending Proposition 98, every new dollar of General Fund revenue increases the Proposition 98 minimum guarantee by 40 cents to 50 cents. For example, if the Legislature were to take this approach relying entirely on tax revenues, it would need to raise roughly $6 billion in new revenues, with essentially all of the new funding used for K–14 education. (We assume the state would be able to meet a higher funding obligation in 2009–10 through “settle–up” payments in future years.)
Generally Headed in Right Direction. After determining how much total Proposition 98 funding to provide, the state will need to decide how to spend available monies. We believe the Governor’s overall Proposition 98 spending plan has some merit. Specifically, we think the Governor’s overall plan heads in the right direction by finding some ways to reduce costs, providing additional flexibility, and seeking additional federal funding. In these ways, the administration tries to help local education agencies in responding to another tight budget. The administration’s Proposition 98 plan also does not rely on any new borrowing. Instead, the administration proposes ongoing solutions to align ongoing program with ongoing resources.
…But Misses Many Opportunities. Though the Governor’s spending plan appears to be headed in generally the right direction, we believe it misses many opportunities. Specifically, we believe the Governor’s plan misses opportunities to increase flexibility, undertake meaningful reform, align state and federal programs, and leverage additional federal funding. Moreover, the plan makes rather tenuous links between state cuts and local savings. Below, we discuss each of these shortcomings in more detail. In “Part 2” of this report (which covers K–12 education and child care), as well as in the “Community Colleges” section of our companion higher education report, we discuss each of the Governor’s specific K–14 spending proposals. Figure 7 lists each of the Governor’s specific spending proposals, indicates our accompanying recommendation, and includes the page reference where our more detailed analysis can be found.
Figure 7
Summary of Governor’s 2010–11 Proposals and Accompanying LAO Recommendations
|
Governor's Proposal
|
LAO Recommendation
|
Detailed Analysis
|
|
K–12 Education
|
|
|
|
Mandates. Suspends all but three K–12 mandates.
|
Modify
|
ED–23
|
|
Noninstructional Spending. Reduces school district revenue limits by $1.2 billion and caps noninstructional spending.
|
Reject
|
ED–28
|
|
Contracting Out. Reduces school district revenue limits by $300 million and removes restrictions on contracting out for noninstructional services.
|
Modify
|
ED–29
|
|
County Services. Reduces county office of education revenue limits by $45 million and encourages consolidation of more functions.
|
Modify
|
ED–30
|
|
Class Size Reduction. Recognizes $550 million in savings due to new program rules.
|
Modify
|
ED–31
|
|
Negative COLA. Applies –0.38 percent cost–of–living adjustment (COLA) to most K–12 and child care programs, for savings of $207 million.
|
Reject
|
ED–32
|
|
Child Care Reimbursement Rates. Lowers maximum amount state will reimburse child care providers ($132 million savings, including $77 million Proposition 98 savings).
|
Modify
|
ED–33
|
|
CalWORKs Stage 3 Child Care. Reduces by $123 million and eliminates 18,000 slots.
|
Modify
|
ED–36
|
|
Layoff Notifications. Changes date for final notification from May 15 to last day of school.
|
Modify
|
ED–40
|
|
Layoff Hearings. Eliminates Reduction–in–Force hearings.
|
Adopt
|
ED–41
|
|
Teacher Seniority. Removes requirement that seniority be used in making certain personnel decisions.
|
Modify
|
ED–42
|
|
Priority for Substitute Teaching. Removes requirement that laid–off teachers get priority for positions and paid at pre–layoff rate.
|
Adopt
|
ED–43
|
|
Probationary Period. Would increase the probationary period from two to four years, with the option of granting tenure after two years.
|
Adopt
|
ED–44
|
|
Dismissal Notices. Allows district to notice teachers of dismissal over summer months.
|
Reject
|
ED–46
|
|
Dismissed Teacher Salary. Allows districts to cease paying salary and benefits to a teacher once the dismissal notice is served.
|
Modify
|
ED–46
|
|
Dismissal Hearings. Lifts the four–year limit on evidence introduced in dismissal hearings.
|
Adopt
|
ED–46
|
|
Commission on Professional Competence. Eliminates two teachers from panel and makes administrative law judge’s ruling advisory to the local governing board.
|
Modify
|
ED–46
|
|
Federal Special Education Funding. Seeks $1 billion in one–time funding to reimburse state for past special education costs.
|
Modify
|
ED–47
|
|
California Community Colleges
|
|
|
|
Enrollment Growth. Provides $126 million in Proposition 98 General Fund support for 2.2 percent enrollment growth.
|
Modify
|
HE–21
|
|
Negative COLA. Applies –0.38 percent COLA to apportionments and certain categorical programs, for savings of $23 million.
|
Reject
|
HE–27
|
|
Contracting Out. Removes certain restrictions on contracting out for noninstructional services. (Unlike K–12, Governor does not propose a corresponding reduction to apportionments.)
|
Adopt
|
HE–36
|
|
Mandates. Suspends all CCC mandates.
|
Modify
|
HE–36
|
|
Categorical Program Flexibility. Places three currently protected categorical programs in CCC flex item.
|
Modify
|
HE–40
|
|
Base Reduction to Categorical Programs. Applies base cut to two categorical programs (both proposed to be in flex item) and redirects these funds to augment funding for Career Technical Education (CTE) "pathways" initiative.
|
Reject
|
HE–41
|
|
Quality Education Investment Act. Provides $48 million in non–Proposition 98 funds for CTE pathways initiative.
|
Adopt
|
HE–41
|
|
Full–Time Faculty Hiring Requirements. Suspends law and corresponding regulations that require districts to meet certain hiring targets for full–time faculty.
|
Adopt
|
HE–41
|
Misses the Mark on Flexibility Proposals. The Governor proposes several additional flexibility options. For example, the Governor proposes several changes to state teacher policies as well as expanding the CCC flex item. We believe these proposals have several shortcomings. Perhaps most importantly, a few of the Governor’s proposals would result in less rather than more flexibility. For example, the Governor proposes adding three programs to the CCC flex item, only to cut that item and use the freed–up funds for a restricted categorical program. Similarly counterproductive, one of the K–12 proposals would place new strings on previously unrestricted monies. While a few of the Governor’s other proposals would increase flexibility, some of the near–term benefit would be quite limited. For example, given state teacher provisions often have similar counterparts in local bargaining agreements, we think changes in the state provisions would offer districts little initial increase in flexibility (though the proposals still could be worthwhile for other reasons).
Takes Expedient Rather Than Thoughtful Approach to Reform. The Governor’s plan is packed with policy changes. Among the most significant of these changes is the Governor’s proposal to suspend virtually all education mandates in 2010–11. We have two serious concerns with this approach. First, suspension treats virtually all currently mandated activities alike regardless of policy merits. For example, suspension would temporarily remove restrictions that students receive potentially lifesaving immunizations before entering school—treating these immunizations comparably to a duplicative physical education reporting requirement. Second, suspending mandates for one year creates confusion for districts. Districts would be left guessing as to which activities are likely to be reinstituted in 2011–12 and which ones are likely gone permanently. If a district guesses wrong, it either loses potential savings or incurs added costs to reconstruct processes that it prematurely dismantled.
Misses Opportunities to Align Program Efforts. In a few cases, the Governor’s plan is notable for the absence of strategic, coordinated proposals. For example, the administration spends more than $400 million in state funding for school improvement while not building a budget plan for $650 million in available federal funding for school improvement. Despite the obvious nexus between these program efforts, the administration does nothing to align them, reduce associated administration burden, and achieve state savings. The Governor’s budget also includes no plan for spending available federal funding for local education technology efforts, nor does it attempt to coordinate those local efforts with state efforts. Moreover, the administration misses opportunities to combine various K–12 career technical education programs as well as various programs for K–12 and CCC low–income students.
Could Go Further in Leveraging Federal Aid. The Governor’s plan seeks $1 billion in additional federal funding associated with special education, but the proposal has several shortcomings. It seeks one–time rather than ongoing relief, requests funding only for California even though California has not been particularly disadvantaged relative to other states, and does not use the funds for education. Moreover, the Governor’s K–14 budget plan includes no other proposals for maximizing or leveraging federal aid. Among the most obvious missed opportunity is the failure to leverage more federal aid (through a newly expanded tax credit) by raising CCC fees. (Although not part of his budget plan, the administration has applied for federal Race to the Top funds for K–12 education.)
Makes Tenuous Link Between State Cuts and Local Savings. The Governor also makes almost $2 billion in state cuts to K–12 education—proposing various associated policy changes to help local education agencies absorb these cuts. For example, the Governor would restrict how much school districts spend on noninstructional services, relax rules on contracting out for noninstructional services, and consolidate county–based services. While we think some of the proposals have policy merit, we question linking them to specific state cuts. Moreover, these proposals have virtually no chance of producing as much local savings as assumed. In addition, the Governor misses at least a few opportunities to further reduce local costs (for example, by changing the kindergarten start date) as well as state costs (for example, by reorganizing the California Department of Education).
This section lays out an alternative to the Governor’s Proposition 98 plan. We do not link our alternative to a specific funding level in recognition that the Legislature could choose to suspend Proposition 98 and fund at whatever level it deemed appropriate, take various actions to meet the higher current–law Proposition 98 funding requirement, or adopt the Governor’s funding level. Instead, we offer a strategy for building the education budget that could be used regardless of the exact dollar amount ultimately provided for K–14 education. Our alternative is intended to provide the Legislature with both a better overall approach toward crafting its education budget and recommendations for addressing specific K–14 budget issues.
Alternative Makes Various Improvements to Governor’s Plan. The alternative builds on the positive aspects of the Governor’s plan but tries to make various improvements. In particular, the alternative identifies additional ways to reduce costs and expands flexibility for schools and colleges. Moreover, the alternative includes comprehensive mandate reform, strategically aligns certain existing program efforts, and seeks opportunities to increase federal support. Figure 8 summarizes the basic building blocks of the Proposition 98 budget. Each component is discussed in more detail below.
Figure 8
Building Blocks of Proposition 98 Budget
|
|
- Weigh priorities among K–12 education, child care and development, and the community colleges.
|
- Make targeted reductions.
|
- Make additional reductions, as needed, to apportionments and/or categorical programs.
|
|
|
- Undertake comprehensive education mandate reform.
|
|
|
- Leverage additional federal funding.
|
Weigh Overall Proposition 98 Priorities. The first challenge the Legislature faces in building its Proposition 98 plan is to establish priorities among CCD, K–12 education, and community colleges. Given all three areas have experienced reductions in programmatic funding over the last few years, evaluating where to make additional cuts likely will be particularly difficult. From 2007–08 (actual) to 2010–11 (proposed by Governor), programmatic funding would decline almost 3 percent per child care slot and more than 10 percent per K–12 student. Community college programmatic funding would decline almost 5 percent based on budgeted per student counts and up to roughly 10 percent based on actual per student counts. Aside from these comparisons, the Legislature obviously will want to weigh other considerations, such as the different populations, needs, programmatic quality, and public benefits of the three areas. Whereas the Governor makes all 2010–11 spending reductions to CCD and K–12 education, our alternative cuts CCD less than the Governor, while also raising student fees to provide more overall CCC funding, thereby preventing even deeper cuts to K–12 education.
Make Targeted Reductions. After developing an overall plan for allocating funds among the segments, we recommend making as many targeted reductions as possible. Figure 9 lists the almost $1.1 billion of targeted reductions included in our alternative (about $800 million in Proposition 98 and almost $300 million in non–Proposition 98 General Fund reductions). Most of these reductions involve difficult policy decisions. For example, the alternative achieves savings by lowering the eligibility ceiling for families to receive subsidized child care from 75 percent to 60 percent of the state median income. A few of the reductions, however, merely reflect savings from programs being overbudgeted. For example, given the decline in K–12 ADA, Economic Impact Aid is now overbudgeted by more than $100 million. Similarly, if the state were to continue funding the Charter School Facility Grant program on a reimbursement basis, it would have overbudgeted significantly in 2009–10 and 2010–11. (The Governor’s budget assumes a funding change will be adopted in the 2009–10 special session.) As discussed in more detail in the nearby box, we also recommend changing the kindergarten start date, beginning in 2011–12. (Given lead time is needed to implement the change without serious disruption, and 2011–12 looks to be another difficult budget year, we recommend enacting the authorizing legislation this year.)
Figure 9
LAO–Recommended Reductions
2010–11 (In Millions)
|
Program
|
Recommendation
|
Reduction
|
|
Proposition 98–Funded Programs
|
|
|
K–3 Class Size Reduction
|
Reduce 2007–08 level by 20 percent (consistent with other flex programs), then fold into K–12 flex item.
|
$382
|
|
CCC fees
|
Use increase in fee (from $26 to $40 per unit) to fund "overcap" enrollments and reverse the Governor’s proposed negative cost–of–living adjustment.
|
125
|
|
Economic Impact Aid
|
Align funding with eligible student counts.
|
101a
|
|
Child care eligibility ceilings: Non–CalWORKs programs
|
Reduce from 75 percent to 60 percent of state median income for $115 million savings. Redirect $55 million to expand access to lowest–income families. Results in net loss of about 8,000 slots.
|
60
|
|
Child care reimbursement rates: CalWORKs Stage 2 and 3, Alternative Payment programs
|
Reduce license–exempt rates from 90 percent to 70 percent of licensed rates.
|
45
|
|
County offices of education (COE)
|
Reduce general purpose revenue limit allocation by 10 percent. Redirect additional 10 percent into new COE regional revenue limit.
|
33
|
|
Charter School Facility Grant program
|
Align funding with program cost.
|
34b
|
|
Child care eligibility ceilings: CalWORKs Stage 3
|
Reduce from 75 percent to 60 percent of state median income. Results in loss of about 4,000 slots.
|
15
|
|
Migrant child care
|
Align funding with program need.
|
7
|
|
Subtotal
|
|
($802)
|
|
Non–Proposition 98–Funded Programs
|
|
|
Quality Education Investment Act
|
Fund eligible schools using federal school improvement monies.
|
$231
|
|
Child care reimbursement rates: CalWORKs Stage 1
|
Reduce license–exempt rates from 90 percent to 70 percent of licensed rates.
|
35
|
|
California Department of Education: State operations
|
Reduce by roughly 150 positions to align staffing with program needs.
|
10
|
|
Subtotal
|
|
($276)
|
|
Total General Fund Savings
|
$1,078
|
|
In California, a child can begin kindergarten as young as four years and nine months. This is because California’s current cut–off date for entering kindergarten is December 2 of the year in which the child turns five years old. This is one of the latest kindergarten entry dates in the nation. In recent years, the California Performance Review, the Governor’s Committee on Education Excellence, and numerous legislative proposals have suggested moving the kindergarten entrance date back to September 1 (requiring a child to have turned five prior to entering kindergarten). We recommend the Legislature take action this year to make this change beginning in the 2011–12 school year. (As is current policy, we recommend allowing parents to seek a waiver if they want to enroll a younger child.)
Research Suggests Positive Effects on Children. Many have argued that entering kindergarten before turning five years of age is too young, and beginning school at an older age would benefit children’s academic performance and social development. Data suggest children who are older when they start kindergarten tend to perform better on standardized tests. Some research suggests this change also may lead to other positive student outcomes, including less chance of grade retention and higher earnings as an adult. The research is somewhat varied on the factors that contribute to these positive effects, mentioning family characteristics, preschool experience, and the relative age of the child as important influences on later student outcomes. Taken together, this body of research suggests that changing the kindergarten entry age would be generally positive, with no overall negative effect on children’s academic achievement.
Change Could Lead to Budgetary Savings. Our economic forecast suggests the state and schools will face another tight budget situation in 2011–12. Because of the ambiguity surrounding the Proposition 98 minimum guarantee, we are not certain that changing the kindergarten start date would have any effect on the amount the state is required to spend on schools in 2011–12. Even if the change does not result in state savings, however, it could help ease the budget crunch for schools. Changing kindergarten eligibility for roughly 100,000 children born between September and December would mean schools would be required to serve fewer students. We estimate that having 100,000 fewer kindergarteners in 2011–12 could free up roughly $700 million from revenue limits and categorical programs. These funds could be redirected for other K–12 purposes, including a portion for subsidized preschool for any affected low–income children. |
Between Apportionments and Categorical Programs, Decide Mix of Remaining Reductions. If the Legislature decides that additional reductions are needed beyond the $1.1 billion we have identified (the Governor’s plan has almost $2 billion in Proposition 98 cuts), then we recommend it make additional reductions to apportionments and/or the categorical flex items. The Legislature relied on these approaches in 2008–09 and 2009–10 to generate large amounts of savings. Exactly how the cut is applied will have distributional effects among districts. Because categorical program funding varies significantly by district—with certain large districts receiving more than small districts (and charter schools)—electing to cut categorical flex funding will have a different impact than electing to cut apportionments. Given the varying distributional effects, the Legislature might want to use some combination of the two strategies. For CCC, the Legislature also could consider certain targeted reductions to apportionments. For example, it could reduce funding for physical education and other lower–priority enrichment classes.
Maximize Flexibility. Our alternative includes a dozen flexibility options to help districts cope with another tight budget. Figure 10 briefly describes each option. (In the nearby box, we provide additional detail on a few of these recommendations, with the remainder discussed elsewhere in this report and our companion higher education report.) In several cases, we recommend folding more programs into the K–12 and CCC flex items. (These flex items allow K–12 districts to use associated funding for any education purpose and allow CCC districts to use associated funding for any categorical program purpose.) In several other cases, we recommend easing or removing specific state requirements. For example, we recommend easing existing restrictions associated with contracting out for noninstructional services and CCC’s “50 Percent” law, as well as removing restrictions that laid–off teachers be given priority for substitute teaching assignments. In the remaining cases, we recommend specific policy changes to remove certain restrictions while preserving some of the underlying policy objectives. For example, we recommend eliminating certain K–12 career technical education (CTE) program requirements and reorienting the CTE system around performance outcomes. We also recommend eliminating many K–14 mandates (as discussed in more detail below).
Figure 10
LAO Flexibility Package
|
Program/Provision
|
Recommendation
|
|
After School Education and Safety (ASES)
|
Repeal certain provisions of Proposition 49 and include ASES in K–12 flex item. (Requires voter approval.)
|
|
Career Technical Education (CTE)
|
Combine funding from two CTE programs in K–12 flex item and three CTE programs outside K–12 flex item.
|
|
English Learner Acquisition Program
|
Shift funding into Economic Impact Aid.
|
|
Home–to–School Transportation
|
Include in K–12 flex item.
|
|
K–3 Class Size Reduction
|
Include in K–12 flex item.
|
|
Priority for substitute teaching positions
|
Remove requirement that districts give laid–off teachers priority for these positions and pay them at pre–layoff rates.
|
|
Quality Education Investment Act (QEIA)
|
Allow QEIA schools qualifying for federal school improvement funding to be subject only to federal requirements (that is, free from state QEIA requirements).
|
|
Contracting out for K–12 and CCC noninstructional services
|
Ease restrictions on contracting out for noninstructional services.
|
|
K–12 and CCC mandates
|
Eliminate many K–14 education mandates.
|
|
CCC categorical flexibility
|
Add to the "flex item" the Basic Skills Initiative, Extended Opportunity Programs and Services, Fund for Student Success, and Financial Aid Administration.
|
|
CCC full–time faculty
|
Suspend requirements on the number of full–time faculty that districts must employ.
|
|
CCC "50 Percent" law
|
Give districts more ability to hire faculty that provide direct support services to students by including expenditures on counselors and librarians as part of instructional costs. Alternatively, suspend the law until 2012–13.
|
|
The state excluded roughly 20 categorical programs from the K–12 “flex item” created during the 2009–10 budget process—leaving in place the existing restrictions on how districts must spend the associated dollars. We believe districts would benefit from relaxing categorical rules for several of these programs. We also recommend aligning California Department of Education (CDE) staff levels with categorical flexibility decisions. Our specific recommendations are detailed below.
Add Home–to–School (HTS) Transportation and After School Education and Safety (ASES) Programs to Flex Item. Last year, the Legislature excluded the HTS transportation program from the flex item because at the time the program was being funded with special funds that had to be used for transportation purposes. Under the Governor’s 2010–11 proposal, the HTS program is funded with Proposition 98 monies. As such, we see no reason to continue to treat this program differently from most other K–12 programs. We therefore recommend adding the program and its associated funding (roughly $500 million) to the flex item. Similarly, we continue to recommend the Legislature ask voters to repeal the existing restriction that roughly $550 million in K–12 funds be used solely for after school services. Specifically, we recommend the Legislature place a measure on the ballot to repeal Proposition 49 (which created the automatic ASES funding requirement), and, if it passes, to add the ASES program into the flex item. Relaxing restrictions on the HTS and ASES programs would provide districts with discretion over about $1 billion in previously restricted categorical funds.
Shift English Learner Acquisition Program (ELAP) Into Economic Impact Aid (EIA). Currently, ELAP must be used to provide services to English learner (EL) students in grades 4 through 8. We recommend merging ELAP and its associated funding ($50 million) into the more broad–based EIA program, which supports various activities benefiting EL and low–income students. While continuing to dedicate funds for the state’s most at–risk students, this change would grant districts flexibility to spend the funds on EL and low–income students of any grade level, depending on their areas of greatest need.
Streamline Funding for Career Technical Education (CTE), Focus on Student Outcomes. In 2008–09, the state allowed funds associated with two CTE programs serving high school students to be used for any educational purpose while maintaining detailed requirements for three other high school CTE programs. To better coordinate the state’s fractured CTE system and increase local flexibility, we recommend consolidating all high school CTE funding ($427 million) and eliminating programmatic requirements in favor of monitoring related student outcomes. (One such consolidation approach would be to roll the funds into high schools’ revenue limits.) Under this approach, districts receiving CTE funding would be held accountable for various student outcomes, including the percentage of high school students that enter postsecondary education or begin employment in a high–wage industry. By holding districts more accountable for student engagement and outcomes, the state could ensure students receive the positive benefits of CTE while providing more flexibility to districts in developing effective high school programs.
Align CDE Staff Levels With Categorical Flexibility Decisions. Despite the state’s decision last year to essentially eliminate the programmatic and funding requirements associated with roughly 40 state categorical programs, the state has made no corresponding changes to CDE’s staffing of those programs. In short, CDE now has hundreds of staff members assigned to administering programs that the state is not now operating. (This disconnect would be amplified if the Legislature were to adopt a more expansive flexibility package this year.) To reflect the impact of consolidating categorical programs on state operations, we recommend decreasing CDE’s budget by $10 million and eliminating roughly 150 positions. |
Undertake Comprehensive Reform of Education Mandates. As one way to help districts free up funds for high priorities, we recommend the Legislature undertake comprehensive education mandate reform. As detailed in our recent report, Education Mandates: Overhauling a Broken System (February 2010), we assess each of the 51 existing K–14 mandates on a case–by–case basis. In the few cases mandates are serving essential purposes, we recommend funding them using a simplified reimbursement process. For some mandates, the underlying policy objective appears worth preserving, but we think the mandate process is not the best means of achieving the objective. In these cases, we find a more effective means of achieving largely the same goal. We recommend eliminating the remaining mandates either in whole or part. By relieving schools from performing the vast majority of K–14 mandate requirements, our package of recommendations would result in about $375 million in annual savings. We think this is a far superior approach to merely suspending virtually all mandates with little regard for their policy merits (as the Governor proposes).
Find Ways to Better Align Programs. One way to promote flexibility as well as maximize efficiency and potential program effectiveness is to align complementary programs. We have identified several areas in which existing state and/or federal policies suffer from a lack of alignment. One of these areas is K–12 school improvement. In this area, we recommend a number of policy changes that would align state and federal programs—essentially freeing districts from state rules while still complying with federal rules. This would both streamline the improvement process for struggling schools as well as generate state savings. Another area suffering from misalignment is education data and technology. In this area, we recommend changes that would ensure various state and local efforts are working in concert.
Leverage More Federal Funding. Lastly, our alternative includes two specific components designed to increase federal funding for education. For K–12 education, we recommend the state request that the federal government increase federal special education funding, such that the federal appropriation covers 40 percent of the excess cost of educating a special education student on an ongoing basis for all states—consistent with longstanding federal policy. For CCC, we recommend leveraging more federal support via a recently enacted tax credit. Specifically, we recommend raising the CCC fee from $26 to $40 per unit. This would generate roughly $150 million to help support CCC programs while having only a modest impact on students. This is because most students would qualify either for a state fee waiver or the federal tax credit, which provides full reimbursement of fee costs. (Even at this higher amount, California’s fee rate would remain the lowest in the country.)
Part 2
In this part of the report, we offer a brief retrospective on major developments relating to K–12 school finance. We then analyze the Governor’s proposals to reduce K–12 and CCD spending, modify several state teacher policies, and dedicate federal funding for various K–12 purposes.
Over the last couple years, school districts have faced significant budget challenges. In 2008–09 and 2009–10 combined, the state reduced ongoing K–12 Proposition 98 spending by over $16 billion. As a result, virtually all districts had to make programmatic reductions. School districts did, however, have various means to mitigate the effect of these reductions. Most importantly, school districts relied heavily on other revenue sources—including federal ARRA funds, categorical program reserves, and one–time state funds—to offset part of the reductions. State deferrals also allowed districts to avoid reductions by paying for programs using revenues from the next year. Finally, districts were able to use categorical flexibility provided in the February and July agreements to shift funding from lower to higher priorities. Below, we discuss each of these budget responses in more detail, discuss the current cash position of school districts, and describe the fiscal outlook for school districts in 2010–11.
ARRA Funds Mitigate Reductions. Perhaps the most significant source of relief for school districts came from federal stimulus funding provided through ARRA. In total, ARRA provided $6.1 billion in one–time funding for school districts to operate programs in 2008–09, 2009–10, and 2010–11. Of that amount, approximately $3.1 billion can be used by school districts for any purpose. The remaining $3 billion must be used for specific federal education programs, which primarily serve special education and economically disadvantaged students.
Restricted Reserves Freed Up for Any Educational Activity. The February 2009 budget also freed up additional resources for districts by allowing reserves from many restricted categorical programs to be used for any purpose. Based on data from the California Department of Education (CDE), school districts relied heavily on these funds to operate during the 2008–09 year. Entering 2008–09, districts statewide had approximately $3.1 billion in total restricted categorical reserves. Of this amount, the state freed up $2.2 billion that could be used for any education purpose. By June 30, 2009, only $291 million of the freed–up categorical reserves remained. (Although most of these funds were transferred out of restricted accounts in 2008–09, they will likely be spent over both 2008–09 and 2009–10.)
Districts Use One–Time State Revenues to Cover Costs. In addition, the state provided $2.2 billion in one–time state funds for school districts. These one–time funds supported existing programs in 2008–09, thereby reducing the need for school districts to make midyear reductions or dip into emergency reserves.
Deferrals Allow Districts to Continue Spending. Beyond relying on new revenue sources, the state and school districts also relied heavily on borrowing. A large component of the K–12 spending reductions reflected payment deferrals ($2.9 billion in 2008–09 and $1.7 billion in 2009–10). That is, to allow districts to continue their current spending levels but still achieve state savings, the state delayed several K–12 education payments until the next fiscal year. As a result of this borrowing, school districts were able to sustain existing programs and postpone additional program cuts.
Districts Rely Heavily on Categorical Flexibility. The February and July packages made several significant policy changes to loosen restrictions and give school districts more discretion in making spending decisions. Among the biggest changes was the elimination of spending restrictions for roughly 40 categorical programs. Based on preliminary survey data collected by our office, school districts relied heavily on this newly granted flexibility. Generally, it appears many districts used the additional flexibility to transfer funding away from categorical programs to their core instructional activities. In particular, numerous school districts reduced their allocations for adult education, deferred maintenance, arts and music, and school and library improvement.
Reductions to Programs Still Needed. Although school districts were able to avoid many reductions because of the availability of one–time funds, borrowing, and additional categorical flexibility, many districts still had to make reductions to their programs in 2009–10. Based on preliminary information, school districts appear to be increasing class sizes across the board and laying off teachers. According to the California Teacher’s Association, 17,000 teachers (roughly 5 percent) were laid off at the end of the 2008–09 school year. Many districts also made reductions to classified noninstructional staff, such as custodians and bus drivers. Statewide summary data on the effect of these reductions, however, are not yet available.
As a result of budget reductions, an increasing number of school districts are having a difficult time remaining solvent. Based on reporting data from fall 2009, 117 districts are currently at risk of not meeting their financial obligations for the next two fiscal years. At this point last year, 90 school districts were at risk. This increase, however, is lower than anticipated considering the level of reductions districts have faced. At the time of the February 2009 budget, it was anticipated that the large budget reductions and deferrals could significantly affect the cash solvency of school districts. Since February 2009, however, only one school district has needed an emergency loan from the state to remain solvent. The large influx of ARRA funding has helped many school districts maintain favorable cash positions and meet monthly payment obligations despite state reductions.
Although larger funding reductions were made in prior years, most school districts are not likely to feel the full effects of Proposition 98 funding reductions until 2010–11. Figure 11 shows our estimates of “programmatic” funding for school districts from 2007–08 through 2010–11. These numbers reflect the amount of K–12 funding available for school districts to spend each year. As Figure 11 shows, most of the one–time revenues that were used in prior years will no longer be available in 2010–11. Based on a recent school finance survey we conducted, school districts spent approximately 20 percent of ARRA funds in 2008–09, are planning to spend 60 percent in 2009–10, and reserved 20 percent for 2010–11. Many also will have used up the restricted reserves that were made available by the flexibility proposals enacted last year. Given the loss of these funds, school districts would have roughly 11 percent less funding in 2010–11 under the Governor’s Budget compared to 2007–08 funding levels.
Figure 11
K–12 “Programmatic” Fundinga
(Dollars in Millions)
|
|
2007–08 Final
|
2008–09 Revised
|
2009–10 Revised
|
2010–11 Proposed
|
|
Programmatic Funding
|
|
|
|
|
|
K–12 ongoing fundingb
|
$48,883
|
$43,215
|
$40,765
|
$42,708
|
|
Payment deferrals
|
—
|
2,904
|
1,679
|
—
|
|
One–time fund swaps
|
862
|
1,766
|
—
|
64
|
|
Freed–up restricted reservesc
|
—
|
1,100
|
1,100
|
—
|
|
American Recovery and Reinvestment Act (ARRA) fundsc
|
—
|
1,192
|
3,575
|
1,192
|
|
Totals
|
$49,745
|
$50,176
|
$47,118
|
$43,964
|
|
Per–Pupil Programmatic Funding
|
|
|
|
|
|
K–12 attendance
|
5,947,758
|
5,957,111
|
5,921,510
|
5,927,728
|
|
K–12 per–pupil funding
|
$8,364
|
$8,423
|
$7,957
|
$7,417
|
|
Percent Changes From 2007–08
|
—
|
0.7%
|
–4.9%
|
–11.3%
|
The 2010–11 Governor’s Budget includes $1.9 billion in programmatic reductions to K–12 education. Three of the reductions are associated with policy proposals relating to school district and COE revenue limits. Specifically, the Governor proposes to limit the amount districts can spend on noninstructional activities, modify state restrictions on contracting out for noninstructional services, and consolidate COE services. The Governor also proposes to capture savings from the K–3 CSR program as well as apply a negative COLA to most K–12 programs. We find the Governor’s general approach toward making these reductions highly problematic, and, as discussed in Part I of this report, we recommend the Legislature take a more straightforward and transparent approach. In this section, we discuss our concerns with each of the Governor’s specific reduction proposals and offer alternative recommendations.
Under current law, revenue limit funding is provided to local school districts as unrestricted money with few strings attached. Based on the amount of revenue limit funding the state provides in a given year, local school districts decide how to allocate these general purpose dollars among competing priorities. These priorities typically include staffing levels at school sites as well as the central district office, staff compensation, materials and supplies, and other operating expenses.
Governor Proposes to Limit Amount of Funding That Can Be Spent on Noninstructional Activities. The Governor proposes to cut $1.2 billion from K–12 revenue limits and impose new limits on the local decision–making process. Specifically, each school district would be cut roughly $200 per ADA and required to reduce its total noninstructional spending by at least 12 percent from 2008–09 levels. The Governor specifies the categories of expenditures from which a district must make its reductions, including general administration, instructional supervision, and plant maintenance and operations. The 12 percent target is derived by taking $1.2 billion as a share of statewide spending on these categories (roughly $10 billion). On average, districts currently allocate about 19 percent of their budgets for these types of expenses. This share, however, differs significantly by district. For example, Plumas Lake Elementary, a district of about 1,000 ADA in Yuba County, spends about 31 percent of its budget on these categories, whereas Garden Grove Unified, a district with 47,500 ADA, spends about 17 percent, and Los Angeles Unified, a district of about 650,000 ADA, spends about 22 percent.
Proposal Has Serious Implementation Problems. We have serious concerns with how this proposal would be implemented. First, every district would be required to make the same proportional reduction to the targeted expenditure categories regardless of its current mix of spending on administration and instruction. Districts currently spending 30 percent of their budgets on these activities are treated the same as those spending 20 percent. Moreover, no allowance is made for districts that have recently made large reductions in these areas. (The Governor, however, would allow districts to apply for a waiver from this policy if they currently spend less than 15 percent of their total budget on these activities or if making the specified reductions would cause a district to require an emergency loan from the state.) Furthermore, it is unclear who would review expenditure data to ensure districts made reductions in the required places, how this policy would be enforced, and what the penalties would be for noncompliance. That district expenditure data are not available until several years after the close of the fiscal year makes monitoring compliance even more complicated.
Proposal Would Counteract Recent Flexibility Provisions. The Governor’s proposal also would work at cross–purposes with the flexibility options the state has recently granted to school districts. To help school districts respond to tough fiscal times, the 2009–10 budget package included numerous measures intended to increase local spending discretion. These included easing restrictions associated with more than 40 categorical programs and granting access to categorical fund balances. As it would place new limits on how districts can use general purpose funding, the Governor’s “one size fits all” proposal is antithetical to these other efforts.
Recommend Legislature Reject Governor’s Proposal, Preserve Local Decision–Making Power. We recommend the Legislature reject the Governor’s proposal to place new limits on how much districts spend on noninstructional activities. Districts confronting budget reductions need new options for how to respond, not new constraints. Local school boards and their constituencies—through public budget meetings, the local education agency planning process, and local elections—are better positioned to decide how available monies should support districts’ specific needs and priorities.
Under current law, school districts can contract out for many noninstructional services (such as food service, maintenance, clerical functions, and payroll) only if certain conditions are met. For example, contracting out for services cannot result in the layoff or demotion of existing district employees.
Governor Proposes to Modify State Restrictions on Contracting Out. The Governor proposes to cut an additional $300 million from school district revenue limits (roughly $50 per ADA) and to modify restrictions that prohibit districts from contracting externally for noninstructional services. For example, districts would no longer be prohibited from contracting out based solely on savings they would get from lower contractor pay rates or benefits. They also would be able to layoff or demote a district employee who used to perform the service to be contracted out. Easing these restrictions would allow districts to more frequently bid on the open market for noninstructional services.
Proposal Could Result in Some Local Savings but $300 Million Overly Optimistic. To the extent local districts took greater advantage of contracting out, they likely would realize some cost savings at the local level. However, contractor availability, collective bargaining agreements, and existing service arrangements differ across the state, such that it is uncertain how much savings could be realized or how many districts would take advantage of the new flexibility. In a recent school finance survey we conducted, about 40 percent of responding districts indicated they likely would contract out for services if the restrictions were removed. Their estimates for how much they could save, however, varied greatly by district. We think assuming $300 million in associated savings is overly optimistic. Depending on the percent of noninstructional services contracted out and the incremental reduction in cost, we estimate total savings statewide could be as high as $250 million or as low as $50 million.
Savings Generated and Cut Applied Unlikely to Match. Given the proposed cuts are to be spread across all districts regardless of the amount of contract savings they are able to achieve, we also think it is highly unlikely that the savings a particular district generates will be well aligned with that district’s $50 per ADA revenue limit reduction.
Recommend Approving Contracting Out Proposal but Without Link to Revenue Limit Reduction. We think allowing districts to identify the most cost–effective options for meeting their needs makes sense. We therefore recommend the Legislature approve the Governor’s proposal to waive the restrictions on contracting out for noninstructional services. Nonetheless, we believe it is inappropriate to equate this proposal with an across–the–board revenue limit savings estimate, as individual districts could save more or less than their share of the $300 million cut. Thus, we recommend the Legislature make the statutory change on contracting without establishing any link to district revenue limit funding levels.
Under current law, the state provides COEs with general purpose funding—budgeted at about $330 million statewide—to provide statutory and discretionary services to their local school districts. While each COE uses this unrestricted portion of its revenue limit differently, activities generally include business support services, professional development, technology services, and credential monitoring for certificated staff.
Governor Proposes Cutting COE Revenue Limit to Encourage Greater Efficiencies. The Governor proposes to cut the unrestricted portion of the COE revenue limit by $45 million, or about 15 percent. As with the cut to school district revenue limits, this cut would be spread across all COEs based on ADA. To accommodate the reduction, the Governor proposes that COEs “consolidate services and functions,” including forming regional consortia. The proposal does not include any details on how these consolidations would take place, though the administration proposes language that would direct the Department of Finance, our office, and the California County Superintendents Educational Services Association to develop a more detailed plan.
Concept Has Merit, Lacks Detail. While some room for further consolidation of services across COEs likely exists, COEs currently face no explicit prohibitions on working more collaboratively on a regional basis. Because the administration’s plan is not yet fully developed, it remains unclear how the Governor envisions COEs might seek further regionalization of services. We think the Legislature should do more to encourage cooperation than simply cut COEs’ funding and hope they choose to work together.
Recommend More Structured County Office Regionalization Plan. To help address the state’s budget shortfall, we recommend reducing COE revenue limits by 10 percent, or about $33 million—somewhat less than the Governor’s proposed 15 percent cut. We also recommend creating a new “regional” revenue limit to establish a formal structure for sharing funding and services at the regional level. Specifically, we recommend redirecting an additional 10 percent of each COE’s unrestricted revenue limit funding into a regional COE revenue limit to be shared by all of the COEs in that region. While our proposal would result in a cumulative reduction of 20 percent to individual COE revenue limits, we believe a more modest COE cut, coupled with a new regional funding structure, is more likely to result in shared services and greater efficiencies.
Within New Structure, Regions Have Flexibility. Our proposed new framework would require COEs to communicate and collaborate over how to best use limited resources to meet the needs of the school districts in their region—increasingly imperative given the scale of the proposed COE and district budget reductions. Under our approach, each of the state’s existing 11 education regions would select one COE to be the fiscal agent over their share of this new $33 million grant. Spending decisions, however, would be shared among all the COEs in the region. The resulting arrangements likely would differ based on the individual characteristics of the regions and the strengths and needs of each county. For example, one region might direct a portion of its shared funds to one COE to make certain bulk purchases for all the districts in that region, while another region might instead dedicate the bulk of its shared funds to offering regional–based professional development workshops.
The state established the K–3 CSR program in 1996. Between 1996 and 2004, schools that opted to participate in the program were paid a per pupil rate for each K–3 class that had fewer than 20.4 students (on average throughout the course of year). If an average class size exceeded 20.4 students, a school would receive no CSR funding for that class. In 2004, the program was modified to allow a class to increase up to 21.9 students and still receive a small portion of the per pupil funding rate. As part of the February 2009 budget package, the program structure was significantly relaxed to allow schools to continue receiving funding for K–3 classes even in excess of 25 students. (For example, for classes of 23, a school now receives 80 percent of the per pupil rate for the first 20 students. For classes of 25 or more students, a school receives 70 percent of the per pupil funding rate for the first 20 students.) These rules are to remain in effect through 2011–12. The February package also specified that districts were eligible to receive funding only for the same number of classes for which it had applied as of January 31, 2009—essentially locking in district allocations for the next few years.
Governor Proposes to Capture CSR Savings. Data suggest that some districts did increase class sizes in 2009–10. As a result, the Governor assumes the program is technically overbudgeted by $340 million (or 19 percent) in 2009–10. He proposes midyear action to capture these savings. For 2010–11, the Governor expects many more districts will increase K–3 class sizes. Therefore, the Governor proposes to reduce funding for the program by $550 million in 2010–11 (compared to the 2009–10 Budget Act level).
Estimates of Anticipated Savings Optimistic. We believe the Governor’s assumptions regarding the likely increases in K–3 class sizes are too optimistic. While data show that some districts did increase K–3 class sizes in 2009–10, the increase in class size appears to be more modest than the administration assumes, with few districts likely to experience large reductions in their class allocations. Although actual CSR participation data are needed to calculate the precise amount of state savings that will materialize in 2009–10, we would recommend the Legislature be somewhat less aggressive in its budget estimate. Being more conservative in initial estimates will help ensure a new budget problem does not emerge later as a result of assumed savings not materializing. Until more refined data become available (in June 2010), we recommend the Legislature assume $200 million in 2009–10 savings. (Though we think the Governor’s budget–year estimate also is optimistic, we recommend the Legislature take a different approach in 2010–11, as described below.)
Recommend Placing K–3 CSR Program in K–12 Flex Item. Beginning in 2010–11, we recommend adding the K–3 CSR program to the K–12 flex item (which contains about 40 other categorical programs). In an effort to make this transition in the least problematic way, we recommend districts receive their 2007–08 allocation less 20 percent—essentially akin to the other programs in the flex item—regardless of their increase in class size in the intervening years. Statewide, this would generate $382 million in ongoing savings.
Parallels Our Other Recommendations to Provide More Flexibility, Budget More Transparently. This approach would offer districts greater flexibility by allowing them to determine class sizes within the context of their overall fiscal situation and education priorities. While our recommended approach means the state would forego additional CSR savings if districts were to increase class sizes even further in the future, we question the benefit of continuing the program under the existing program rules. Under these rules, many schools now receiving K–3 CSR funding are in essence no longer running a K–3 CSR program. Moreover, schools who chose to increase K–3 class sizes above 20 students prior to January 2009 are essentially locked out of the program whereas other schools that waited until after January 2009 to increase class sizes continue to receive funds.
Current law specifies that a COLA be applied annually to revenue limits and most K–12 categorical programs in order to reflect the higher costs that schools face due to inflation. The statutory K–12 COLA is based on an index that measures changes in costs experienced by state and local governments. School districts generally use COLAs to provide annual increases to employee salaries and address cost increases for local operating expenses, including employee benefits, utilities, materials, and supplies. However, due to the state budget crisis, the state has not provided COLAs in recent years—foregoing K–12 COLAs of 5.66 percent in 2008–09 and 4.25 percent in 2009–10.
Governor Proposes to Apply Negative COLA, Capture Savings. For the first time in over 60 years, in 2010–11 the index used to calculate the K–12 COLA is negative (–0.38 percent). This suggests the recession has led to a decrease in government costs, implying school districts might be able to purchase the same goods and services for less money. The Governor proposes to capture $201 million in savings by applying this negative adjustment to K–12 programs—$150 million from district and COE revenue limits and $51 million from various categorical programs.
Unreasonable to Apply Negative COLA After Not Applying Positive COLAs. While the recession could be resulting in some lower costs for schools, we believe applying a negative COLA is unreasonable. Given the state did not provide positive COLAs in recent years (and has made program reductions), school funding has not kept pace with inflation over the last few years.
Recommend Not Providing COLA. As it has in the past two years, we recommend the Legislature waive the statutory COLA provisions and avoid making inflationary adjustments to K–12 programs in 2010–11. As the state has continued to adjust the revenue limit “deficit factor” for changes in the cost of living, we would further recommend making the comparable downward adjustment to this future obligation. (The deficit factor is a statutory commitment to restore foregone COLAs to the revenue limit base in future years.)
California currently supports a variety of CCD programs using state and federal funding. The CDE administers all programs, with the exception of CalWORKs Stage 1 child care, which is administered by the Department of Social Services, as well as a small portion of the Stage 2 child care that is run by CCC. As shown in Figure 12, the Governor’s 2010–11 CCD proposed budget totals $2.8 billion, which is $316 million lower than the 2009–10 level. These funds would support CCD services for almost 415,000 children from birth through age 12 (or longer for children with special needs).
Figure 12
California Child Care and Development Programs
2010–11 (Dollars in Millions)
|
|
2008–09
Actual
|
2009–10
Revised
|
2010–11
Proposed
|
Change From 2009–10
|
|
|
Amount
|
Percent
|
|
CalWORKs Child Care
|
|
|
|
|
|
|
Stage 1
|
$616
|
$547
|
$444
|
–$103a
|
–18.8%
|
|
Stage 2b
|
505
|
476
|
436
|
–41
|
–8.5
|
|
Stage 3
|
418
|
409
|
262
|
–147
|
–36.0
|
|
Subtotals
|
($1,539)
|
($1,432)
|
($1,141)
|
(–$291)
|
(–20.3%)
|
|
Non–CalWORKs Child Care
|
|
|
|
|
|
|
General child care
|
$780
|
$797
|
$794
|
–$3
|
–0.4%
|
|
Other child care programs
|
329
|
321
|
303
|
–18
|
–5.6
|
|
Subtotals
|
($1,109)
|
($1,118)
|
($1,097)
|
(–$21)
|
(–1.9%)
|
|
State Preschool
|
$429
|
$439
|
$437
|
–$2
|
–0.4%
|
|
Support Programs
|
106
|
109
|
106
|
–2
|
–2.2
|
|
Totals
|
$3,183
|
$3,098
|
$2,782
|
–$316
|
–10.2%
|
|
State Funds
|
|
|
|
|
|
|
Proposition 98
|
$1,690
|
$1,824
|
$1,677
|
–$147
|
–8.1%
|
|
Non–Proposition 98
|
28
|
29
|
28
|
–2
|
–5.3
|
|
Other state fundsc
|
339
|
66
|
—
|
–66
|
–100.0
|
|
Federal Funds
|
|
|
|
|
|
|
Child Care and Development Fund
|
$528
|
$541
|
$540
|
–$1
|
–0.1%
|
|
TANFd
|
598
|
528
|
427
|
–101a
|
–19.2
|
|
ARRAe
|
—
|
110
|
110
|
—
|
—
|
Figure 13 summarizes the Governor’s CCD proposals and our recommendations. As shown in the figure, our recommendations result in less savings—$217 million instead of $316 million. If the Legislature were to spend at the same overall Proposition 98 level as the Governor, accepting our more modest CCD alternative would mean making additional budget cuts to K–12 education or the community colleges. Below, we discuss each of the Governor’s CCD proposals and our recommendations in more detail.
Figure 13
Summary of Child Care and Development Proposals
2010–11 (In Millions)
|
|
Governor
|
|
LAO
|
|
Issue
|
Proposal
|
Savings
|
|
Recommendation
|
Savings
|
|
Reimbursement rates for licensed providers
|
Reduce rate ceiling from 85th percentile to 75th percentile based on 2005 RMRa survey.
|
$19
|
|
Reduce rate ceiling to 60th percentile based on 2009 RMR survey.
|
—
|
|
Reimbursement rates for license–exempt providers
|
Reduce from 90 percent to 70 percent of reduced licensed rate.
|
113
|
|
Adopt Governor's proposal but base on LAO–recommended licensed rate.
|
$80
|
|
CalWORKs Stage 3
|
Reduce by 18,000 slots.
|
123
|
|
Reject Governor's proposal. Reduce eligibility ceiling to 60 percent of state median income (SMI).
|
15
|
|
Non–CalWORKs child care
|
No proposal.
|
—
|
|
Reduce eligibility ceiling to 60 percent of SMI. From savings, redirect $55 million to reduce waiting list.
|
60
|
|
Migrant child care
|
No proposal.
|
—
|
|
Align funding with program need.
|
7
|
|
Cost–of–Living Adjustment (COLA)
|
Reduce programs for –0.38 percent COLA.
|
6
|
|
Reject Governor's proposal.
|
—
|
|
Various programs
|
Make technical adjustments and fund swaps.
|
55
|
|
Adopt Governor's proposal.
|
55
|
|
Totals
|
|
$316
|
|
|
$217
|
|
Proposition 98
|
|
$147
|
|
|
$68
|
|
Federal Funds/Non–Proposition 98 General Fundb
|
169
|
|
|
149
|
Many families in the state‘s subsidized child care system—including families in the CalWORKs program as well as low–income families eligible for non–CalWORKs programs—receive care using state–funded vouchers. Currently, these vouchers reimburse licensed child care providers at a maximum rate equivalent to the 85th percentile of the rates charged by all providers in the region. Every two years, the state conducts a regional market rate (RMR) survey to collect data on these rates. License–exempt providers—typically relatives providing care without a license—are reimbursed at 90 percent of the maximum licensed rate.
Governor Proposes to Lower Provider Reimbursement Rate Ceilings. The Governor proposes lowering the maximum reimbursement rate from the 85th percentile to the 75th percentile of the RMR, based on the RMR survey conducted in 2005. The Governor also proposes to lower the reimbursements for license–exempt providers from 90 percent to 70 percent of the licensed rate. In combination, these rate reductions are estimated to generate $132 million in savings ($77 million Proposition 98). Under this proposal, the state would continue to pay for the same number of child care slots, but the maximum rate it would pay would be less for each slot.
Effects on Individual Providers and Families Would Depend on Current Rates. Because the child care market differs by county and not all providers of subsidized care currently charge the maximum reimbursable rate, the proposed change would effect individual providers in different ways. For example, licensed child care centers currently charging at the 85th percentile ceiling for full–time, preschool–age care in Los Angeles County would see their reimbursements drop from $744 to $660 a month, or by about 11 percent. Similar providers charging at the ceiling in San Bernadino County would see their reimbursements drop from $676 to $581 per month, or by about 14 percent. Providers could respond by maintaining current rates and charging families the difference. (Families selecting providers that charge more than the state reimbursement ceiling have to make up the difference in price.) Alternatively, providers could lower rates to align with the lowered state ceiling in an effort to keep service affordable for subsidized clients. To the extent providers’ current rates are between the 75th and 85th percentiles for their region, they would be less affected by this change. Providers currently charging below the 75th percentile would be unaffected.
Lowering Rate Ceilings Is Reasonable…We believe the Governor’s proposals to lower provider reimbursement rates have merit. Lowering the licensed provider reimbursement ceiling to the 75th percentile would be consistent with the federally suggested rate (which the state currently exceeds). Reimbursing license–exempt providers at 70 percent of the licensed rate also seems reasonable, as these providers have lower overhead costs and might be of lower quality (having not met licensing requirements). California’s current standard for license–exempt reimbursements also is significantly higher than in other states, where the license–exempt rates typically range between 50 percent and 70 percent of the licensed rate.
…Using Outdated Survey Data Is Not. Provider reimbursement rates are based on regional market data in order to reflect current market conditions and ensure that state–subsidized families, regardless of where they live, have access to the same quality care as most private–paying families. Using the 2005 RMR survey—that is, data that is five years old—runs counter to this policy goal and underestimates the actual child care market rates that state–subsidized families and providers currently face. While the Governor claims to be following federal guidance by using the 75th percentile of the RMR, what the federal government actually requires is that payment rates “reflect the child care market.” The Governor’s proposal reflects the market of 2005, not 2010.
Recommend Lowering Rate Ceilings but Using More Recent Survey Data. We recommend the Legislature develop a reimbursement policy that reflects current market conditions and, given the state’s fiscal status, is affordable. Specifically, we recommend the Legislature use the 2009 RMR survey and set licensed provider reimbursement ceilings at whatever level is roughly comparable to current–law rates. We estimate this would be at about the 60th percentile.
Approach Is More Straightforward, Transparent, and Defensible. While this change may seem dramatic, the inflationary rate increases reflected in the 2009 survey data would actually offset the drop in the ceiling. That is, after making this change, most providers charging the maximum reimbursable rate would receive about the same amount using the 60th percentile of the 2009 RMR as they do using the 85th percentile of the 2005 RMR. (The net effect of the change likely would differ in each county, with some providers receiving slightly more or slightly less than under current law based on changing market conditions in their region.) Compared to the Governor’s proposal, providers would receive a higher rate and the state would not achieve a notable amount of savings. However, we believe basing state policy on artificial reimbursement targets that have little relation to the actual child care market is nonsensical. As the state’s fiscal condition improves, the Legislature could opt to increase the reimbursement ceilings to a higher percentile of the actual market rates for the region.
Recommend Adopting Governor’s Proposal for License–Exempt Providers. Because they have lower overhead costs and might be of lower quality, we recommend the Legislature reduce reimbursement rates for license–exempt child care providers from 90 percent to 70 percent of the licensed rate. Because our recommended rate for licensed providers is higher compared to the Governor’s proposal, license–exempt providers would still be reimbursed at higher rates under our proposal. As such, the state would also realize fewer savings from this change—we estimate about $80 million ($45 million Proposition 98) compared to the Governor’s $113 million.
State law requires that child care must be available to CalWORKs recipients receiving cash aid in order to meet their program participation requirements. The CalWORKs child care is delivered in three stages:
- Stage 1 begins when a participant enters the CalWORKs system.
- Stage 2 lasts from when the county deems families to be “stable” until up to two years after they stop receiving cash aid.
- Stage 3 is provided to former CalWORKs recipients as long as their income remains below 75 percent of the state median income (SMI) and their children are younger than age 13.
Families often use the same child care provider throughout these different stages of CalWORKs.
Other Low–Income Families Receive Care Based on Available Funded Slots. In addition, the state provides subsidized child care for families who do not participate in CalWORKs but earn less than 75 percent of the SMI. However, these non–CalWORKs programs typically do not have sufficient space to accommodate all eligible low–income children, so waiting lists are common.
Governor Proposes to Eliminate Almost One–Third of Stage 3 Child Care Slots. The Governor proposes to cut CalWORKs Stage 3 child care by $123 million—eliminating about 18,000, or one–third, of all Stage 3 slots. The administration estimates roughly 11,000 of these slots could be eliminated by not backfilling for normal Stage 3 attrition. In other words, as families leave Stage 3, their slots would be eliminated. This means a like amount of children from families transitioning out of Stage 2 status would face a sudden loss of child care services. Additionally, the administration estimates roughly 7,000 children would have to be disenrolled from current Stage 3 placements, with lower–income families receiving priority for maintaining care.
Proposal Would Displace Some of State’s Neediest Families. Presumably, the displaced CalWORKs families would instead seek care from the state’s subsidized non–CalWORKs programs. However, because roughly 200,000 children are on waiting lists for non–CalWORKs slots, the families displaced by the Stage 3 change would not be guaranteed subsidized care. We have concerns about what this might mean for transitioning Stage 2 families who have recently worked their way off of cash aid, likely earn well below the SMI, and could be at risk of going back on CalWORKs aid if they suddenly lose their child care.
Recommend Rejecting Governor’s Proposal, Lowering Eligibility Ceilings, and Preserving Services for Neediest Families. Because it would terminate child care for some of the state’s lowest income families and put them at risk of renewed dependency on state aid, we recommend rejecting the Governor’s Stage 3 proposal. Instead, we recommend the Legislature achieve CCD savings by lowering eligibility criteria for Stage 3 subsidized child care from 75 percent to 60 percent of the SMI. This would mean the highest income Stage 3 families would lose care, but services for the lowest income families would be protected. We estimate approximately 4,000 children currently receiving Stage 3 care are from families who earn more than 60 percent of the SMI (60 percent of the SMI equates to a monthly income of about $3,350 for a family of four.) We estimate this change would lead to about $15 million in Proposition 98 savings in 2010–11.
Also Recommend Lowering Eligibility Ceilings for Non–CalWORKs Programs and Redirecting Portion of Savings to Expand Access for Neediest Families. We recommend the Legislature make the same change to the eligibility ceiling for non–CalWORKs subsidized child care. We estimate this would displace approximately 14,000 children from the highest income families currently being served and reduce associated costs by $115 million. Of this amount, we recommend the state capture $60 million in savings while redirecting $55 million in freed–up funds to serve more of the neediest children. This redirection would expand access for 5,000 to 6,000 children from the lowest income families currently waiting for care. We believe such a redirection would be appropriate because the unmet demand from very low–income families for non–CalWORKs care is so high.
Tough fiscal times can be an impetus for exploring more effective ways to deliver services. Particularly given the state’s current budget problems, we believe a number of changes to the state’s child care system that have been suggested by our office and others over the past decade merit renewed consideration. These include making Stage 3 a limited–term transitional program only for families who have recently moved off of state aid and revising the state’s family fee structure to institute modest increases in the amounts some families pay for care. Changes such as these could lead to both short– and long–term budgetary savings.
The state’s child care program for children of agricultural workers consistently has unspent funds at the end of the year. According to CDE, this is due in part to the changing demographics of the state, with a trend toward fewer eligible migrant families. As a result of less participation, we believe ongoing funding for the program can be reduced by $7 million (from $36 million to $29 million) without affecting services or slots.
Like his proposal for K–12 and community college programs, the Governor proposes to capture $6 million in savings by applying a –0.38 percent COLA to CCD programs. As discussed in the “Major K–12 Budget Reductions” section of this report, we believe adjusting program funding for a negative COLA after two consecutive years of the state not providing positive COLAs is unreasonable. Consistent with our recommendation for K–14 programs, we therefore recommend rejecting the Governor’s comparable proposal for CCD programs.
In addition to the proposed spending reductions to K–12 education and child care, the Governor’s plan includes many proposals related to the state’s teacher personnel policies (see Figure 14). These proposals would amend various existing state laws governing teacher layoffs, tenure, and dismissals. Though the proposals could result in district–level savings, the administration’s stated purpose is to grant greater discretion to district administrators, particularly in response to difficult budget situations, as well as make other personnel processes more efficient. Below, we first discuss the trade–offs the Legislature faces in deciding the appropriate role of the state in local personnel matters. We then assess each of the Governor’s teacher policy proposals.
Figure 14
Summary of Teacher Policy Proposals
|
Teacher Policy
|
Current Law
|
Governor's Proposal
|
LAO Recommendation
|
|
Layoff notices
|
Requires districts to notify teachers of possible layoff by March 15, with final layoff decisions to be made by May 15.
|
Give districts until the last day of school year to make layoff decisions.
|
Give districts until June 1 to make layoff decisions, with exception for major midyear budget adjustments.
|
|
Layoff hearings
|
Allows laid–off teachers of a given district to collectively participate in a "Reduction–in–Force" hearing to ensure district had cause to lay off the noticed teachers.
|
Eliminate hearings.
|
Adopt Governor's proposal. (Teachers still could file suit in court.)
|
|
Use of seniority in staffing decisions
|
Requires that districts must use seniority to determine the order in which teachers are laid off, transferred, assigned, or reassigned.
|
Base decisions instead on “effectiveness and subject matter needs.”
|
Require districts to use evaluations instead of seniority, beginning 2012.
|
|
Priority for substitute teaching positions
|
Requires that laid–off teachers be given first priority for substitute teaching assignments and that districts pay at pre–layoff rates.
|
Remove restrictions on substitute hiring and pay.
|
Adopt Governor’s proposal.
|
|
Probationary period
|
Probationary teachers are observed for two years before districts must decide whether to grant permanent status.
|
Allow two additional years of observation before districts must make decision to grant permanent status.
|
Adopt Governor’s proposal.
|
|
Dismissal notices
|
Districts must issue notices to dismiss teachers between September 16 and May 14.
|
Allow districts to issue dismissal notices at any time.
|
Reject Governor’s proposal.
|
|
Compensation for dismissed teachers during hearing process
|
With exception of teachers immediately suspended, districts must provide salary and benefits to teachers until the conclusion of their dismissal case (until all appeals exhausted).
|
Allow districts to cease paying salary and benefits to teachers immediately upon service of dismissal notice. Pay back wages to teachers ultimately reinstated.
|
Adopt Governor’s proposal but require districts to pay interest on foregone salary payments if teacher prevails.
|
|
Allowable evidence in dismissal hearings
|
Only evidence from the four years prior to the date on which the district served notice to a teacher may be heard in a dismissal case.
|
Remove limitation on prior evidence. Allow all relevant evidence to be heard.
|
Adopt Governor’s proposal.
|
|
Dismissal panel
|
Permanent teachers’ dismissal hearings are heard before a three–person panel (CPC), including an administrative law judge and two teachers.
|
Remove two teachers from panel.
|
Adopt Governor’s proposal.
|
|
Dismissal rulings
|
The ruling of the CPC is binding.
|
Change the ruling of the CPC to advisory. Give local governing board final decision–making power.
|
Reject Governor’s proposal.
|
The Legislature faces difficult trade–offs in deciding what role, if any, the state should have in local personnel matters. Currently, the state asserts a relatively strong role in local personnel matters. State law, for example, lays out the procedures school districts must use when making teacher assignments, specifies how much districts are to pay certain substitute teachers, designates when school districts are to notify teachers of possible layoff, prescribes certain teacher evaluation processes, and sets forth guidelines for determining teacher compensation levels.
State Control Likely Duplicative, Might Be Unnecessarily Restrictive. In addition to these state requirements, most personnel matters are collectively bargained at the local level—a process that is purposefully designed to protect teacher interests. As a result, state laws are largely duplicative of many of the provisions contained in local teacher contracts. Moreover, by having one–size–fits–all personnel policies, the state could be unnecessarily restraining districts from crafting policies better suited for their particular teacher and student populations. That is, allowing districts little choice and little flexibility in personnel matters could be creating unnecessary challenges at the local level and preventing some districts from implementing more efficient and effective policies that promote the overall quality of the education program.
State Control Might Be Ensuring Fair and Uniform System. On the other hand, determining personnel policies at the state level ensures that all school districts adhere to a uniform set of rules in making their personnel decisions. That is, state policies can help ensure that districts do not make decisions arbitrarily or based on political or personal motivations. If the state were to repeal its laws regarding personnel decisions, some districts potentially could abuse their local authority and treat teachers poorly.
Legislature Could Take One of Two Approaches. The Legislature’s response to the Governor’s teacher policy proposals will depend on its perspective regarding the appropriate role of the state in local personnel matters. It has two basic approaches:
- State Could Repeal Applicable Laws. If the Legislature were to decide that the state should not have prescriptive laws governing specific local personnel decisions, then we would recommend repealing many of the state provisions at issue under the Governor’s proposals. In some instances, this would entail approving the Governor’s proposal (for example, he recommends repealing certain existing substitute teaching provisions). In other instances, it would entail rejecting the Governor’s proposal (for example, he amends rather than repeals the state’s existing seniority provisions).
- State Could Amend Laws to Better Align With Overarching Objectives. Alternatively, if the Legislature believes the state should have laws governing local personnel decisions, we would recommend modifying many of the Governor’s proposals to ensure they promote education quality to the greatest extent possible. For example, rather than replacing seniority with “effectiveness” for the basis of layoffs, we would recommend using teacher evaluations as a more concrete alternative.
The remainder of this section assumes the Legislature decides to retain a general approach of enacting state laws to govern teacher personnel policies. Thus, in response to each of the Governor’s proposals, we provide various alternatives for improving state laws, as discussed below.
Existing state law sets forth dates by which districts must notify teachers of possible layoff (March 15 prior to the ensuing school year) and make final termination decisions (May 15). Existing state law also contains a later layoff window that districts may use if certain conditions are met. Specifically, if a district is able to prove that its total revenue limit per unit of ADA for the coming year has not increased by at least 2 percent, then it may lay off additional teachers beginning five days following the passage of the budget act through August 15.
Governor Proposes Amending Layoff Notification Dates. In place of these dates, the Governor proposes to allow districts to wait until the end of the school year to issue layoff notices. Unlike the notices currently issued by March 15, these notices would be final. The Governor’s proposal also eliminates hearings associated with a layoff. The administration’s stated intent is to help districts respond to budget reductions, streamline the layoff process, minimize over–notification, and reduce unnecessary anxiety among teachers. (Currently, districts can feel compelled to assume the worst–case budget scenario in March, and, as a result, issue widespread layoff notices.)
Laudable Objectives but Potential Complications. While the Governor’s proposal has the laudable objectives of both helping districts respond to major reductions in state funding and reducing the number of teachers who receive premature layoff notices, it could create unnecessary complications. As schools are on different schedules, with roughly 1,000 (or 1 in 10) operating year–round programs, not setting a specific date for layoffs could lead to some teachers being disadvantaged relative to other teachers. Teachers in year–round programs could be most adversely affected as they face the greatest chance of being noticed in a month that is out of sync with most district hiring, increasing the difficulty these teachers would have in finding alternate employment.
Recommend Amending Law to Allow Districts Until June 1 to Make Layoffs. Rather than specifying “the end of the school year” as the final date by which districts must make layoffs, we recommend allowing districts until June 1 to make these decisions. By waiting until after the Governor’s May Revision, districts would have better information regarding the state budget and its likely impact on their local budget. By being able to rely on May Revision estimates rather than feel compelled to assume the worst–case budget scenario, districts could more accurately calculate how many layoffs are needed. Further, by setting a uniform date, teachers and schools will be better able to coordinate job–seeking and hiring.
Recommend Amending August 15 Layoff. While trying to minimize disruptions to teachers and students, we recognize the need for districts to be able to respond to major unexpected reductions in state funding. To this end, we recommend allowing districts to make further reductions in staff for a period of 30 days following the enactment of a budget that reduces K–12 spending by 5 percent or more from the May Revision level. We would not expect such a provision to be used very often, but it would give districts some additional flexibility to cope with extreme decreases to their presumed funding levels. While this risks classroom disruption, such a window could be needed for some districts to remain solvent given a particularly large and unforeseen budget reduction.
During the two–month period from March 15 to May 15, a teacher identified for possible layoff may request a hearing, commonly called a Reduction–in–Force (RIF) hearing. The primary purpose of these hearings is to determine if a district has cause for reducing the size of its teaching force. State law specifies that these hearings are to be conducted by an administrative law judge (ALJ) at the expense of the district. The judge is required to submit a proposed decision to the local governing board no later than May 7. The governing board may then accept or reject the ALJ’s recommendations. If a teacher disagrees with the board’s decision, then he/she may file a writ with the Superior Court. (We are not aware of a similar RIF hearing process for any other group of public employees.)
Governor Proposes to Eliminate Layoff Hearings. Under the Governor’s proposal, a teacher would no longer be entitled to a RIF hearing. Should a teacher believe an error has been made regarding his or her seniority rights or that the district did not have cause to make a RIF, he/she would then appeal directly to human resources. If the matter remained unresolved, the teacher could file a writ with a Superior Court to contest the layoff.
Recommend Adopting Governor’s Proposal to Eliminate Hearings. The current hearing process introduces inefficiency as it encourages all teachers to contest their layoffs rather than only those who have legitimate concerns that their seniority rights have been violated. This then inflates the cost of the layoff process, placing added financial burden on the district (which must provide security and substitute teachers for all noticed employees for the duration of the trial). Further, as the ALJ’s role is only advisory, it is unclear that the judge serves a critical role. Finally, because teachers have alternate means of contesting layoffs (going directly to human resources or Superior Court), we believe the RIF hearings are unnecessary. For these reasons, we recommend adopting the Governor’s proposal and eliminating the hearings. If districts and local teachers wished to negotiate a specific process for handling layoffs, they would be free to do so through local collective bargaining.
Existing state law contains seniority provisions that affect teacher layoffs as well as teacher assignments, reassignments, and transfers. Specifically, state law requires these personnel decisions be based first on a teacher’s credential(s) followed by years of service. (To decide among teachers with equal credentials and seniority, districts must set forth additional selection criteria, such as a teacher’s level of education.) Exceptions are made only in cases where the district can demonstrate a need for teachers with specific skills or credentials that more senior teachers do not posses. For layoff decisions, employers must terminate probationary teachers first, followed by the least senior permanent teachers.
Governor Proposes to Allow Districts to Use “Effectiveness and Subject Matter Needs” in Place of Seniority. The Governor proposes allowing districts to make these personnel decisions on the basis of “effectiveness and subject matter needs without regard to seniority.” This would allow districts to lay off more senior teachers if they were determined to be less critical to a school’s needs. If laid off teachers wished to be rehired in the future, they would then need to reapply for positions with no preference awarded for years of service.
Governor’s Proposal Could Enhance Educational Quality. Though the seniority system was designed to provide a transparent and objective method for making personnel decisions, it can limit principals’ ability to retain their most effective teachers. Ample research has shown that seniority is not strongly tied to effectiveness. Specifically, research shows that teachers tend to improve in effectiveness during their first five years of service but do not seem to uniformly improve after this time. Thus, a teacher with 20 years of experience will not necessarily outperform a teacher with eight years of experience. By allowing districts to use alternatives to seniority that are better measures of effectiveness, the Governor’s proposal therefore could enhance educational quality.
At Current Time, No Really Good, Reliable Measure of Effectiveness Widely Used. Though the Governor’s proposal has the potential to enhance education quality by allowing principals to select the most effective teachers regardless of seniority, it includes no alternative measure for effectiveness that administrators may use in lieu of seniority. The obvious mechanism for differentiating among existing teachers—the annual performance evaluation—is currently low stakes, with virtually no connection to pay, promotion, or dismissal. Consequently, some schools have not developed rigorous evaluations, and some teacher evaluations have been criticized for being poorly designed and conducted. To the extent this is the case, some administrators may lack the ability to accurately distinguish among the effectiveness of some teachers. Further, in the absence of good information on relative effectiveness, administrators may be tempted for fiscal reasons to dismiss higher–paid members of their staff.
Could Result in More Layoff Hearings, Higher Legal Costs. Given that some districts currently might lack an objective, rigorous, reliable alternative to seniority, their personnel decisions under the Governor’s proposal could be viewed as arbitrary and thus be more frequently challenged. If so, both districts and unions could face lengthier and more acrimonious termination hearings or court cases. This would increase districts’ and unions’ legal costs and would likely lower overall employee morale.
Recommend Use of Performance Evaluations as Alternative to Seniority. If the Legislature decides that state laws should continue to govern teacher layoffs and assignments, then we recommend the Legislature eliminate the requirement that districts base these decisions on seniority. However, to minimize the likelihood of arbitrary dismissals and the potential for more contested termination hearings, we also recommend the Legislature adopt a more concrete measure of effectiveness. Specifically, we recommend the Legislature amend state law to require administrators to use performance evaluations in these personnel decisions. Requiring the use of data measuring effectiveness in an objective and consistent manner would help minimize the risk of arbitrary dismissals or dismissals based primarily on salary costs.
Likely Would Take Time to See Results, but Could Improve Overall Evaluation System. Such a change in state law likely would take time before having a notable effect on district behavior. This is because some local evaluation tools would need to be improved before administrators and teachers viewed them as useful guides in making personnel decisions. Improvements to local evaluation systems could take a few years to develop, negotiate, and implement effectively. Thus, we recommend allowing for a two–year window during which these improvements could be made, with the new policy applying to labor contracts entered into after January 1, 2012. Despite the lag time needed to implement the policy, the state’s overall teacher evaluation system ultimately could be significantly improved, which, in turn, would help improve the overall quality of K–12 education.
Existing state law specifies that permanent and probationary teachers who have been laid off due to a reduction in the teacher workforce shall be guaranteed first priority for substitute teaching positions, with these positions granted in order of seniority. If a laid–off teacher accepts a substitute teaching assignment and works more than 20 days within a 60–day period, state law also requires that he/she be paid at equal to or greater than his/her pre–layoff salary rate.
Governor Proposes to Remove State Rules for Hiring and Paying Substitute Teachers. The Governor proposes to allow districts to hire any qualified substitute teacher regardless of seniority and set pay rates irrespective of length of substitute assignment or pre–layoff salary level.
Recommend Legislature Adopt Proposal. This proposal would provide several benefits without major risks. Specifically, it would give districts discretion in the rate paid to substitute teachers, with potential savings from being able to hire less expensive substitute teachers. It also would allow districts to choose among a larger pool of qualified candidates, including retired teachers. While some teachers who otherwise would have been entitled to substitute teaching positions might no longer receive them, the state would have no prohibition against administrators and teachers negotiating similar provisions in their local contract agreements.
Currently, districts must decide whether to grant permanent status (commonly called tenure) by March 15 of a probationary teacher’s second year. If a school has not given notice of termination by March 15, the teacher is granted permanent status with certain attending protections from dismissal. Given this timeframe, administrators have less than two full years of observing a beginning teacher before they must make the tenure decision. Should an administrator elect to deny tenure, that teacher is terminated for the following school year.
Governor Proposes Allowing Two Additional Probationary Years. The Governor proposes to extend the probationary period for up to two additional years. (As discussed in the nearby box, California previously had a three–year probationary period.) While administrators would still be allowed to grant tenure to those they deem qualified after two years, in cases wherein the probationary teacher has not demonstrated adequate proficiency, the administrator could extend the probationary period. The Governor’s aim with this proposal is to improve the quality of the teacher workforce and decrease the possibility of losing the state’s investment in probationary teachers who may prove effective with an additional year or two of training.
|
The state has explored alternative probationary periods in the past. Between 1959 and 1983, probationary teachers served three years before administrators had to make the decision whether to grant permanent status. In 1983, the state enacted major changes to state teacher policies, including changes to tenure and dismissals. Specifically, the state shortened the probationary period from three to two years. However, the state also made it easier to dismiss probationary teachers, removing certain due process rights. |
Recommend Approving Governor’s Proposal. We believe allowing districts to grant clearly proficient teachers permanent status toward the end of their second year while also allowing more opportunity to observe borderline beginning teachers could result in a more effective overall teacher workforce. An extension of the probationary period also would help minimize unnecessary terminations and alleviate the costs associated with losing teachers who might still improve, as districts and the state invest considerable resources in both teacher preparation and beginning–teacher support programs. Further, we believe this change would not notably hamper teacher recruitment, as proficient teachers could still be granted tenure within the state’s existing timeframe. Lastly, we believe the likelihood this change would increase arbitrary dismissals is quite low, as districts have both a financial and programmatic interest in training and retaining effective teachers. For these reasons, we recommend adopting the Governor’s proposal.
Currently, to dismiss a teacher for nonfinancial reasons, including unsatisfactory performance or unprofessional conduct, a school district must issue the teacher a suspension or dismissal notice sometime between September 16 and May 14. The teacher then has 30 days from the date of the notice to request a hearing. The teacher continues to receive salary and benefits until a Committee on Professional Competence (CPC) rules to dismiss, suspend, or retain the teacher.
Composition of CPC Panel. Hearings take place before the CPC, a panel consisting of an ALJ and two teachers. The district chooses one teacher and the noticed employee chooses the other teacher. The teachers chosen for the panel cannot teach within the employee’s district nor be related to the employee. The two teachers on the panel also must hold a valid teaching credential and have at least five years of experience within the past ten years in the discipline of the dismissed teacher.
Commission Proceedings. In a teacher dismissal hearing, only records from the four years prior to the filing date are admissible. Similarly, only testimony regarding the previous four years may be considered. Therefore, any performance evaluations occurring prior to the preceding four years may not be considered. The CPC’s ruling is determined by a majority vote of the three–person panel. The panel may vote to dismiss, suspend without pay, or retain the teacher. This decision is binding (though teachers who disagree with the ruling can file suit in court).
Governor Proposes Various Changes to Dismissal Proceedings. Specifically, the Governor proposes to change these proceedings in the following ways:
- Remove Restrictions on Timing of Dismissal Notices. The Governor proposes to allow districts to issue dismissal notices at any time. If enacted, districts would be able to notice teachers of a dismissal or suspension between May 15 and September 15.
- Eliminates Salary and Benefits for Noticed Teachers. Under the Governor’s proposal, a teacher would cease receiving salary and benefits upon the service of the notice to dismiss or suspend. Should the teacher prevail in the hearing, the district would pay back wages and benefits to the teacher.
- Eliminates Four–Year Evidentiary Bar. The Governor proposes to remove the four–year limitation on evidence that may be considered in a teacher dismissal hearing. This would effectively allow any relevant evidence to be considered.
- Eliminates Teacher Representatives on the CPC, Makes Judge’s Ruling Advisory Rather Than Binding. The Governor proposes restructuring the CPC by eliminating the two teacher representatives. Under his proposal, the ALJ would hear the dismissal case, make a recommendation to the local school district governing board, and the governing board would issue the final decision of whether to dismiss, suspend, or retain the teacher. Via these changes, the Governor intends to streamline the dismissal process and endow local governing boards with more authority over personnel decisions.
Overall Goals Laudable, Have Concerns With Implementation. Overall, we agree with the Governor’s intention to streamline the dismissal process. However, we believe that some of the proposed changes would provide little benefit and introduce unnecessary risks. Thus, we would recommend approving some of the Governor’s proposals (those that likely would streamline the process) while rejecting others (those that have little benefit and high risk), as detailed below.
Recommend Rejecting Change to Dismissal Notice Window. While we appreciate the desire to provide districts greater flexibility, it is unclear that many schools are currently in need of this flexibility. Districts already have nine months during which they may issue dismissal or suspension notices. Further, teachers’ availability varies widely in the window between May 15 and September 15, as these are vacation months for most teachers—raising the risk that administrators could be tempted to notice teachers during this window to avoid due process proceedings.
Recommend Adopting Governor’s Proposal to Suspend Teacher Salary Upon Service of Dismissal Notice but Require Back Payments if Teacher Prevails. We recommend adopting the Governor’s proposal to allow districts to suspend salary and benefits for teachers who have been served a dismissal notice but require districts to pay back wages and benefits to those teachers who prevail in the ruling. However, we further recommend districts be required to pay interest accrued on the foregone salary payments if the teacher prevails. Together, these changes would improve the current system, which provides incentives for teachers to artificially extend the length of the trial and offers no recourse for districts to recover those payments should the district prevail. We do not think the recommended changes would create similar incentives for districts to increase the length of the trial themselves, as salary and interest would need to be paid should the employee prevail. In short, the new system would do a better job of ensuring that neither teacher nor district has a financial incentive to prolong the dismissal process.
Recommend Adopting Change to Evidentiary Limits. We recommend adopting the Governor’s proposal to allow the CPC access to all records and evidence concerning a teacher’s fitness for the classroom. Most importantly, in cases where prior charges of teacher misconduct are at issue, limiting evidence could work at crosspurposes with protecting students.
Recommend Adopting Proposal to Restructure CPC. We recommend adopting the Governor’s proposed changes to remove the two teacher representatives from the CPC. Teachers with experience in the terminated employee’s discipline, however, could remain involved in the trial if needed as witnesses rather than panel members. This would provide much of the benefit gained by requiring two teachers on the panel but would reduce the associated costs. Further, the current process places an unnecessary burden on districts to remove teachers from classrooms for the purposes of serving on a panel.
Recommend Retaining Role of ALJ. It is unclear to us that shifting the final decision to the governing board would streamline or improve the dismissal process. If the governing board did not act on the advice of the ALJ, the teacher would have a high likelihood of taking the case to court. In such cases, the Governor’s approach would have just added another step to the existing process. Thus, this proposal appears to make the process less efficient. To make this dismissal process as streamlined as possible, we recommend retaining the existing role of the ALJ.
As shown in Figure 15, California annually receives more than $6 billion in federal funds to support K–12 education. While some of this funding is awarded competitively, most federal funding is provided on a formula basis to target particular student populations, such as low–income students and students with disabilities. As reflected in the figure, ongoing federal funding has grown modestly in recent years. In addition to ongoing federal funding, the state received more than $6 billion in one–time support for K–12 education through ARRA. While California distributed most of its unrestricted ARRA funds to school districts in 2009, these funds can be spent through 2010–11. In addition, significant monies from the stimulus package associated with specific activities, such as school improvement and education data, remain uncommitted.
Figure 15
Federal Funding for K–12 Education
(Dollars in Millions)
|
|
2008–09 Actual
|
2009–10 Actual
|
2010–11 Estimated
|
Change From 2009–10 to 2010–11
|
Federal Stimulusa
|
|
|
Amount
|
Percent
|
|
No Child Left Behind (NCLB) Programs
|
|
|
|
|
|
Title I
|
|
|
|
|
|
|
|
Title I Basic
|
$1,698.8
|
$1,651.6
|
$1,711.0
|
$59.4
|
3.6%
|
$1,124.9
|
|
School Improvement
|
61.8
|
64.1
|
68.4
|
4.3
|
6.6
|
351.8
|
|
Reading First
|
50.8
|
—
|
—
|
—
|
—
|
—
|
|
Even Start
|
7.3
|
6.9
|
7.2
|
0.3
|
3.7
|
—
|
|
Migrant Student Education
|
129.1
|
139.8
|
135.3
|
–4.5
|
–3.2
|
—
|
|
Neglected and Delinquent Children
|
2.6
|
2.4
|
2.4
|
—
|
–1.0
|
—
|
|
Impact Aid
|
55.8
|
64.7
|
66.7
|
2.0
|
3.1
|
1.4
|
|
Advanced Placement
|
3.5
|
4.4
|
4.4
|
—
|
—
|
—
|
|
Title II
|
|
|
|
|
|
|
|
Improving Teacher Quality
|
$332.9
|
$327.1
|
$331.1
|
$4.0
|
1.2%
|
—
|
|
Mathematics and Science Partnerships
|
21.9
|
20.0
|
21.2
|
1.2
|
5.9
|
—
|
|
Educational Technology
|
30.6
|
29.1
|
10.6
|
–18.5
|
–63.6
|
$71.6
|
|
Title III
|
|
|
|
|
|
|
|
Language Acquisition
|
$164.5
|
$168.5
|
$179.3
|
$10.8
|
6.4%
|
—
|
|
Title IV
|
|
|
|
|
|
|
|
Safe and Drug–Free Schools
|
$35.2
|
$35.2
|
—
|
–$35.2
|
–100.0%
|
—
|
|
21st Century After School
|
132.0
|
130.9
|
$127.4
|
–3.5
|
–2.6
|
—
|
|
Title VI
|
|
|
|
|
|
|
|
State Assessments
|
$32.9
|
$32.8
|
$32.8
|
—
|
–0.1%
|
—
|
|
Rural and Low–Income Schools
|
1.2
|
1.2
|
1.2
|
—
|
–3.2
|
—
|
|
Small, Rural School Achievement
|
6.3
|
6.4
|
6.6
|
0.2
|
2.8
|
—
|
|
Non–NCLB Programs
|
|
|
|
|
|
|
|
Homeless Children and Youth
|
$7.6
|
$12.8
|
$8.0
|
–$4.8
|
–37.5%
|
$13.8
|
|
Special Education
|
1,256.9
|
1,310.8
|
1,309.7
|
–1.1
|
–0.1
|
1,327.7
|
|
Vocational and Adult Education
|
139.8
|
139.6
|
139.6
|
—
|
—
|
—
|
|
Cal–Serve/Service America
|
1.8
|
2.1
|
2.1
|
—
|
—
|
—
|
|
Charter Schoolsb
|
48.0
|
48.0
|
48.0
|
—
|
—
|
—
|
|
Child Nutrition
|
1,757.0
|
2,035.0
|
2,191.4
|
156.4
|
7.7
|
12.9
|
|
Child Development
|
532.3
|
523.3
|
510.6
|
–12.7
|
–2.4
|
220.3
|
|
State Fiscal Stabilization Fund
|
—
|
—
|
—
|
—
|
—
|
3,132.0
|
|
Totals
|
$6,510.6
|
$6,756.7
|
$6,914.9
|
$158.2
|
2.3%
|
$6,243.5
|
In this section, we examine three issues related to federal funding. Specifically, we analyze the Governor’s proposals to: (1) seek additional one–time federal support for special education, (2) authorize ARRA funding for local education data efforts, and (3) provide federal and state funding for turning around low–performing schools. In each case, we recommend an alternative to the administration’s proposal.
In 2010–11, California expects to receive $1.3 billion in ongoing federal funding for special education. These funds are part of a longstanding federal commitment to help states pay for the education of students with disabilities. In 1975, Congress passed the first piece of federal legislation protecting the right of students with disabilities to a “free and appropriate public education.” The law was largely a response to growing national awareness that many states were either excluding students with disabilities from the education system or severely limiting their access. While this law’s successor, the Individuals with Disabilities Act (IDEA), has used different methods to allocate funding to states over time, the general intent was to help states afford the additional costs generated by the federal requirements. Under the current allocation method, IDEA funds are provided to states based on their relative school–age populations (85 percent) and school–age populations living in poverty (15 percent).
IDEA Designed to Cover 40 Percent of Excess Cost of Educating Students With Disabilities. The IDEA set forth a policy that the federal government would cover a maximum of 40 percent of excess special education costs, with states and local education agencies to cover remaining costs. (This target is often referred to as “full funding.”) To determine how much of the excess cost it is covering, the federal government estimates the total nationwide cost of educating students with disabilities in excess of the cost of non–special education students, then determines the percent covered by the IDEA appropriation. (That is, the federal methodology is based on a single national average, not state–specific special education expenditures.) Presumably with the intent of increasing the federal share up to the 40–percent target, the 2004 reauthorization of IDEA included a long–term funding schedule by which nationwide IDEA appropriations were intended to increase roughly $2 billion annually.
Administration Seeks Special Fiscal Relief for California. The 2010–11 Governor’s Budget includes a plan to request additional federal funding related to special education. In essence, the administration is seeking a one–time, California–specific federal allocation of $1 billion as compensation for the federal government not covering 40 percent of special education costs. (The $1 billion equates very roughly to about one year of special education costs that would have been covered by the federal government had the 40 percent target been met.) Nonetheless, if the additional funds were to materialize, they would not be used for ongoing special education costs under the Governor’s plan. Instead, the $1 billion would be placed directly in the General Fund to provide general fiscal relief to the state.
Governor’s Approach Needs Work. Although we generally support the Governor’s efforts to obtain more federal funding for special education, the administration’s approach has two key shortcomings. First, by planning to use the money for general fiscal relief, the administration misses an opportunity to make a strong case on policy grounds for additional IDEA funding. Second, California does not have a unique claim for receiving additional federal funds, as all other states have been comparably treated.
California Can Nonetheless Make Strong Case for More IDEA Funding. Despite the shortcomings of the Governor’s particular approach, California—along with other states—can make a compelling argument to receive additional IDEA funding. Using the IDEA’s own method for approximating the excess cost of educating students with disabilities nationwide, the federal government has covered far less than 40 percent in recent years. Despite the federal government more than doubling its share of costs between 1995 and 2005, IDEA has never covered more than 19 percent of excess costs (see Figure 16). Moreover, IDEA appropriations, as well as the share of costs covered by the federal government, actually have dropped between 2004 and 2008, despite the IDEA funding schedule designed to accelerate augmentations. (Even with the one–time ARRA IDEA allocation in 2009, the 40 percent full–funding target was not reached.)
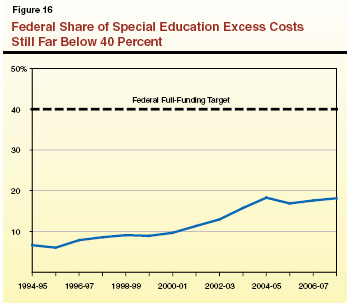
Recommend State Request Additional Ongoing IDEA Funding. We recommend California request the federal government fully fund its 40 percent–of–cost policy and permanently increase IDEA funding for all states. Accordingly, states and school districts should be allowed to reduce their share of costs. For California, this would mean freed up Proposition 98 resources. This approach has several advantages. First, asking the federal government to cover its full share of special education costs might appear more reasonable if the corresponding freed–up state and local funds were redirected for other education priorities rather than benefitting other parts of the state budget. Second, our approach would provide ongoing rather than one–time benefit to the state. Lastly, our approach does not require any special treatment for California.
The federal government currently provides several sources of funding for education data activities, including the Enhancing Education Through Technology (EETT) grant. In 2009–10, the state received $29 million in ongoing EETT funding, as well as a one–time ARRA grant of $72 million. At least 95 percent of the grant must be given out to school districts, of which at least half must be distributed on a competitive basis. The remaining 5 percent can be used for state–level activities.
Governor’s Initial Expenditure Plan Rejected, No New Proposal. In fall 2009, the Governor submitted a request pursuant to Section 28.00 of the 2009–10 Budget Act that contained an expenditure plan for the ARRA EETT monies. At that time, the Joint Legislative Budget Committee raised several concerns with the administration’s plan. Most importantly, the plan did not coordinate the use of the funds with other education data and technology efforts, especially in relation to developing a preschool through higher education (or “P–20”) data system. As a result, the plan lost an opportunity to maximize the potential benefit of the ARRA funds. Given these concerns, the Legislature did not concur with the Governor’s initial plan. The administration has not subsequently submitted a new plan. As a result, an expenditure plan still needs to be approved before the funds can be used to benefit local data efforts.
Recommend Developing Coordinated Plan Targeting Preschool and High School Data Needs. One of the greatest challenges associated with developing a P–20 data system will be collecting and integrating early childhood and postsecondary/workforce readiness data. The EETT monies could help districts meet these challenges. To this end, we recommend the Legislature designate that the $72 million in one–time EETT funding be used for two purposes. First, we recommend directing half of the EETT funds to school districts that provide early childhood education to help integrate pre–kindergarten data into the P–20 system. By helping districts collect, report, and analyze early education data, the funds would facilitate ongoing instructional improvement for California’s youngest students. Second, we recommend awarding the other half of EETT funds to districts serving high school students, with the funds used to help meet new postsecondary and workforce readiness data requirements. Under other related federal grant applications, California is proposing to collect new high school–level data, including Advanced Placement and Scholastic Aptitude Test scores, as well as participation in courses relating to science, technology, engineering, and math. Under our recommended approach, districts serving preschool or high school students would apply to the CDE and be awarded funding competitively based on their data needs.
Currently, California operates both federally funded and state–funded programs to improve low–performing schools. Using federal funds, Program Improvement (PI), created by the No Child Left Behind Act of 2001, provides support for schools that have missed benchmarks on state math and Language Arts assessments for two or more years. In 2009–10, California received roughly $130 million in ongoing School Improvement Funds (SIF), as well as close to $400 million in one–time ARRA funds, for PI schools. (Roughly half of SIF funds come from a Title I set aside, with the other half from the School Improvement Grant.) Using state funds, California operates the QEIA program. This program provides support for schools ranked in the bottom two deciles on state assessments. The state annually provides $402 million for the program, with the bulk of funding supporting efforts to reduce class sizes in grades 4 through 12. Funding for QEIA is provided as part of a settlement the administration reached with the California Teachers Association regarding the Proposition 98 suspension that occurred in 2004–05.
Federal Government Creates New Requirements for PI. The U.S. Department of Education recently enacted new regulations governing PI. Although PI has relatively specific program requirements, it previously contained few explicit funding requirements. By contrast, the new regulations direct states to use resources to turn around the bottom 5 percent of schools in PI (frequently referred to as the “persistently lowest–achieving schools”). These schools must implement one of four intensive intervention strategies (see Figure 17). Additionally, the federal government now intends to make school improvement funds available for a longer period with the express purpose of allowing districts to implement three–year improvement plans. In response to these new requirements, the state recently enacted Chapter 2, Statutes of 2010 (SBX5 1, Steinberg), which establishes specific rules for identifying the persistently lowest–achieving schools in California.
Figure 17
New Regulations for Federal School Improvement Program
|
|
|
Priority for Intervention
|
- First priority is for schools receiving Title I funds that either are in the bottom 5 percent of Program Improvement schools, as measured by standardized test scores in math and Language Arts, or are high schools with a graduation rate below 60 percent for several consecutive years.
|
- Second priority is for high schools that would have been in the bottom 5 percent but do not receive Title I funds.
|
- Third priority is for additional schools receiving Title I funds that the state identifies at its discretion.
|
|
Intervention Modelsa
|
|
|
- Convert the school into a charter school.
|
- Release at least 50 percent of instructional staff and provide certain flexibility related to staffing and instructional time.
|
- Give schools considerable flexibility, including control over personnel decisions, budgeting, and length of the school day/year.
|
|
Funding Rules
|
- Schools in the bottom 5 percent and with low graduation rates can receive up to $2 million per year for three years.
|
- Districts can pool their total allotment and redistribute among identified schools such that some top–priority schools receive even more.
|
- Provide funding to schools for three years rather than one year.
|
Governor’s Budget Funds QEIA but Does Not Include Plan for Federal School Improvement Funding. The Governor’s budget continues to provide $402 million for K–12 schools participating in QEIA. Unlike 2009–10, when QEIA was supported with Proposition 98 funding on a one–time basis, the Governor’s 2010–11 proposal funds QEIA with non–Proposition 98 General Fund monies. The Governor’s budget contains no plan for spending $650 million in SIF.
Governor’s Budget Misses Opportunity to Build Coherent Plan for Using Available School Improvement Resources. The Governor’s proposal for low–performing schools has three major shortcomings. First, as noted above, the administration does not offer a budget for the $650 million in federal SIF available to California. Second, despite the significant amount of federal funding available to intervene in low–performing schools, the Governor still chooses to spend more than $400 million in scarce state funds for generally the same purpose. Finally, the administration takes no direct action to coordinate federal and state school improvement efforts.
Recommend Developing SIF Budget, Aligning State and Federal Programs. We recommend creating a SIF budget plan that ensures all the funds are used during the allotted period while maximizing potential programmatic benefits and minimizing overlap among school improvement efforts. To this end, we: (1) develop a method for determining which schools would receive funding, (2) develop an allocation method for distributing SIF funds to all identified schools based on their relative need, and (3) use that allocation method to build a three–year SIF budget. In addition to building a strategic, multiyear plan that complies with federal guidance, our model identifies areas of overlap between the SIF and QEIA programs, and, to the degree possible, consolidates state and federal school improvement programs such that districts are only beholden to one set of intervention requirements.
Recommend Determining Which Additional Schools Will Receive Federal Funds as First Step in Developing Budget Plan. Whereas the federal government is prescriptive in how funds are to be spent on the persistently lowest–achieving schools, new regulations provide significant freedom to states in deciding which additional PI schools receive funding. As shown in Figure 18, our recommended approach would be to identify additional PI schools using essentially an extension of the method used to identify the persistently lowest–achieving schools. Specifically, we recommend expanding schools receiving funding from the persistently lowest achieving (defined as the bottom 5 percent of the 2,797 schools in PI) to roughly the bottom one–third of schools in PI, which is equivalent to roughly 10 percent of all schools statewide. We would, however, recommend excluding schools that were making progress and did not appear to be in need of intervention. That is, a school would be excluded if at least half its students were proficient or if it had made a gain of at least 100 points on the Academic Performance Index (API) over the last five years. (We would also recommend giving QEIA schools meeting the eligibility criteria priority for funding, as discussed later in this piece.) This overall approach is transparent and rational—allowing districts to have a clear sense of which schools would be eligible for funding.
Figure 18
Schools Identified Under LAO–Recommended School Improvement Program
|
Identification Process
|
Schools
|
|
Persistently Lowest–Achieving Schools
|
|
|
1. Identify the bottom 5 percent of schools in federal Program Improvement (PI) based on average proficiency rates on state math and Language Arts tests combined. Exclude schools that have made more than 50 points of Academic Performance Index (API) growth over the last five years.a
|
177
|
|
2. Add secondary schools that have had a graduation rate of 60 percent or lower for the past three years.b
|
27
|
|
3. Add all high schools eligible for but not receiving Title I funds that otherwise would have been identified in step one.
|
10
|
|
Additional Low–Achieving Schools
|
|
|
Identify the bottom third of schools in PI using largely the same process as described under (1) above. Exclude schools that have more than 50 percent of their students scoring proficient and have made more than 100 points of API growth over the last five years. The Quality Education Investment Act schools meeting these criteria would have priority for funding.a
|
776
|
|
Total
|
990
|
|
Percent of Statewide Total
|
10%
|
Recommend Linking Funding With Need. We recommend allocating SIF funds to schools in a way that matches funding to the needs of the school. Under our proposed allocation method, most funding would be based on school–wide enrollment, with the persistently lowest–achieving schools receiving a higher per–pupil rate than the other identified schools. Linking most funding with enrollment would ensure larger schools receive more for student and teacher support. Our allocation method, however, also would have minimum and maximum school allocations in recognition that some fixed costs as well as some economies of scale exist. Specifically, we recommend giving the persistently lowest–achieving schools $900 per pupil, with total allocations ranging from a minimum of $250,000 to a maximum of $2 million per school. Other identified schools that are not among the persistently lowest–achieving (those in the bottom one–third of PI schools not already identified) would receive $300 per pupil, with a minimum of $50,000 and a maximum of $500,000 per school. These schools generally would receive less in school improvement funding than the persistently lowest–achieving schools, as they would not have to implement an intensive intervention strategy. Instead, these schools could use more targeted improvement strategies consistent with federal PI and Race to the Top guidance.
LAO–Recommended Budget Maximizes Effective Use of Federal Funding. We recommend building a three–year SIF budget using our expanded list of schools and accompanying allocation model. As shown in Figure 19, our budget maximizes federal support for the state’s low–performing schools while adhering to the federal government’s three–year budget cycle. (Our budget leaves a $31 million cushion that could be used to fund some additional very high–need schools that enter PI after 2010–11. Our budget also continues to provide $10 million annually for regional technical assistance and intervention, mainly to ensure some funding remains budgeted for regional support.) By the end of the three–year period, new federal rules are expected. At that time, the state could reassess its efforts in this area and develop a more refined program based on the new federal rules as well as the lessons learned over the prior three years.
Figure 19
LAO–Recommended Budget for Federal School Improvement Program
(In Millions)
|
|
2010–11
|
2011–12
|
2012–13
|
|
Ongoing Funding
|
|
|
|
|
School Improvement Grants (SIG)
|
$68
|
$68
|
$68
|
|
Title I set aside
|
65
|
65
|
65
|
|
One–Time Funding
|
|
|
|
|
American Recovery and Reinvestment Act (ARRA) SIG
|
$352
|
—
|
—
|
|
ARRA Title I set aside
|
45
|
—
|
—
|
|
Carryover
|
119
|
$355
|
$193
|
|
Totals
|
$650
|
$488
|
$326
|
|
Expenditures
|
|
|
|
|
Intervention: persistently lowest–achieving schoolsa
|
$126
|
$126
|
$126
|
|
Intervention: additional low–achieving schoolsb
|
159
|
159
|
159
|
|
Regional technical assistance/intervention
|
10
|
10
|
10
|
|
Totals
|
$295
|
$295
|
$295
|
|
Balances
|
$355
|
$193
|
$31
|
Recommend Holding QEIA Districts Harmless. The PI and QEIA programs overlap considerably. For instance, under our model, more than 65 percent of QEIA schools would be eligible for federal funding. As shown in Figure 20, more than half of the annual cost of QEIA could be covered with federal funds. Moreover, all QEIA districts would be held harmless under our approach. If a QEIA school is identified for the federal program, then it would receive federal dollars instead of state dollars and only be subject to federal requirements. A QEIA school not funded under our SIF budget, or currently receiving more in QEIA funds than allowed under the maximum SIF allotment, would continue to receive state funds, but could use those resources to conduct a school improvement activity approved under the federal PI program. Districts also would be free to redistribute state dollars among schools in the district in accordance with the local SIF plan, allowing districts to provide more funding to QEIA schools if they so chose.
Figure 20
Quality Education Investment Act (QEIA) Savings From LAO Recommendation
(In Millions)
|
|
Governor
|
LAO
|
|
QEIA Funding (2010–11)
|
|
|
|
State General Fund
|
$402
|
$171
|
|
Federal funds
|
—
|
202
|
|
Totalsa
|
$402
|
$373
|
|
State General Fund Savings
|
|
|
|
2010–11
|
—
|
$231
|
|
Cumulative savings through 2012–13
|
—
|
693
|
Recommend Streamlining Intervention Programs. Regardless of a district’s particular combination of federal and state funding, it would no longer have to juggle multiple intervention programs under our approach. Essentially, federal PI would become the only operative intervention program. Consistent with the expiration of existing federal school improvement funding, the state could sunset the QEIA program at the end of 2012–13. In essence, beginning in 2013–14, the state would have a clean slate and could start a new round of school improvement efforts, if it desired. (To further streamline the overall intervention system, we recommend the Legislature also discontinue the state’s existing PI program. Please see box below for more detail.)
Remaining Settlement Obligation Could Be Used to Reduce K–14 Mandate Backlog. Based on our recommended budget plan, the state would enter 2013–14 with a remaining settlement obligation of roughly $1 billion. The Legislature could schedule out the $1 billion and designate that the payments be used to reduce the K–14 mandate backlog, which now totals $3.6 billion.
|
In response to the passage of the No Child Left Behind Act of 2001 and its requirements related to Program Improvement (PI), California enacted Chapter 757, Statutes of 2008 (AB 519, Committee on Budget), which created a plan for allocating federal funds to districts in PI. Specifically, the legislation provided grants to school districts entering their third year of PI to support certain corrective actions, with funds allotted based on the severity and pervasiveness of each district’s achievement problems. Given the new federal PI regulations, we recommend the Legislature discontinue the Chapter 757 program. The new PI regulations also focus interventions at the district level based on relative need. Moreover, discontinuing the Chapter 757 program would reduce unnecessary overlap among programs—helping to streamline school improvement efforts.
|
Return to LAO 2010-11 Budget: Proposition 98 and K-12 Education Table of Contents
Return to LAO 2010-11 Budget: Full Table of Contents