The current index used to calculate cost–of–living adjustments (COLAs) for K–12 programs—the state and local government price deflator—is not a particularly good indicator of increases in school costs. In response, the Governor proposes to switch the COLA index to a modified version of the California Consumer Price Index for Wage Earners and Clerical Workers. Because his proposed index focuses on cost increases experienced by employees rather than those of employers, we recommend the Legislature reject the administration’s proposal. Instead, we recommend the Legislature modify the current K–12 COLA index to focus on projected compensation cost increases. Because neither the Governor's proposal nor our suggested alternative is likely to have an immediate effect in the budget year, we believe 2008‑09 is the ideal time to make this switch.
Each year, the budget provides most Proposition 98 programs with a cost–of–living adjustment (COLA), or an increase in funding to reflect the higher costs schools and community colleges experience due to inflation. For K–12 education, some programs (including revenue limits, or general purpose funds) are statutorily required to receive this adjustment, whereas others receive the adjustment at the Legislature’s discretion. Although there is no statutorily required COLA for community colleges, the budget typically adjusts their apportionments (general purpose monies) and about one–quarter of their categorical programs based on the K–12 COLA rate. School districts and community colleges generally use a portion of this new funding to provide annual increases to employee salaries through “step and column” salary schedules and raises. Depending on local collective bargaining agreements, the rate of the employee adjustment may be more or less than the COLA rate the state is providing. In addition to salary adjustments, COLA funding also goes to address cost increases for local operating expenses including employee benefits, utilities, materials, and supplies.
Both the administration and our office have concerns with the existing index used to calculate the K–12 COLA. Namely, it is heavily influenced by cost increases in areas that do not significantly affect schools and community colleges. Below, we describe problems with the existing K–12 COLA index, discuss our concerns with the Governor's proposed change, and offer an alternative we believe would better measure schools’ primary inflationary pressures. Finally, we compare rates and costs of the existing index with the two proposed alternatives from 2003–04 through 2008‑09 (projected). Because a COLA might not be provided to K–14 education in the budget year, we believe 2008‑09 is the ideal time to change the COLA formula, as it would have no fiscal effect on districts.
Under current law, the K–12 COLA rate is based on the gross domestic product price deflator for purchases of goods and services by state and local governments (GDPSL). This index, calculated by the federal government, is designed to reflect changes in costs experienced by state and local governments around the country. (Local governments include cities, counties, schools, and special districts such as fire districts.) To reflect the multiple categories in which state and local governments spend money, the GDPSL has several components. Figure 1 displays the primary components of the GDPSL and the types of costs they include.
|
|
|
Figure 1
Primary Cost
Components of the
State and Local Price Deflator |
|
|
|
♦
Employee Compensation. Includes
salaries and benefits for government employees. |
|
♦
Services. Includes utilities and
contracted services (such as financial, professional, and
business services). |
|
♦
Structures/Gross Investment.
Includes capital outlay, construction, and deferred maintenance. |
|
♦
Nondurable Goods. Includes
gasoline, office supplies, and food. |
|
♦
Durable Goods. Includes books,
tools, and equipment. |
|
|
Two GDPSL Components Have Been Growing Rapidly in Recent Years. Figure 2 compares the K–12 COLA rate with the growth rates for the primary inputs to the GDPSL over the most recent five–year period. The figure shows that costs for structures and nondurable goods have experienced rapid growth rates in recent years. Several national and international factors have contributed to these cost increases, including the hurricanes of 2005, instability in the Persian Gulf, and growing demand for steel on the international market. The recent increases in these two categories have contributed to a higher overall GDPSL and K–12 COLA.
|
|
|
Figure 2
The K-12 Cost-of-Living Adjustment (COLA) and
Its
Underlying Components |
|
Annual Growth Rates |
|
|
2004‑05 |
2005‑06 |
2006‑07 |
2007‑08 |
2008‑09a Estimate |
|
K-12 COLA |
2.4% |
4.2% |
5.9% |
4.5% |
5.4% |
|
Underlying Components |
|
|
|
|
|
|
Employee compensation |
3.3% |
3.0% |
3.9% |
4.1% |
4.3% |
|
Services |
2.6 |
3.7 |
5.4 |
3.8 |
4.2 |
|
Structures |
2.5 |
6.6 |
7.7 |
6.5 |
5.9 |
|
Nondurable goods |
4.4 |
11.8 |
14.0 |
6.0 |
9.9 |
|
|
|
a Based on LAO
projections. The Governor's budget projected a K-12 COLA of
4.9 percent for 2008‑09, but recently released fourth quarter
2007 data indicate the annual COLA rate likely will be higher. |
|
|
Current COLA Index Not Reflective of Typical School Expenses...The cost factors that school districts and community colleges actually face are somewhat different from those reflected in the GDPSL. Although the GDPSL measures the costs of state and local government agencies, schools and colleges typically have different expenditure patterns than many other government entities. Figure 3 compares the expenditure patterns of a typical California school to the relative component “weights” of the GDPSL. (Expenditure patterns for community colleges are comparable to those of K–12 schools.) The figure shows a typical school spends about 85 percent of its annual General Fund budget on employee salaries and benefits. In contrast, employee compensation makes up only around 56 percent of the GDPSL. Conversely, the overall GDPSL is significantly more affected by cost increases in energy and construction than are typical K–14 General Fund budgets. (K–14 construction expenditures are typically supported by bond funds and developer fees rather than Proposition 98 and have an alternative COLA mechanism.)
|
|
|
Figure 3
Current
COLA Not Reflective of Typical School Expenses |
|
|
Share of Average School Expenditures |
"Weight" in K-12 COLA Calculation |
|
Employee compensation |
83% |
56% |
|
Services and nondurable goods |
14 |
35 |
|
Structures and durable goods |
3 |
17 |
|
Incomea |
— |
-8 |
|
Totals |
100% |
100% |
|
|
|
a Some government
agencies receive income from activities such as charging tuition
or fees. This
income offsets costs in other areas. |
|
|
...So Current COLA Does Not Reflect Schools’ Actual Costs of Inflation. Because the make–up of the GDPSL differs from the makeup of typical school expenditures, in some years the GDPSL may overstate and in others underestimate actual school costs. For example, as shown in Figure 2, in 2004–05, inflation for the employee compensation component of the GDPSL was 3.3 percent, but the K–12 COLA rate was 2.4 percent. Because compensation costs are schools’ and community colleges’ primary expenditure, in 2004–05 they likely had to absorb compensation increases without corresponding COLA funding from the state. In contrast, the overall K–12 COLA rate has been driven upward in recent years by inflation in gasoline and construction costs, causing it to be significantly higher than growth in the employee compensation component. For example, in 2006–07, general government employee compensation costs increased by 3.9 percent, while the K–12 COLA provided to schools and community colleges was 5.9 percent. This indicates using the GDPSL as the COLA for Proposition 98 programs likely has overcompensated schools for the costs they faced in recent years.
In an effort to better align the COLA with the cost pressures schools actually face, the Governor proposes to change the index used to calculate the K–12 COLA from the GDPSL to a modified version of the California Consumer Price Index for Wage Earners and Clerical Workers (CA CPI–W). The proposed change would take effect beginning in the budget year. As of early January, the Governor estimated this change would lower the 2008‑09 K–12 COLA from 4.94 percent to 3.65 percent. Based on updated economic data, the proposed change would lower the rate from 5.43 percent (GDPSL) to 4.40 percent (CA CPI–W).
The CPI Measures Changes in Consumer Prices. The United States Consumer Price Index (CPI) measures changes in the prices consumers in urban areas pay for a fixed “market basket” of goods and services. This market basket is constructed based on surveys of consumer expenditure patterns. Figure 4 displays the broad consumer purchase categories included in the CPI price calculation, with each category covering many items. The CPI–W is a subset of the CPI based on the spending patterns of urban consumers who work in clerical or wage occupations. While wage earners’ spending patterns tend to differ slightly from those of the larger urban population, the items included in the market basket for the CPI–W are the same as displayed in Figure 4.
|
|
|
Figure 4
Categories of Goods and Services
Included in the
Consumer Price Index |
|
|
|
|
♦ |
Food and beverages |
|
♦ |
Housing |
|
♦ |
Apparel |
|
♦ |
Transportation |
|
♦ |
Medical care |
|
♦ |
Recreation |
|
♦ |
Education and communication |
|
|
Administration’s Proposal Based on CA CPI–W. Although the CPI–W is a national index, it is built up from metropolitan–area information throughout the country. As a result, the federal government also produces data reflecting consumer prices in California’s two largest urban areas—Los Angeles and San Francisco. State economists use data from the two regions to calculate a state–specific urban price index, known as the CA CPI–W. Many of the state’s county public health departments use this index to calculate annual COLAs for their employee salaries. The Governor's proposed change for the K–12 COLA would use an unweighted version of the CA CPI–W.
Administration Believes CA CPI–W Better Measure of School Costs. Because employee salaries are the largest expenditure category for both K–12 school districts and community colleges, the administration suggests employees’ inflationary pressures (that is, increases in their own costs of living) are what drive most of schools’ inflationary pressures. Therefore, according to the administration, a measure reflecting employees’ consumer costs is a more appropriate COLA than the GDPSL.
Proposed Index Does Not Reflect Employer Cost Pressures. Because the CA CPI–W focuses exclusively on consumer costs, it may be influenced by cost increases that have no bearing on schools’ operational expenses. For example, housing costs make up around 43 percent of the CPI–W market basket. As such, an upsurge in housing and rental prices would have a large effect on the CA CPI–W. In contrast, this market trend would have little direct effect on school costs. Moreover, the CA CPI–W does not include certain employer–driven costs schools might incur. For example, the CA CPI–W does not account for the rising costs of providing employee benefits, which make up one–fifth of the average school’s budget. Employee benefits include both health care and retirement.
Because the state is providing K–12 COLA funding to schools and colleges—the employers—and not directly to the employees, we believe the GDPSL is a more appropriate inflationary measure than the administration’s proposal. However, the overall GDPSL index does not accurately reflect cost increases schools actually face. Therefore, we recommend the Legislature change statute to modify the way the K–12 COLA is calculated. Specifically, instead of using the total GDPSL, we recommend using just the employee compensation component of the index. This would account for inflationary changes in employer costs for both salaries and benefits.
Employee Compensation Component Most Reflective of School Costs. Using all of the various GDPSL components to reconstruct a new K–14 inflationary index would be complicated and likely still inaccurate. For this reason, focusing on the largest cost category seems to make the most sense. Because employee compensation (salaries and benefits) make up 85 percent of total school expenditures, inflation in this area is their primary cost pressure. Changing the K–12 COLA to be based on this factor would better track with the inflationary pressures schools and colleges experience. This approach also results in greater simplicity and transparency, making it easier for all parties to understand.
Other Costs Make Up Relatively Small Share of School Budgets. Depending on inflationary trends in other school cost categories (such as utilities and supplies), focusing on employee compensation will slightly over–compensate schools in some years and under–compensate in other years. However, no existing index or inflationary component perfectly compensates schools for their actual cost increases.
National Index Provides More Independent Reflection of Cost Increases. Although one might argue that a California–specific employee compensation index would be a better inflationary measure than one based on national trends, no such measure exists. (As discussed, the CA CPI–W, while California specific, does not measure employer costs.) Moreover, annual salary increases for school and college employees are generally established through local collective bargaining agreements, so basing the K–12 COLA on employee compensation trends only in California could conceivably create a scenario where local bargainers are able to influence the state COLA rate. Under this scenario, each time local unions negotiated a higher local COLA, it would increase statewide employee compensation rates, which in turn would increase the statewide COLA. As a result, the state would end up “chasing its tail,” with local efforts driving the statewide COLA ever higher. By using an index of employee compensation trends across the country, compensation changes in California schools and colleges would have a limited influence on the overall COLA factor.
Maintain Methodology and Timing of Current Index. Although we recommend a change in how the current index is used, we would suggest maintaining the same timing used to calculate the current K–12 COLA. That is, for 2008‑09 the COLA would be based on GDPSL data from the final three quarters of 2007 and the first quarter of 2008, compared to data from the previous four quarters. This methodology allows the state to base the K–12 COLA on the most recent data available while still being able to “lock in” a rate in time for the May Revision and final budget planning.
Figure 5 displays actual growth rates for the GDPSL, the CA CPI–W, and the employee compensation component of the GDPSL from 2003–04 to 2007–08, as well the projected growth rates for 2008‑09. As shown, no one index is consistently higher than the others. Growth in the GDPSL was lower in the first part of the decade, then spiked in recent years due to rising gasoline and construction costs. Gasoline and construction costs had less of an effect on the CA CPI–W and no effect on the compensation component of the GDPSL. As a result, the growth rates for these indices have been lower in recent years. However, looking back at the GDPSL and its components over the past 20 years, the employee compensation component has grown more quickly than the overall index 75 percent of the time.
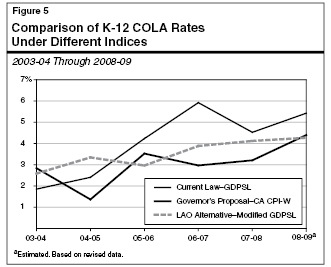
Costs of Existing COLA Rate Higher Than Alternatives in Recent Years. Over the past four years (2004–05 through 2007–08), the state paid approximately $8.3 billion to fund COLAs for K–14 education. Had the K–12 COLA been calculated over the same time period using either the Governor's proposed index or our alternative, the costs would have been less—$5.4 billion or $6.9 billion, respectively. This is because, as illustrated in Figure 5, the existing COLA rate has been notably higher than the two proposed alternatives in recent years.
Existing COLA Rate Expected to Be High Again in 2008‑09. As shown in Figure 6, we project the GDPSL will continue to be higher than the two alternatives in 2008‑09. The figure shows that providing COLAs at the current statutory rate of 5.4 percent to the K–14 programs that typically get them would cost the state approximately $3 billion in 2008‑09. In contrast, estimates are lower for both the Governor's proposed index and our alternative—4.4 percent (revised) and 4.3 percent, respectively—each resulting in a cost of around $2.4 billion.
|
|
|
Figure 6
Comparing 2008‑09 COLA Costs Under Each Option |
|
(Dollars in Millions) |
|
|
Current
Law |
Governor's Proposal |
LAO
Alternative |
|
COLA Ratea |
5.43% |
4.40% |
4.27% |
|
COLA Costs: |
|
|
|
|
K-12 revenue limitsb |
$1,943 |
$1,574 |
$1,528 |
|
K-12 categoricalsc |
729 |
591 |
573 |
|
Community collegesd |
341 |
276 |
268 |
|
Totals |
$3,013 |
$2,441 |
$2,369 |
|
|
|
a Based on updated
data. The Governor's budget estimated a current law K-12 COLA
rate of 4.94
percent and CA CPI-W rate of 3.65 percent. |
|
b Includes revenue
limits for both K-12 districts and county offices of education. |
|
c Cost for K-12
programs that typically receive an annual COLA. |
|
d Includes
apportionments and categoricals that typically receive a COLA. |
|
|
Because COLA Rate Likely Will Not Matter in 2008‑09, the Time Is Right to Make a Change. Neither the Governor's proposal to base the K–12 COLA on the CA CPI–W nor our alternative is likely to have an immediate effect in the budget year. This is because K–14 education programs may not receive a COLA in 2008‑09. (Neither the Governor's proposed budget nor the LAO alternative include COLAs.) As a result, the budget year seems the ideal time to switch to a better measure. The Legislature has the opportunity to consider the merits of the different proposals without being overly concerned about fiscal “winners and losers” in the budget year. (Depending on whether the Legislature chooses to create a deficit factor for foregone COLAs, making the change in 2008‑09 could have a fiscal effect on future K–12 revenue limits, as described in the
nearby box.)
While the Governor's budget proposal does not include COLAs for K–14 education programs, the administration does propose to create a “deficit factor” for K–12 revenue limits. In the past when the budget provided less than a full COLA for revenue limits, the state kept track of the difference and after a number of years restored K–12 revenue limits to where they otherwise would have been absent the reduction. (The deficit factor is discussed in
“Introduction: K–12 Education,” a subsequent section of this chapter.) The Legislature, however, is under no obligation to create a deficit factor. If the Legislature does opt to create a deficit factor for foregone COLAs in 2008‑09, switching the COLA factor would have an out–year fiscal effect. Figure 6 shows the calculated revenue limit COLA under each of the three proposals. Because it is a higher rate, maintaining the current statutory COLA would have a greater out–year fiscal effect ($1.9 billion), compared to both the Governor's and our proposed changes ($1.6 billion and $1.5 billion, respectively).
No existing index provides a truly accurate measure of the inflationary costs experienced by California K–12 schools and community colleges. Among the few reasonable options that exist, we believe the employee compensation component of the GDPSL provides the Legislature the best option for estimating schools’ and community colleges’ actual cost increases. This alternative is simple and transparent and reflects the vast majority of typical school expenditures. Because changing the COLA factor likely will not have an effect on school funding in 2008‑09, we believe the time is right for the Legislature to take action to more closely align the K–12 COLA rate with the costs schools and community colleges actually face.
Return to Education Table of Contents, 2008-09 Budget AnalysisReturn to Full Table of Contents, 2008-09 Budget Analysis