Under the administration’s proposal, total K–12 education funding from all sources would decline by $2.2 billion, or 3.1 percent, compared to 2007–08. Changes in Proposition 98 funding account for about one–half of this decrease. The budget proposes to decrease K–12 Proposition 98 funding by $1.1 billion, or 2.2 percent, from the revised 2007–08 level. The Proposition 98 budget proposal would reduce funding for all K–12 programs compared to current–year levels, although the size of the reduction would vary by program. Figure 1 displays all significant funding sources for K–12 education for 2006–07 through 2008‑09. As the figure shows, Proposition 98 funding constitutes over 70 percent of overall K–12 funding. The Governor's Proposition 98 funding level for K–12 education in 2008‑09 is $1.1 billion, or 2.2 percent, less than the 2007–08 level. An even greater decline in General Fund support (–$2 billion) is partially offset by a year–to–year increase in local property tax revenue ($0.9 billion). Other funding for K–12 education declines by roughly $1.1 billion, or 5.3 percent, from the 2007–08 level. The figure also shows Proposition 98 funding per average daily attendance(ADA) would decline year over year by $145. Under the Governor's proposal for 2008‑09, Proposition 98 per pupil funding would be $8,368. This is discussed in more detail in the
“Per Pupil Funding” section of this chapter.
Teachers’ Retirement Costs (Decrease of $424 Million). The Governor's budget includes $1.1 billion in 2008‑09 for the state’s annual K–12 contributions to the California State Teachers’ Retirement System (CalSTRS)—down $424 million from the state’s contributions in 2007–08. Year–to–year comparisons are complicated because the 2007–08 amount is inflated by a $500 million payment resulting from the state losing a court case involving a one–time reduction of payments to CalSTRS four years ago. The 2008‑09 amount also contains an $80 million payment to comply with other court–ordered obligations. This is offset by an $80 million reduction related to the administration’s proposal for the state to guarantee—for the first time—one category of CalSTRS benefits in exchange for a reduction in the state’s payments to the program. Absent all these factors, state contributions are projected to rise about 7 percent between 2007–08 and 2008‑09 due to rising teacher payroll. Please see the
“CalSTRS” section of this chapter for more discussion of these issues.
|
|
|
Figure 1
K-12 Education Budget Summary |
|
(Dollars in Millions) |
|
|
Actual 2006‑07 |
Revised 2007‑08a |
Proposed 2008‑09 |
Changes From 2007‑08 |
|
Amount |
Percent |
|
K-12 Proposition 98 |
|
|
|
|
|
|
State General Fund |
$37,264 |
$37,473 |
$35,460 |
-$2,013 |
-5.4% |
|
Local property tax revenue |
11,753 |
12,949 |
13,850 |
901 |
7.0 |
|
Subtotals |
($49,017) |
($50,423) |
($49,310) |
(-$1,112) |
(-2.2%) |
|
Other Funds |
|
|
|
|
|
|
General Fund |
|
|
|
|
|
|
Teacher retirement |
$876 |
$1,535 |
$1,111 |
-$424 |
-27.6% |
|
Bond payments |
1,764 |
2,084 |
2,381 |
297 |
14.3 |
|
Other programs |
440 |
1,221 |
985 |
-236 |
-19.3 |
|
State lottery funds |
979 |
936 |
936 |
— |
— |
|
Federal funds |
6,832 |
6,698 |
6,316 |
-382 |
-5.7 |
|
Other |
7,226 |
7,791 |
7,467 |
-324 |
-4.2 |
|
Subtotals |
($18,117) |
($20,264) |
($19,197) |
(-$1,068) |
(-5.3%) |
|
Totals |
$67,134 |
$70,687 |
$68,507 |
-$2,180 |
-3.1% |
|
K-12 Proposition 98 |
|
|
|
|
|
|
Average daily attendance (ADA) |
5,951,933 |
5,922,913 |
5,892,449 |
-30,464 |
-0.5% |
|
Budget amount per ADA |
$8,235 |
$8,513 |
$8,368 |
-$145 |
-1.7% |
|
|
|
a Reflects
Governor’s proposal for 2007‑08. |
|
Totals
may not add due to rounding. |
|
|
Repaying Bonds for School Facilities (Increase of $297 Million). The bulk of this increase in debt service is due to recent investments the state has made in school facilities through Proposition 47 (2002) and Proposition 55 (2004). These measures authorized the state to sell a total of $21.4 billion in bonds for school facilities. Proposition 1D, approved by the voters in November 2006, authorized an additional $7.3 billion for school facilities. (Not reflected in Figure 1, and distinct from debt–service payments on already sold bonds, is the Governor's proposed $4.4 billion in expenditures from yet unused prior–year bond monies as well as new bond monies available from Proposition 1D. This is discussed in more detail in the
“School Facilities”
section of this chapter.)
Other Programs (Decrease of $236 Million). The figure shows a $236 million decrease in funding for other programs supported by the General Fund. This is the net result of both decreases and increases in one–time spending compared to 2007–08—roughly $500 million less from the Proposition 98 reversion account, offset by an additional $134 million for the Quality Education Investment Act and $125 million in spending for mandates to meet prior–year Proposition 98 “settle–up” obligations. This category also includes the Governor's proposed across–the–board reductions to non–Proposition 98 K–12 state programs, including administrative activities at the California Department of Education and State Special Schools.
Federal Funding (Decrease of $382 Million). Because the Governor's budget was prepared before final information was available from the federal government, the federal funding totals in Figure 1 will be updated in the coming weeks. Based on the information available at the time, the Governor's budget assumed a year–to–year decrease in federal funding of $382 million. The bulk of this change ($278 million) is an anticipated loss in federal funding resulting from the Governor's proposal to reduce state support for special education in 2008‑09. This action would put the state out of compliance with a federal maintenance of effort requirement. This is discussed in more detail in the
“Special Education”
section of this chapter.
The Governor's budget package makes reductions to K–12 Proposition 98 spending in both the current and budget years. Figure 2
shows the Governor's proposal to reduce K–12 spending in 2007–08 by $360 million compared to what the budget act provided, for total K–12 spending of $50.4 billion. Also shown in the figure, the Governor's proposed Proposition 98 spending level for K–12 education in 2008‑09 is $49.3 billion—a reduction of more than $1.1 billion from the revised current–year level. Figure 2 summarizes the approach the administration used to build the K–12 budget for 2008‑09.
|
|
|
Figure 2
K-12 Proposition 98 Budget Proposal |
|
(In Millions) |
|
2007‑08 Budget Act |
$50,796.7 |
|
Reduction to revenue limits |
-$360.0 |
|
Technical
adjustments |
-14.0 |
|
2007‑08 Revised |
$50,422.6 |
|
"Workload Budget"
Adjustments |
|
|
Cost-of-living adjustment
(4.94 percent) |
$2,428.1 |
|
Restore funding for ongoing programs |
566.6a |
|
Restore 2007‑08 reduction to revenue
limit base |
360.0 |
|
Make charter school facilities grant
ongoing |
18.0 |
|
Decline in average daily attendance |
-121.0 |
|
High Priority Schools program
adjustment |
-29.0b |
|
Other |
0.9 |
|
Subtotal |
($3,223.6) |
|
Governor's
"Workload" Estimate for 2008‑09 |
$53,646.2 |
|
Governor's "Budget
Balancing Reductions" |
|
|
Revenue limits |
-$2,607.9 |
|
Categorical programs |
-1,727.9 |
|
Subtotal |
(-$4,335.8) |
|
2008‑09 Proposal |
$49,310.4 |
|
|
|
a Portions of
the deferred maintenance, Home-to-School Transportation, and
High Priority Schools Grant programs were funded using
one-time funds in 2007‑08. |
|
b Funding for
the program is reduced due to schools exiting the program. |
|
|
Governor's Workload Budget Adds $3.2 Billion. In constructing his 2008‑09 budget for K–12 education, the Governor first built a hypothetical workload budget, providing adjustments to existing K–12 programs totaling $3.2 billion. Most of this increase ($2.4 billion) is for an estimated 4.9 percent cost–of–living adjustment (COLA) for revenue limits and categorical programs. Almost $1 billion more results from making existing programs “whole” by restoring the $360 million reduction to revenue limits and $566 million in ongoing costs funded with one–time monies in the current year. The workload budget also includes $18 million in ongoing funds for charter school facilities, a program previously funded using one–time funds. These increases are offset by about $120 million in projected savings from a 0.5 percent decline in statewide ADA and $29 million from schools exiting the High Priority Schools Grant Program.
Budget Balancing Reductions Total $4.3 Billion. From his workload budget level of $53.6 billion, the Governor makes a 10.9 percent across–the–board reduction to General Fund spending for each K–12 program. These reductions lower the workload budget by $4.3 billion—$2.6 billion from school district and county office of education (COE) revenue limits and $1.7 billion from categorical programs—resulting in the Governor's final K–12 Proposition 98 spending proposal of $49.3 billion.
Proposal Would Rebuild Revenue Limit Funding Levels in the Future. Consistent with past practice, the administration proposes trailer bill language that would eventually build the proposed reduction for K–12 district and COE revenue limits back into the revenue limit/funding base. This approach creates a new out–year obligation. Specifically, the proposed language creates a “deficit factor” that reduces revenue limits from the administration‘s workload budget—by 7 percent, or $2.6 billion, for K–12 districts, and 4.5 percent, or $33 million, for COEs. While schools would receive less than what statute calls for in 2008‑09, the revenue limit funding base would be restored in future years. (The administration’s proposal to change the K–12 COLA index would result in a smaller amount being restored in the future. See the
“COLA”
section of this chapter for more discussion of this proposal.) In contrast to the revenue limit deficit factor, the administration does not propose language to rebuild funding for reductions applied to K–12 categorical programs.
While the Governor measures reductions from his workload budget, a comparison of year–to–year funding levels shows the actual reductions schools would experience. Figure 3 shows proposed Proposition 98 spending for major K–12 programs in 2007–08 and 2008‑09. As shown in the figure, most large programs would be reduced between 6 percent and 8 percent from 2007–08 spending levels. The actual year–to–year change depends upon various underlying budget assumptions. In general, year–to–year program reductions fall into one of the following categories:
|
|
|
Figure 3
Major K-12 Education Programs
Funded by Proposition 98 |
|
(Dollars in Millions) |
|
|
Reviseda
2007‑08 |
Proposed 2008‑09 |
Change |
|
|
Amount |
Percent |
|
Revenue Limits |
|
|
|
|
|
General Fund |
$22,847.4 |
$21,328.5 |
-$1,518.9 |
-6.6% |
|
Local property tax revenue |
12,549.9 |
13,413.2 |
863.3 |
6.9 |
|
Subtotals |
($35,397.3) |
($34,741.7) |
(-$655.6) |
(-1.9%) |
|
Categorical Programs |
|
|
|
|
|
Special educationb |
$3,565.4 |
$3,359.6 |
-$205.8 |
-5.8% |
|
K-3 class size reduction |
1,829.7 |
1,689.2 |
-140.4 |
-7.7 |
|
Child care and development |
1,761.4 |
1,626.3 |
-135.0 |
-7.7 |
|
Targeted Instructional Improvement
Block Grant |
1,075.7 |
1,000.8 |
-75.0 |
-7.0 |
|
Economic Impact Aid |
994.3 |
929.7 |
-64.6 |
-6.5 |
|
Adult education |
753.7 |
722.4 |
-31.3 |
-4.2 |
|
Home-to-School Transportationc |
629.7 |
588.8 |
-40.9 |
-6.5 |
|
After School Education and Safety
Program |
547.0 |
487.4 |
-59.6 |
-10.9 |
|
Regional Occupational Centers and
Programsb |
524.6 |
492.0 |
-32.6 |
-6.2 |
|
School and Library Improvement Block
Grant |
465.5 |
433.0 |
-32.4 |
-7.0 |
|
Summer school programs |
420.8 |
393.5 |
-27.3 |
-6.5 |
|
Instructional Materials Block Grant |
419.8 |
390.5 |
-29.3 |
-7.0 |
|
Deferred maintenancec |
277.4 |
262.2 |
-15.1 |
-5.5 |
|
Professional Development Block Grant |
274.7 |
255.6 |
-19.1 |
-7.0 |
|
Grades 7‑12 counseling |
209.1 |
195.5 |
-13.6 |
-6.5 |
|
Public School Accountability Actc,d |
149.2 |
107.1 |
-42.1 |
-28.2 |
|
Other |
1,694.1 |
1,635.1 |
-59.0 |
-3.5 |
|
Subtotals |
($15,591.9) |
($14,568.7) |
(-$1,023.2) |
(-6.6%) |
|
Totals |
$50,989.2c |
$49,310.4 |
-$1,678.9 |
-3.3% |
|
Ongoing Proposition 98 |
$50,422.6 |
$49,310.4 |
-$1,112.3 |
-2.2% |
|
|
|
a Reflects
Governor's proposal for 2007‑08. |
|
b Includes
local property tax revenue. |
|
c Includes
funding from one-time sources used for ongoing purposes in
2007‑08. |
|
d In
addition to the 10.9 percent budget balancing reduction, the
High Priority Schools Grant Program is reduced by an
additional $29 million in 2008‑09 due to schools exiting the
program. |
|
|
- No Growth or COLA—10.9 Percent Reduction. Roughly 20 Proposition 98 programs do not typically receive annual growth or COLA adjustments. As a result, the year–to–year change for these programs reflects the Governor's full 10.9 percent reduction. The largest program in this category is the After School Education and Safety Program. (This program is discussed in more detail in the
“After School Programs”
section of this chapter.)
- COLA Only—6.5 Percent Reduction. Following statutory guidelines and typical practice, the Governor's budget assumes about 15 programs would otherwise have received a 4.9 percent COLA but no adjustment for changes in population. This results in a 6.5 percent year–to–year reduction. These programs include summer school and counseling.
- COLA and Growth Adjustment—Reduction Varies Based on Statutory Growth Rate. Statewide ADA is projected to decline at a rate of 0.5 percent in the budget year. Therefore, those programs that are typically adjusted for COLA and changes in ADA experience a net year–to–year funding reduction of 7 percent. The net change for programs with different statutory growth rates—including adult education, K–3 class size reduction, and child care and development—varies based on the specific growth factor applied.
Programs Funded With Local Property Tax Revenue Experience Smaller Reduction. Four K–12 programs receive some funding from local property tax revenue. Because the K–12 share of local revenues is projected to increase by 7 percent, the proposed 10.9 percent General Fund reduction is partially offset. These programs therefore would experience a smaller year–to–year decline in funding than many other Proposition 98 programs. Specifically, revenue limits for K–12 districts and COEs would experience a net combined decrease of 1.9 percent. Special education would decline by 5.8 percent, and funding for Regional Occupational Centers and Programs would decline by 6.2 percent. (Each program has a distinct growth rate and share of property tax revenue.)
Effect of Cuts on Schools. The effect of the Governor's proposed reductions would vary by district and by program. Generally, districts would have to reduce the level of services they provide. This could be accomplished either by reducing program services (serving the same number of students but less often, with fewer staff, or with lower quality) or by reducing program participation (providing the same program service but to fewer students). For programs that are required to maintain certain services for qualifying students, such as special education and mandated supplemental instruction programs, districts would have to backfill the loss of state funds with their general purpose dollars or reserves.
Enrollment levels are a major driver of K–12 budget and policy decisions. When enrollment grows rapidly (as it did in the 1990s), the state must dedicate a larger share of new resources to meeting statutory K–12 funding obligations. Conversely, when enrollment levels increase slowly or decline, fewer resources are needed to meet statutory funding obligations for revenue limits and categorical programs. This can leave more General Fund resources available for other budget priorities. In light of the important implications of enrollment levels, this write–up highlights major trends in the K–12 student population. We also discuss how enrollment trends and their implications may vary across different regions of the state.
The enrollment numbers used in this section are from the Department of Finance’s Demographic Research Unit and reflect aggregate, statewide enrollment. While the enrollment trends described here will likely differ from those in any given school district, they reflect the overall patterns the state is likely to see in the near future.
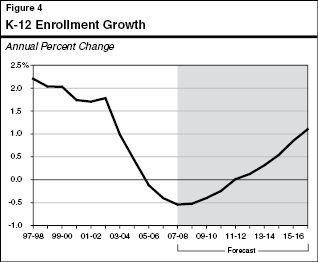
K–12 Enrollment on the Decline. K–12 enrollment is projected to decline in 2008‑09 for the fourth consecutive year—dropping by about 0.5 percent, for total enrollment of 6.2 million students. Figure 4 shows how enrollment growth has steadily slowed since the mid–1990s, with enrollment levels actually dropping since 2004–05. The figure also shows that K–12 enrollment is projected to continue declining until 2011–12.
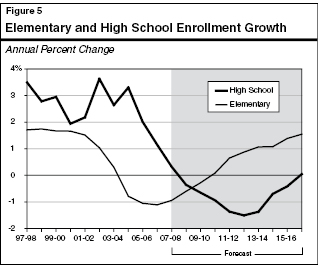
Divergent Trends in Elementary and High School Enrollment. Figure 5 shows that the steady decline in K–12 enrollment growth masks two distinct trends in elementary (grades K–8) and high school (grades 9 through 12) enrollment. Elementary school enrollment growth has slowed sharply since 2001–02, with actual declines in recent years. It is projected to begin growing again in 2010–11. In contrast, high school enrollment grew rapidly from 1996–97 through 2004–05. Beginning in 2005–06, however, high school enrollment growth also began to slow significantly. This trend is expected to continue, with actual declines projected beginning in 2008‑09. Between 2008‑09 and 2016–17, high school enrollment is projected to fall by more than 130,000 students, whereas elementary enrollment is projected to grow by almost 280,000 students.
Statewide Trends Mask Regional Differences. Despite the general downward trend in enrollment growth, significant variation is expected to occur across counties. For example, over the next eight years, K–12 enrollment in Los Angeles County is expected to decline by about 200,000 students (a 13 percent decline), whereas K–12 enrollment counts in Riverside County are expected to increase by about 170,000 students (a 39 percent increase). Growing regions of the state will have a greater need for new school facilities and new construction dollars, whereas declining areas will be closing school sites.
Effects of Declining Student Population on State Budget. A decreasing K–12 student population also could lead to a significant change in future Proposition 98 requirements. In most years, the Proposition 98 minimum funding requirement—referred to as the minimum guarantee—is based partially on growth in K–12 attendance. Thus, as enrollment continues to decline, a smaller share of the state’s new revenues will be required for K–14 education. However, once the “Test 1” component of Proposition 98 becomes operative, spending for K–14 education will be locked in at roughly 40 percent of the General Fund. As a result, the overall state budget will no longer benefit from declines in enrollment.
Return to Education Table of Contents, 2008-09 Budget AnalysisReturn to Full Table of Contents, 2008-09 Budget Analysis