LAO Contact

March 27, 2017
The 2017-18 Budget
Evaluating the State-County Assessors' Partnership Agreement Program
Summary
The property tax is a major source of revenue for local governments, raising more than $55 billion annually for counties, cities, special districts, and schools and community colleges (“schools”). Counties administer the property tax. While most local governments that receive property taxes reimburse the county for their share of administrative costs, schools are not required to pay these costs. Instead, counties pay the schools’ share of costs as well as their own. Statewide, counties pay about two‑thirds of the cost to administer the tax while receiving less than one‑third of the revenues they collect. As a result of this imbalance, there have been long‑standing concerns that counties might not fund property tax administration at an appropriate level. The state budget could be affected if property tax administration is inadequately funded because local property taxes that go to schools generally offset required state spending on education.
In recognition of concerns about the adequacy of funding for county assessors, the 2014‑15 Budget Act established a three‑year pilot program, known as the State‑County Assessors’ Partnership Agreement Program (SCAPAP). Under this program, the state allocated grants to eight county assessors’ offices to improve local administration of the property tax. A primary goal of SCAPAP was to measure whether and to what extent property tax revenues would increase if county assessor funding were increased.
In this report, we look at data from the first two years of SCAPAP and attempt to gauge the program’s effect on property tax revenues. Our analysis suggests the effect of SCAPAP on property taxes has been modest. There is even a good chance the state’s fiscal benefit from SCAPAP did not exceed state costs for the program.
Potential to realize additional property tax revenue, however, is not the only factor the Legislature should consider in deciding whether changes to county assessor funding are warranted. The current funding structure for county property tax administration, for example, raises important questions about intercounty disparities. Should the Legislature wish to address this issue, the most straightforward approach would be to allow counties to charge schools for their share of property tax administration costs.
Background
Property Tax Allocation
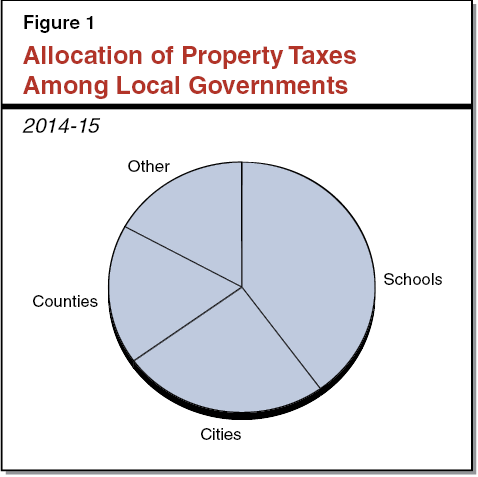
Property Tax a Key Local Government Revenue Source. The property tax is California’s second largest source of revenue, raising more than $55 billion annually for local governments—including cities, counties, special districts, and schools. Figure 1 shows how property tax revenues were distributed statewide to these governments in 2014‑15. In future years, the share of the property tax allocated to schools will increase to more than 50 percent due to the end of a temporary adjustment known as the “triple flip” and the dissolution of redevelopment.
Local Governments’ Shares of Property Tax Revenues Vary. The distribution of property taxes shown in Figure 1 reflects statewide averages. The share of property taxes allocated to specific counties, schools, and other local governments, however, varies across the state. Among other factors, this variation reflects taxation decisions of the mid‑1970s. In some counties, the distribution of property tax revenues differs considerably from the distribution shown in Figure 1. For example, Orange, San Mateo, and Santa Clara Counties get a smaller share of the countywide property tax than the share shown in Figure 1 and schools in these counties receive above‑average shares. Los Angeles and San Francisco Counties, in contrast, get a larger share of the countywide property tax and their schools receive smaller shares.
Property Taxes Also Affect State Budget. Though considered a local tax, the property tax has a major impact on the state’s budget. Under the state’s education finance system, the amount of school funding each year is set according to Proposition 98 and paid for with a combination of local property tax revenue and state General Fund revenue. Increases in property tax revenues generally allow for decreases in state General Fund spending on education. The state therefore benefits from additional local property taxes. In 2015‑16, local property taxes offset about $19.5 billion in required state spending on education. (In certain instances, under Proposition 98’s so‑called “Test 1” calculation, school property tax revenue increases the overall level of school funding and does not offset the required state contribution.)
Property Tax Administration
Counties Administer the Property Tax. County assessors determine the taxable value of property, county tax collectors bill property owners, and county auditors distribute the revenue among local governments. Statewide, county spending for assessors’ offices totals around $550 million each year. County costs for property tax collectors and auditors are unknown but much smaller.
Paying for Property Tax Administration. For most of the state’s history, counties paid all property tax administration costs using county resources. After passage of Proposition 13 in 1978 and some changes to state‑county program responsibilities, however, counties argued that they did not have sufficient revenues to continue paying all these costs. In 1990, the state authorized counties to split these costs among all governments receiving property tax revenues, including schools (Chapter 466 of 1990 [SB 2557, Maddy]). One year later, in response to concerns from schools—and related litigation—the state prohibited counties from charging schools, in effect requiring counties to cover the schools’ share of these costs (Chapter 75 of 1991 [SB 188, Maddy], and Chapter 333 of 1991 [SB 282, L. Greene]).
Cost Allocation System Raises Concerns. Making counties responsible for covering the schools’ share of property tax administrative costs has prompted concerns that counties might not fund these activities appropriately. This is because counties pay a large share of property tax administrative costs (often more than two‑thirds) yet receive a small share of property tax revenues (often less than one‑third). County assessors have a statutory obligation to administer the property tax fairly and effectively. As part of county government, however, funding for county assessors’ offices depends on annual budget decisions by county boards of supervisors. Given the many competing uses for county resources, it is reasonable to assume that supervisors are more likely to approve assessor office spending proposals that generate enough county benefits to offset the county’s costs.
Counties’ Shares of Costs Vary. As discussed above, the share of property taxes received by schools varies considerably from county to county. This means that the share of property tax administration costs covered by counties also varies significantly, with some counties paying a comparatively high share of costs. In these counties, the potential that county assessors are underfunded is heightened. Beyond concerns over funding, this situation also raises a question of fairness: should some counties be required to pay a higher share of property tax administration costs than others, leaving those counties with less funding for other public services? There does not appear to be a compelling rationale for this differential treatment.
Inadequate Funding Could Mean Less Property Tax Revenue. If tax property tax administration is not funded adequately, counties could collect less property taxes for all local governments than they otherwise would. This would also affect the state because most property tax revenue allocated to schools offsets required state spending on education.
Inadequate Funding Also Raises Other Concerns. The state also has a policy interest in funding to county assessors being sufficient to ensure a fairly administered property tax system, with accurate determinations of value, complete property tax rolls, accessible records, and full compliance with the laws governing property tax administration. Such a system likely would function more efficiently, be viewed more favorably by taxpayers, and would help ensure that property owners in different counties are treated similarly.
State‑County Assessors’ Partnership Agreement Program
In recognition of concerns about the adequacy of funding for county assessors, the 2014‑15 Budget Act established a three‑year pilot program known as the State‑County Assessors’ Partnership Agreement Program (SCAPAP). Under this program, the state allocated grants to eight county assessors’ offices to improve local administration of the property tax. The eight participating counties and their respective grant amounts are shown in Figure 2. Each participating county was required to match the state grant dollar for dollar. Funds were to be used to identify newly constructed or sold properties, revalue properties to their current market value, and respond to property value appeals. These activities were anticipated to generate additional local property taxes, a portion of which would be directed to schools, offsetting state education spending.
Figure 2
Funding Allocations to
Participating County Assessors
(In Thousands)
|
County |
2014‑15 |
2015‑16 |
2016‑17 |
|
Fresno |
$825 |
$619 |
$619 |
|
Madera |
150 |
150 |
150 |
|
Monterey |
200 |
200 |
200 |
|
Riverside |
1,875 |
1,875 |
1,875 |
|
San Benito |
150 |
150 |
150 |
|
San Francisco |
300 |
460 |
525 |
|
Santa Clara |
785 |
785 |
785 |
|
Tuolumne |
104 |
104 |
104 |
|
Totals |
$4,389 |
$4,343 |
$4,408 |
Evaluating SCAPAP
Although the final year of SCAPAP is still ongoing, the legislation establishing SCAPAP requires the Department of Finance to report to the Legislature in May 2017 on the program’s outcomes. To further assist the Legislature in evaluating SCAPAP, our office has analyzed data from 2014‑15 and 2015‑16 to gauge whether the program has measurably increased property tax revenues. Our analysis suggests the effect of SCAPAP on property taxes has been modest. We estimate that increased property tax revenue to schools from SCAPAP were at best slightly above the state cost of the program. There is, however, a good chance that revenue gains fell short of state costs.
Below, we provide a brief description of how the county assessors spent their SCAPAP grant funds and then discuss the results of our analysis of the effect of SCAPAP on property tax revenues. A more detailed description of our methodology can be found in the technical appendix.
How Did Assessors Spend the Grant Funds?
SCAPAP Funds Primarily Used for Additional Staff. County assessors used SCAPAP funds (both state grants and county matching funds) to hire additional employees, including property appraisers, information services staff, clerical staff, and administrative staff. Figure 3 details the number of new employees hired by each participating county. As Figure 3 shows, in some counties the additional staff were a modest increase from previous levels (around 3 percent in Santa Clara County), while representing a more substantial increase in other counties (roughly 25 percent in San Benito County). Assessors also used SCAPAP funds to pay for services from contract workers and retired annuitants.
Figure 3
SCAPAP Funds Primarily Spent on
Additional Staff
Additional Staff Paid for by SCAPAP
|
County |
2014‑15 |
2015‑16 |
Increase Over 2013‑14 |
|
|
2014‑15 |
2015‑16 |
|||
|
Fresno |
17.0 |
15.0 |
20% |
17% |
|
Madera |
1.5 |
2.5 |
6 |
10 |
|
Monterey |
4.5 |
4.0 |
9 |
8 |
|
Riverside |
5.0 |
19.0 |
3 |
10 |
|
San Benito |
3.0 |
2.5 |
30 |
25 |
|
San Francisco |
8.0 |
9.0 |
6 |
7 |
|
Santa Clara |
7.0 |
8.0 |
3 |
3 |
|
Tuolumne |
2.0 |
2.0 |
18 |
18 |
|
SCAPAP = State‑County Assessors’ Partnership Agreement Program. Note: Part‑time staff displayed as 0.5 full‑time staff. |
||||
Did SCAPAP Increase Property Tax Revenues?
Our Approach to Analyzing SCAPAP’s Effect on Property Tax Revenues. Determining the effect of SCAPAP on property tax revenues is difficult because it is not possible to know how much revenue would have been collected in the absence of the program. As we discuss in detail in the box below, this can make straightforward approaches—such as calculating the increase in taxable property values arising from work completed by newly hired staff—problematic. In light of these challenges, we developed a statistical model to estimate what would have happened to taxable property values (and resulting property tax revenues) in the absence of SCAPAP. To estimate what would have occurred in SCAPAP counties, our model draws on information about (1) growth in taxable property values in SCAPAP counties in years leading up to the program; (2) home prices, home sales, and residential and commercial building permits in SCAPAP counties; and (3) taxable property value growth in counties that did not participate in SCAPAP. To estimate the effect of SCAPAP, we compare actual growth in taxable property values in SCAPAP counties to our estimates of what would have occurred without SCAPAP.
Why Not Focus on Workload Completed by New Staff?
County assessors primarily used the State‑County Assessors’ Partnership Agreement Program (SCAPAP) funds to hire additional staff to perform various activities—such as identifying and valuing newly constructed buildings and revaluing properties to their current market values—that generally result in an increase in taxable property values and therefore higher property tax revenues. Participating county assessors were required to report how many of these types of activities were performed by staff paid for with SCAPAP funds and how much these activities added to their county’s property tax base. One potential approach to estimating the effect of SCAPAP on property tax revenues could be to total these reported increases in taxable property values.
This approach, however, is problematic because it fails to account for what might have occurred otherwise. Had assessors not received SCAPAP funds, two possible scenarios could have occurred: (1) the workload performed by SCAPAP funded staff would not have occurred and taxable property values would not have increased or (2) the workload performed by SCAPAP funded staff would have been absorbed by existing staff and taxable property values would have increased anyway. Simply totaling the taxable property value increases attributable to work performed by SCAPAP staff ignores the possibility of scenario 2.
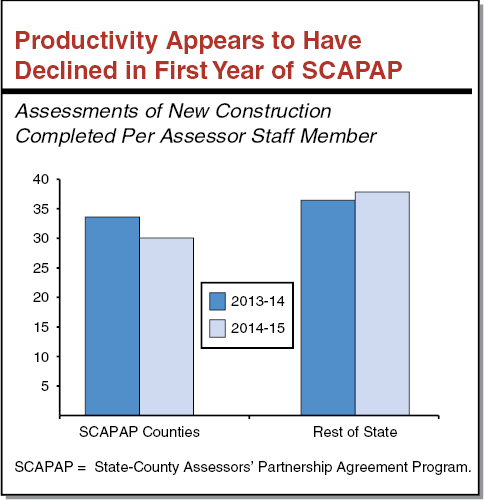
We cannot be sure whether scenario 1 or scenario 2 (or some combination of the two) would have occurred. We do, however, see some evidence that suggests at least some of the workload performed by SCAPAP staff could have been absorbed by existing staff. Based on data reported by county assessors to the State Board of Equalization, assessor staff productivity appears to have declined somewhat during the first year of SCAPAP (2014‑15) relative to the year before. The figure shows that the number of new construction assessments completed per assessor staff declined from 34 to 30 in SCAPAP counties, while increasing from 37 to 39 in counties that did not participate. We see a similar pattern in the number of revaluations of properties that previously received a reduction in their taxable value in light of declining real estate values during the Great Recession. The number of these reevaluations completed per staff member declined by 100 (from 215 to 115) in SCAPAP counties, while declining by only about 70 (from 210 to 140) in nonparticipating counties. There are other possible explanations for these trends—for example, some staff effort in SCAPAP counties may have been diverted to training newly hired staff—but we cannot rule out that a shift in workload from existing staff to newly hired staff occurred.
Modest Effect on Property Tax Revenue. Based on the results of our statistical model, we have developed a range of values that the effect of SCAPAP is likely to fall in. At the high end of our range, our estimates suggest SCAPAP may have increased property taxes to all local governments in participating counties by as much as $10 million to $15 million annually, with $4 million to $6 million of this increase going to schools. At an annual cost of about $4.5 million, this means the state, at best, came out slightly ahead. There is, however, a good chance that revenue gains were lower. In fact, our range contains zero—meaning that we cannot rule out that the program had no effect on revenues. In these cases, the benefits to the state—in terms of reduced school funding obligations—are less than the annual state cost.
Caveats. Our analysis is limited by several factors. As with any statistical analysis in public finance, our results are subject to some level of estimation and measurement error. We also only had data on taxable property values for the first two years of SCAPAP. It is possible that the third year of the pilot may result in larger increases in taxable property values. SCAPAP also may have facilitated procedural or technological improvements within assessors’ office which may have longer‑term effects on growth in property values. These effects would not be captured by our analysis.
Policy Implications
Modest Expectations About Property Tax Gains Seem Warranted. The Legislature has had long‑standing concerns about the adequacy of funding for county assessors. Over the years, a wide variety of approaches to address this issue have been proposed. Three years ago, our office suggested that SCAPAP would provide important information to inform such efforts.
Our assessment of SCAPAP offers a key takeaway: this pilot tempers our expectations about the potential property tax gains that could come from additional funding to county assessors. Our analysis of SCAPAP suggests that its effect on property tax revenues has been modest. There appears to be a good chance the state benefit from SCAPAP—via decreased need for General Fund spending for schools—did not exceed the state costs for the program. While the results of a temporary pilot program may not perfectly foretell what might occur with broader, permanent reforms, these results nonetheless suggest that modest expectations about potential property tax gains are warranted.
We note, however, that these conclusions are based on an analysis of only the first two years of the program. Should future analyses of the program’s third year or years immediately following the program find different results, it may be appropriate to reconsider our findings.
Uneven Treatment of Counties Remains a Concern. Potential to realize additional property tax revenue, however, is not the only factor the Legislature should consider in deciding whether changes to county assessor funding are warranted. The current funding structure for county property tax administration, including county assessors, raises important questions about intercounty disparities. Because the school share of property taxes varies across counties, requiring counties to cover the schools’ share of property tax administration costs places a greater burden on some counties than others. Those counties, in turn, have less funding available for other public services. There appears to be little justification for these disparities.
Options. Should the Legislature wish to eliminate these disparities across counties, the most straightforward approach would be to allow counties to charge schools for their share of property tax administration costs—likely totaling between $220 million and $280 million statewide. The Legislature has a variety of options for implementing such a change. These options range from the state paying for schools’ share of costs on their behalf to requiring schools to pay for their share of costs out of their general purpose funds.
Technical Appendix
Goal. Our goal was to estimate the effect of the State‑County Assessors’ Partnership Agreement Program (SCAPAP) on taxable property values in participating counties while accounting for growth in taxable property values that would have occurred in the absence of SCAPAP.
Approach. We developed an econometric model to estimate the effect of SCAPAP participation on growth in taxable property values of cities in participating counties. Our model attempts to explain annual changes in taxable property values based on changes in residential and commercial building permits, home prices, and home sales. It also includes an indicator of whether or not each city was in a SCAPAP county. Finally, we include indicators of the year and county to account for any idiosyncrasies specific to a particular year or county. This method essentially holds constant broader economic factors that affect taxable property values and isolates the effect of SCAPAP from these other factors.
We estimate our model using ordinary least squares with cluster‑robust standard errors, accounting for clustering of our city level observations at the county level due to SCAPAP applying to all cities in participating counties. We use city, as opposed to county, observations because this provides us additional data points, allowing us to capture additional nuance in the relationship between property value growth and the explanatory factors. We also attempted to estimate our model with county‑level data, but could not estimate the effect of SCAPAP with meaningful precision.
Data. We attempt to explain annual growth in taxable property values for property tax roll years 2013‑2014 through 2016‑17. This period includes two years before and after the establishment of SCAPAP. (The property tax roll for a given year is largely determined by county assessor work done in the preceding year.) Data on taxable property values by city comes from the Board of Equalization. Our data on home prices and home sales comes from the real estate site Zillow. For residential and commercial permits, we used data from the Construction Industry Research Board.
Results. The results of our regression are shown in Figure A‑1. The broader economic variables all have the expected relationship with taxable property values: higher home prices and sales and more residential and commercial construction contribute to higher taxable property values. The point estimate of the effect of SCAPAP on taxable property values is slightly negative. This estimate, however, is subject to some uncertainty. Recognizing this uncertainty, we estimated a range of values in which the effect of SCAPAP is likely to fall (a 95 percent confidence interval). This range includes zero as well as some positive values.
Figure A‑1: Regression Results
Dependent Variable: Annual Change in Taxable Property Valuesa
|
Explanatory Variablesc |
Coefficient |
Standard Error |
|
In a SCAPAP county |
‑0.004 |
0.002 |
|
Median home pricea,b |
0.009 |
0.002 |
|
Annual change in home pricea,b |
0.148 |
0.032 |
|
Change in home price over past three yearsa,b |
0.041 |
0.019 |
|
Residential permit value as a percent of prior year property tax rollb |
0.944 |
0.196 |
|
Commercial permit value as a percent of prior year property tax rollb |
0.320 |
0.184 |
|
Existing home salesb |
0.325 |
0.074 |
|
Constant |
‑0.119 |
0.029 |
|
aVariable in logs. bVariable lagged one year. cCounty and year effects also included but not reported here. |
||