The EITC is a provision of the federal income tax code that allows taxpayers with total income below a certain level to reduce their tax liability by an amount that depends on their “earned income,” which primarily includes wages and self–employment income. (Earned income does not include such sources as interest income, retirement income, or unemployment benefits.) Many states have EITC provisions in their own income tax laws which supplement the federal EITC and in most cases are patterned after the federal EITC. California does not have its own EITC. In June 2014, in its Supplemental Report of the 2014–15 Budget Package, the Legislature directed our office to prepare a report with options for a state EITC and analysis of the costs, benefits, and trade–offs associated with these options. This report fulfills that requirement. A list of stakeholders we consulted in the course of developing this report can be found in Appendix 1.
In this report, we first discuss the structure and effectiveness of the federal EITC. This is followed by a brief discussion of current state–level EITCs. We then examine the key decisions state policymakers would face in designing an EITC for California and present some options. We conclude with some general implementation considerations that would arise regardless of how a state EITC were structured.
History. The federal EITC was established in 1975. Initially, it was intended to compensate lower–income workers for the federal payroll taxes that fund the Social Security and Medicare programs, and the amount of the credit was limited to the taxpayer’s payroll tax liability up to a certain income level. Over time, its purpose became to increase the rewards to paid work and reduce poverty. It was expanded significantly in 1986, 1990, and 1993 to the point where its benefits greatly exceed payroll tax liabilities for most beneficiaries. The EITC has become a major federal antipoverty program with a total cost of $64 billion in 2012, spread over nearly 28 million tax returns.
EITC Can Reduce Liability Below Zero. As the name suggests, the EITC is a federal tax credit. This means that its value is used to reduce a taxpayer’s final federal income tax liability, after computing taxable income and then applying the relevant tax rates. This is in contrast to a deduction, which is used to reduce taxable income before rates are applied. The EITC is a “refundable” credit, meaning that if the amount of a taxpayer’s EITC is greater than his or her liability before applying the credit, then the federal government actually owes the taxpayer money for that year. For example, if a person’s tax liability excluding the EITC is $200 and the calculated EITC amount is $500, then the final liability including the EITC is negative $300: the federal government owes the taxpayer $300. In contrast, if the credit were “nonrefundable,” the taxpayer’s liability could not be reduced below zero even if the EITC amount were greater than the liability excluding the EITC.
As Income Increases, Credit Amount Rises, Then Phases Out. The EITC benefit schedule depends on the number of dependent children the taxpayer has and on whether they are filing a single or joint tax return. In every case, as shown in Figure 1, the EITC has:
- A “phase–in” range of earned income where the total EITC amount steadily increases with every dollar earned. For the example shown in Figure 1, the taxpayer receives 40 cents in credit for each dollar earned over this range.
- A “flat” range where the taxpayer gets the maximum possible EITC amount for their filing status and number of dependents, and additional earned income does not affect the amount of the EITC benefit. For the example shown in Figure 1, the taxpayer would receive the maximum benefit of $5,460 over this range.
- A “phase–out” range where the total EITC amount declines steadily with every dollar earned. For the example shown in Figure 1, the taxpayer would lose about 21 cents in credit for each dollar earned over this range.
Taxpayers With Dependents Get Bigger Benefit. The setup of the EITC for single and jointly filing (married) taxpayers for tax year 2014 is outlined in Figure 2 and displayed graphically in Figure 3. The credit amount is considerably bigger for parents than it is for childless filers. The increase in the credit for the second child is far smaller than for the first, the increase for the third child is far smaller than for the second, and there is no increase in the EITC benefit for any child beyond the third. For joint filers, the amount of earned income at which the EITC begins to phase out is higher (by $5,430 in 2014). This is consistent with overall federal income tax policy that includes broader income brackets and bigger standard deductions for joint filers than for single filers.
Figure 2
Federal Earned Income Tax Credit Provisions
2014 Tax Year
|
|
Number of Dependents
|
|
0
|
1
|
2
|
3+
|
|
Maximum EITC benefit
|
$496
|
$3,305
|
$5,460
|
$6,143
|
|
Endpoint of phase–in range
|
6,480
|
9,720
|
13,650
|
13,650
|
|
Single filers only:
|
|
|
|
|
|
Endpoint of flat range
|
8,110
|
17,830
|
17,830
|
17,830
|
|
Endpoint of phase–out range
|
14,590
|
38,511
|
43,756
|
46,997
|
|
Joint filers only:
|
|
|
|
|
|
Endpoint of flat range
|
13,540
|
23,260
|
23,260
|
23,260
|
|
Endpoint of phase–out range
|
20,020
|
43,941
|
49,186
|
52,427
|
|
Phase–in percentagea
|
7.65%
|
34.00%
|
40.00%
|
45.00%
|
|
Phase–out percentageb
|
7.65
|
15.98
|
21.06
|
21.06
|
The following examples illustrate how the phase–in and phase–out percentages shown in Figure 2 would be applied to calculate the EITC in 2014 for different households.
- A single mother with two dependent children has $12,000 of earned income, which is less than the endpoint of the phase–in range. She receives 40 percent of her income, or $4,800, as an EITC benefit.
- Another single mother with two children has $14,000 of earned income. Because her income is within the flat range, she receives the maximum EITC benefit of $5,460. If her income were $17,000, her EITC would still be $5,460 as her income would still be within the flat range.
- A married couple with one child has $38,000 of earned income. Their EITC benefit is $950. Their maximum possible benefit would be $3,305, but because their income is within the phase–out range their EITC is reduced by roughly 16 cents for every dollar of income above $23,260, the endpoint of the flat range.
Work Incentives Determined by Earnings Opportunities and Public Assistance Participation. An individual’s decision whether to work and for how many hours depends on many factors, including the wages that can be received from available work opportunities, the amount of those earnings that will be lost to taxation, and how the amount of any public assistance the individual receives may change due to additional earnings. Participation in public assistance programs matters for work incentives because means–tested programs—meaning those that are available only to individuals and families with income and assets below certain levels—generally phase out the amount of assistance provided as earnings increase. As individuals who receive public assistance increase their earnings, these increased earnings are offset by reduced assistance. This reduces the individual’s incentive to work and to increase earnings.
Take–Home Resources From Additional Earnings Depend on Earnings Level. Figure 4 displays the amount of monthly take–home resources an individual would receive if he or she increased monthly earnings by $100 increments. This represents the effective benefit to an individual of increasing earnings, after accounting for earnings lost to taxes and reduced public assistance. For example, suppose a single parent with two children receives major forms of public assistance, including cash aid and welfare–to–work services through the California Work Opportunity and Responsibility to Kids (CalWORKs) program, food assistance through the CalFresh program, and health coverage through the California Medical Assistance (Medi–Cal) Program. As shown in the figure, if the parent increased his or her earnings from nothing to $100 per month, and is assumed not to claim the federal EITC, the household’s additional take–home resources would be just under $70. In other words, of the $100 in new gross income, the family would keep just over two–thirds. Further $100 increases in monthly earnings would result in somewhat less in additional take–home resources, but generally not less than $45 for each $100 increment of additional earnings. One notable exception is when monthly earnings are increased from $2,200 to $2,300, at which point the household is estimated to actually lose resources. This results from our assumption that the household would become ineligible for health coverage through Medi–Cal at this point and would begin paying monthly premiums for health insurance (as reduced by federal subsidies provided through the federal Patient Protection and Affordable Care Act). In general, the lower the amount of take–home resources available from a given increase in earnings, the less the incentive an individual has to increase earnings.
Under Federal EITC, Take–Home Resources Increase at Lower Earnings Levels, Decrease at Higher Levels. Unlike many public assistance programs, the federal EITC benefit is structured to increase with earnings over a certain range of income. For example, if the same single parent were to increase monthly earnings from nothing to $100 and claim the federal EITC, the increase in take–home resources would be nearly $110. In other words, the household would receive more than the amount they earned, notwithstanding the effect of taxes and declining public assistance benefits. As described earlier, the federal government pays the individual a percentage on top of their earnings. This increases the person’s incentive to work. For further $100 increases in earnings, the federal EITC continues to increase the amount of take–home resources received above what they would have been without the EITC, until the end of the credit’s phase–in range is reached at about $1,200 of monthly earnings. For monthly earnings between $1,300 and $1,500, the federal EITC has no effect on incremental take–home resources, meaning that the parent’s incentives to increase earnings are the same as they would have been without the EITC. This is because the EITC’s value does not change over this flat range. For increases in monthly earnings to $1,500 and beyond, the EITC begins to phase out, meaning that additional take–home resources from additional earnings are less than they would have been without the EITC. Over this range, the EITC reduces the parent’s incentive to work.
Work Incentives Over Discrete Intervals of Hours Worked. Figure 4 shows the changes in incentives individuals would face if they had the flexibility to make small changes in their earnings levels. It may be useful to consider the work incentive effects of the federal EITC over discrete intervals of work hours, as this may more accurately reflect individuals’ available work decisions. For example, suppose a parent is currently out of the labor force and considering whether to take employment for 20 hours per week at $10 per hour. If this parent is enrolled in the same major public assistance programs described earlier, he or she would need to balance the benefit of increased earnings (roughly $900 dollars per month, assuming 4.33 weeks per month) against taxes and the loss of public assistance benefits. Assuming the parent has two dependent children and does not claim the federal EITC, we estimate that about half of the increase in gross income would be offset by increased payroll and income taxes and reduced public assistance. In other words, even though the nominal wage of the employment opportunity is $10 per hour, these offsetting reductions mean the individual would effectively receive an average wage of only $5.41 per hour. However, the federal EITC provides significant resources as earnings increase. Its benefit makes up for most of the loss from taxes and other public assistance programs, increasing the average effective wage for the employment opportunity to $9.56 per hour. Thus, the federal EITC substantially increases work incentives above what they would be otherwise. Figure 5 displays several other examples of how different employment decisions are affected by the federal EITC.
Figure 5
Federal EITC and Changes in Work Incentives
For a Single Filer With Two Dependent Children
|
Weekly Hours of Work
|
|
Average Effective Hourly Wage
|
|
Before
|
After
|
Without Federal EITC
|
With Federal EITC
|
Change
|
|
0
|
20
|
|
$5.41
|
$9.56
|
+$4.15
|
|
20
|
40
|
|
3.65
|
4.23
|
+0.58
|
|
0
|
40
|
|
4.53
|
6.90
|
+2.37
|
EITC Directly Reduces Poverty by Providing Resources to Low–Income Households. By providing additional resources to low–income individuals and families, the EITC directly reduces the number of individuals that are considered to be in poverty (poverty being defined as having resources that are less than established poverty thresholds). In 2012, over 3.2 million Californians filed for the federal EITC. The combined value of these claims was nearly $7.3 billion (including both reduced income tax liability and direct refunds). We estimate that roughly 10 million Californians were in a household that benefited from the federal EITC. Of these 10 million, we estimate that the federal EITC kept roughly 750,000 individuals out of poverty, as defined by the U.S. Census Bureau’s Research Supplemental Poverty Measure (SPM), described in greater detail the box below. This reduces the state’s SPM poverty rate to 23.4 percent—2 percentage points lower than it would have been absent the federal EITC. (A detailed description of our methodology to estimate poverty impacts can be found in Appendix 2.) This direct reduction to poverty accounts only for the additional resources received from the EITC—it does not account for additional resources received by families because of increased labor market participation or work effort, as described below. As a result, this estimate understates the federal EITC’s full poverty impact.
Background on Poverty Measurement. Poverty is often defined as the condition of having insufficient resources to achieve a minimum standard of living. In general, measuring poverty requires (1) counting the resources that a household has available for meeting basic needs and (2) comparing these resources against a threshold that approximates the cost for that household to achieve the minimum standard of living. If a household’s resources are less than the poverty threshold, all members of the household are considered poor.
Official Poverty Measure (OPM) Was Developed in Early 1960s. The federal government’s primary poverty measurement methodology, which we refer to as the OPM, has been in place since the early 1960s. The OPM defines resources as pre–tax cash income, which includes many forms of income including earnings and some government transfer payments (like Social Security retirement benefits), but excludes the effect of government transfers that take place through the tax system (such as the federal earned income tax credit) and some other major means–tested assistance programs (most notably CalFresh food assistance). Poverty thresholds under the OPM are defined as three times the cost of a low–cost food budget in the 1950s, adjusted annually for inflation. (Surveys at that time indicated that low–income households spent roughly one–third of their resources on food.) These thresholds vary by family size and composition, but are identical for similar families across the continental U.S.
Research Supplemental Poverty Measure (SPM) Differs From OPM. In 2011, the U.S. Census Bureau began publishing a second set of poverty statistics under a new methodology referred to as the SPM. The SPM methodology uses a more comprehensive resource definition that includes, among other things, the effect of income taxes paid and credits received, as well as other major means–tested assistance programs. Unlike OPM poverty thresholds, SPM poverty thresholds are adjusted for the household’s housing circumstances (including the regional cost of housing). As a result, SPM poverty thresholds vary significantly among states, and are generally higher in California than in most other states (due to California’s relatively high housing costs).
The SPM Allows for Estimating Poverty Effects of Antipoverty Policies. Because the SPM resource definition is comprehensive enough to include most government transfer programs, the SPM methodology can be used to estimate the impact that different policy choices may have on the number of individuals in poverty. Throughout this report, we provide estimates of the number of individuals moved out of poverty that were calculated using the SPM methodology on survey data made available by the U.S. Census Bureau. We note that the SPM methodology, and our estimates, do have some limitations that are described in Appendix 2. These estimates are intended only to provide a rough sense of the magnitude of potential effects in order to facilitate comparisons among competing policy options, but are subject to uncertainty and should be interpreted with caution.
The EITC Encourages Work Among Single Parents, Slightly Discourages Work Among Second Earners. Conceptually, the federal EITC greatly increases a single parent’s incentive to work, especially if the available work is part time or for low wages. The real world evidence is consistent with that, suggesting that the EITC spurs an increase in work effort among single mothers. This effect is particularly prominent for relatively low–earning workers (those whose earnings would place them in the phase–in or flat ranges of the federal EITC) and those who have relatively low initial skill levels. The national employment rate of single mothers increased from 73 percent in 1984 to 85 percent in 2003, and numerous academic studies suggest that much of this increase was due to several EITC expansions over that period. Although conceptually the EITC should be expected to decrease work effort among individuals in the phase–out range, evidence suggests that this effect is minor in practice. Evidence does suggest a small reduction in work participation and hours worked among the lower–earning adults in two–earner households, typically married women.
EITC Linked to Improved Child Educational and Health Outcomes. Recent academic studies have established a link between the increased family resources provided by the federal EITC and both short– and long–term improvements in children’s educational outcomes. Increased resources from the federal EITC have also been linked to improved infant health outcomes, such as reduced incidence of low birth weight. A listing of some research articles relating to EITC effects is included in Appendix 3.
Minimum Wage Changes Can Affect EITC Benefits. Both the minimum wage and the federal EITC are broadly conceived as antipoverty policies intended to increase the rewards to paid work. These two policies interact, as we discuss below.
California’s minimum wage is set to rise from $9 to $10 per hour at the beginning of 2016. Evidence suggests that increasing the minimum wage may reduce employment somewhat among people who were previously making less than the new minimum wage. The remaining workers who were previously below the new minimum wage would benefit from higher wages, which would increase their earned income under the EITC.
The effect of a minimum wage increase on the total amount of benefits provided through the federal EITC is not immediately clear, as workers could see their EITC payments rise or fall depending on their family status and on how many hours they work. For single parents, the phase–out range starts at about $18,000 a year, which is less than the $20,000 a worker would earn by working full time (50 weeks at 40 hours per week) at $10 an hour. A number of full–time or near–full–time workers would thus move into or further down the phase–out range as a result of the minimum wage increase, and their EITC payments would decline. Minimum wage workers in two–income households would also likely see lower EITC benefits, as they are likely to be within the phase–out range even before the minimum wage is increased. On the other hand, single parents with wages below the new minimum wage who work less than full time and/or for less than a full year would likely start out within the phase–in range, and thus would see a bigger EITC benefit if the minimum wage were increased.
EITC Has Little Impact on Eligibility for Major Public Assistance Programs. Because the substantial resources made available through the federal EITC could potentially affect eligibility for means–tested public assistance programs, federal and state law require that federal EITC benefits cannot be considered when determining eligibility for many programs. However, there are exceptions. One example is the CalWORKs program. Under current state law, federal EITC benefits that the recipient saves for longer than two months after they are received would be counted against the CalWORKs asset limit, which is $2,000 for most families, unless the benefits are placed in a restricted account or a qualifying retirement or educational savings account. As a result, CalWORKs recipients who claim the federal EITC generally must either spend the benefits within two months of receiving them, place the benefits in an approved account, or be discontinued from CalWORKs assistance. Should the state adopt its own EITC, it could choose whether state EITC benefits would be considered as income and assets.
Improper Payments a Common Problem. The federal EITC has historically had a high level of improper payments to people who claimed a bigger credit under the EITC (or in rare cases, a smaller credit) than they were in fact eligible for. Some incorrect claims stem from honest mistakes in reporting income or confusion about which parent gets to claim a child as a dependent, but others are a result of deliberate fraud. The IRS estimates that nearly half of EITC returns from 2006 to 2008 claimed a credit amount larger than the filer was in fact eligible for, while less than 10 percent of returns claimed an amount that was too small.
The IRS estimates that the dollar value of improper claims was between 29 percent and 39 percent of total claims, or between $14 billion and $19 billion annually from 2006 through 2008. Of this amount, they estimate that (among other things) $7 billion to $10 billion of improper claims were due to misreporting the number of qualifying dependents, $3 billion to $4 billion from misreporting self–employment income, and roughly $1 billion from misreporting wage income. A reference to a recent IRS analysis on EITC compliance can be found in Appendix 3. These estimates do not account for IRS efforts to prevent or recover improper payments. After accounting for such enforcement efforts, the overpayment percentage was between 22 percent and 26 percent in federal fiscal year 2013, or between $13.3 billion and $15.6 billion (reflecting growth in total EITC payments).
As of tax year 2014, 25 states and the District of Columbia had EITC provisions in their own income tax laws. As shown in Figure 6, the vast majority of these states piggyback on the federal EITC, meaning that a taxpayer’s state EITC benefit is simply a fixed percentage of his or her federal EITC benefit. For example, in Vermont a taxpayer’s state EITC benefit is always 32 percent of his or her federal EITC benefit. Thus, if the taxpayer’s federal EITC were $1,000, his or her Vermont EITC would be $320—for a combined EITC amount of $1,320. In most states, the state EITC is refundable just as the federal EITC.
Figure 6
State EITCs in 2014
|
State
|
State EITC as
Percent of
Federal EITC
|
Refundable?
|
|
District of Columbia
|
40.00%
|
Yes
|
|
Vermont
|
32.00
|
Yes
|
|
New York
|
30.00
|
Yes
|
|
Connecticut
|
30.00
|
Yes
|
|
Maryland
|
25.00
|
Yesa
|
|
Delaware
|
20.00
|
No
|
|
New Jersey
|
20.00
|
Yes
|
|
Virginia
|
20.00
|
No
|
|
Kansas
|
17.00
|
Yes
|
|
Massachusetts
|
15.00
|
Yes
|
|
Iowa
|
14.00
|
Yes
|
|
Illinois
|
10.00
|
Yes
|
|
Nebraska
|
10.00
|
Yes
|
|
New Mexico
|
10.00
|
Yes
|
|
Ohio
|
10.00
|
No
|
|
Indiana
|
9.00
|
Yes
|
|
Oregon
|
8.00
|
Yes
|
|
Michigan
|
6.00
|
Yes
|
|
Maine
|
5.00
|
No
|
|
Oklahoma
|
5.00
|
Yes
|
|
Rhode Island
|
3.75
|
Yesb
|
|
Louisiana
|
3.50
|
Yes
|
|
States With Variable EITC Percentages:
|
|
Minnesota
|
24–37%c
|
Yes
|
|
Wisconsin
|
0–34
|
Yes
|
|
States With EITCs in Law but Not Currently in Effect:
|
|
Colorado
|
10%
|
Yes
|
|
Washington
|
10
|
Yes
|
Variations in State EITC Design. In this section, “percent” means the percentage of the taxpayer’s federal EITC benefit that the state allows as an additional credit for the same year. Two states have credits that are partially refundable: Maryland gives taxpayers the option of taking either a 25 percent refundable credit or a 50 percent nonrefundable credit, but not both. Rhode Island allows up to a 25 percent credit, but just 15 percent of this amount (3.75 percent of the federal credit) is refundable. Two states deviate from the standard practice of making the state EITC a flat percentage of the federal EITC: Minnesota's EITC phases in and out at different earned income levels than the federal EITC and does not provide a higher benefit for filers with three or more dependents, effectively matching between 24 percent and 37 percent of the federal credit for lower levels of income. Wisconsin has no state credit for childless workers, 4 percent for one child, 11 percent for two children, and 34 percent for three or more.
Past Legislative Proposals for a California EITC. Bills to create a state EITC in California have been introduced on several occasions. As shown in Figure 7, the majority of past proposals would have created a fully refundable state EITC equal to 15 percent of the amount of a tax filer’s federal EITC. More recently, some legislation has considered alternative structures for a state EITC, such as state EITCs that do not piggyback on the federal credit amount or that are nonrefundable. None of these proposals were adopted by the Legislature.
Figure 7
Legislative Proposals Considered, But Not Passed, to Create a California EITC
|
Legislative Session
|
Bill (Author)
|
Proposed State EITC Structure
|
|
1999–00
|
AB 1854 (Cedillo)
|
Fully refundable credit equal to 15 percent of the amount of the filer’s federal EITC.
|
|
1999–00
|
SB 1421 (Solis)
|
Same as above.
|
|
2001–02
|
AB 106 (Cedillo)
|
Same as above.
|
|
2003–04
|
SB 224 (Cedillo)
|
Same as above.
|
|
2007–08
|
AB 21 (Jones)
|
Nonrefundable credit equal to 4 percent of taxable income for low to moderate income taxpayers, up to a maximum of $200.
|
|
2011–12
|
AB 1196 (Allen)
|
Fully refundable credit equal to 15 percent of the amount of the filer’s federal EITC. Refundable portion of the credit would have been limited to the amount of revenues generated by a proposed income tax surcharge.
|
|
2011–12
|
AB 1974 (Dickinson)
|
Fully refundable credit equal to 15 percent of the amount of the filer’s federal EITC.
|
|
2013–14
|
SB 1189 (Liu)
|
Nonrefundable credit equal to 15 percent of the amount of the filer’s federal EITC.
|
Were the state to enact an EITC, its design would depend on the state’s overarching policy goals for the credit. Below, we outline some possible policy goals for the Legislature’s consideration and describe the key decision points in designing a state EITC to meet one or another policy goal.
The goals of a potential state EITC would presumably align with the federal program’s goals of alleviating poverty and encouraging work. The state could also consider additional policy objectives. Below, we describe three possible policy objectives.
- Encourage Work. As mentioned earlier, the federal EITC appears to noticeably increase participation in paid work among single mothers. There is an argument that encouraging work is a legitimate policy goal in its own right. Work experience enables people to develop the skills, habits, and connections that can help them eventually move into higher–paying jobs, and this is especially valuable for EITC recipients who tend to be young.
- Supplement Resources of Working Families at Specific Income Levels. The federal EITC is widely understood as an antipoverty program, and as mentioned earlier the evidence suggests that poverty (however measured) would be higher without it.
- Fill In Perceived Gaps in the Federal EITC. By design, the federal EITC provides a much bigger benefit for households with children under the age of 18 than it does for childless singles or couples. If state policymakers view this disparity as inappropriate, they could focus a state EITC on childless adults.
Relationship to Federal Credit. Most states use the federal EITC as a starting point and set up their own EITCs as a flat percentage of the taxpayer’s federal credit amount. This is administratively simple, as it often adds just a single line to the state’s tax return with no need for the new forms that are usually required for new state tax credits or deductions. These state credits are restricted to people who actually took the federal credit, so the state does not have to set up a separate process to determine whether taxpayers are eligible for the credit. One downside is that if the state conforms to the federal EITC, it foregoes the possibility of designing a credit more specifically tailored to the state’s policy goals. For example, the federal EITC is restricted to people who have valid Social Security numbers. If the Legislature wished to provide benefits to residents who do not have Social Security numbers, it would not be able to simply piggyback on the federal credit.
Refundability. Some states offer nonrefundable credits that cannot reduce a taxpayer’s liability below zero. Under a nonrefundable credit, only those filers whose liability in the absence of the EITC would be greater than zero would be eligible for the EITC at all. The advantage of a nonrefundable state credit is that it is far easier to administer. It would lead to a lower number of new state returns than a refundable credit would, as eligibility would be restricted to people who are already required to file a state return. The disadvantage of a nonrefundable credit is that it would reach only the highest–income people who are currently eligible for the federal EITC.
Because of the design of California’s income tax, a nonrefundable credit would have essentially no impact here. State tax rates applicable to the lowest brackets of taxable income are very low: for a single parent who files as a head of household, the first $15,508 of income (after subtracting out the standard or itemized deductions) is taxed at just 1 percent and the next $21,235 at just 2 percent. On top of that, any tax liability computed that way is reduced by the state’s personal exemption credits of $108 for each adult and $333 for each dependent child. As a result, the population of single parents who both qualify for the federal EITC and have any state income tax liability is limited to people with just one dependent child who make between $37,788 and $38,511. Moreover, single parents within this narrow income range have state tax liabilities of less than $15 per year. The situation is similar for childless adults and for couples with children. Because a nonrefundable credit would benefit such a narrow range of people and for such a small amount, we do not believe that it merits consideration.
Total Level of Funding. A state EITC would affect the state’s budget just as any other spending program or tax credit or deduction does. One decision point would be how much money the state wished to commit to a state EITC. For any given dollar amount the state is willing to commit to an EITC, the state faces a trade–off between the number of people that would benefit from an EITC and the size of the benefit that each recipient could get. Whatever EITC structure the state chose, it could be modified initially or over time to fit within a target funding amount consistent with legislative priorities and available budgetary resources.
Target Populations. As discussed above, the state could deviate from the federal EITC structure if it wants to target the benefits in a different way. For example, the state could enact a state EITC that would modify the federal EITC’s disparities in benefits between parents and childless workers. The state could also potentially target benefits to workers at particular earnings levels.
The decision points discussed above could lead to many different possible structures for a state EITC, and its eventual form would depend on the Legislature’s priorities and objectives. To facilitate the Legislature’s consideration of priorities, we provide three potential state EITC options that are tied to different broad policy goals as described above.
Comparison Criteria. To illustrate the benefits, costs, and trade–offs of these different options, we compare the options using the following criteria:
- What Is the Potential for Direct Poverty Reduction? We provide estimates of the number of individuals that would be removed from poverty by each of the options. These estimates, as noted previously, account only for the direct effect of the additional resources provided to households through the state EITC options and exclude any potential changes in earnings resulting from changes in the number of hours worked. As a result, these estimates understate the full poverty reduction of each option. For more information on our estimation methodology and its limitations, see Appendix 2.
- What Are Potential Effects on Work Incentives? We discuss how each of the options would affect the way that low–income households’ total resources change as they increase their work participation. We focus on common incremental changes in work participation, such as moving from no employment to working 20 hours per week, or moving from 20 hours per week to 40 hours per week.
- What Is the Potential Administrative Burden? We describe, at a high level, how the different options compare in terms of complexity and administrative burden both for the state and for eligible tax filers. We also provide estimates of total administrative costs developed by the Franchise Tax Board (FTB). We note that in preparing these estimates FTB has assumed that it would be required to perform robust fraud and error prevention, outreach, and education activities for each option. Estimates provided by FTB appear reasonable and consistent with activities in other states, but the amount of focus FTB assumes for these activities may differ from the Legislature’s priorities.
- What Is the Revenue Loss for the State? Finally, we provide an estimate of the potential revenue loss that would result from implementing each of these options. Our estimates reflect federal EITC data from 2012. For discussion of how these revenue losses could change in later years, see the nearby box entitled “Projecting the Future Revenue Loss of a State EITC.” We also note that the state has choices for how to treat these revenue losses in its budgetary accounting system, which may have implications for school funding under Proposition 98, as described in the box below, entitled “Effects of Revenue Losses on Proposition 98.”
Were a state earned income tax credit (EITC) to take effect in 2015 or a later year, the budget impact could be higher or lower than the estimates shown in the main text, which were based on tax year 2012 data. The revenue loss of a state EITC would likely increase over time, but it would depend on several factors, as described below.
- Minimum Wage Increases. California’s statewide hourly minimum wage increased from $8 to $9 at the start of 2014, and will increase again to $10 at the start of 2016. As mentioned earlier in the section entitled “Interaction With Other Antipoverty Policies,” the impact on the total revenue loss of the federal EITC would be uncertain. At the state level, the impact of the minimum wage change on the revenue loss of option 1 would likewise be uncertain. Because options 2 and 3 phase out much more quickly than option 1, it is likely that this minimum wage increase would move filers into the phase–out ranges, further down the phase–out ranges, or above the eligibility limits for these options, thus reducing the potential revenue loss.
- Changes in the Economy. The size of the federal EITC program (the number of recipients and the total revenue loss) has typically grown over time, even during periods when the EITC itself was not expanded. The total number of jobs in the state also typically grows over time, and some of the new jobs will pay wages that qualify employees for the EITC. This pattern is not constant from year to year. Going forward, both the net change in the number of lower–paying jobs and the wages paid by these jobs are uncertain.
- Inflation. The size of a taxpayer’s federal EITC benefit is indexed to inflation, meaning that it rises or falls every year with the change in an estimated price index. Assuming that a state EITC were also indexed for inflation, this would tend to increase the overall revenue loss of the EITC every year.
“Revenue Losses.” In this report we discuss the potential state personal income tax revenue losses if a state earned income tax credit (EITC) were to be approved. Specifically, revenue losses in this report refer to the amount of credits that would benefit state EITC filers. Most of these credits would be refundable; that is, the tax credit would be applied first to any income taxes due from the EITC filer, with the balance paid directly to the filer, essentially as an income tax refund. As discussed below, however, revenue losses need not be booked on the revenue side of the state budget. Choices in this regard could mean a state EITC affects the Proposition 98 minimum funding guarantee for schools and community colleges in different ways.
Effects if Booked on Revenue Side of the Budget. If, for example, the revenue losses from a state EITC were booked on the revenue side of the budget—that is, as a net reduction of personal income tax revenues deposited in the General Fund—this would tend to result in a reduction of the Proposition 98 minimum guarantee. That is because year–over–year growth in state revenues is one factor that drives the Proposition 98 minimum guarantee upward in certain years. If a state EITC resulted in slower growth in state revenues in one or more years, that would tend to reduce the Proposition 98 guarantee below what it would be otherwise. In general, state income tax credits—currently, virtually all of them nonrefundable credits—are booked on the revenue side of the budget in this manner.
Effects If Booked on Expenditure Side of the Budget. Alternatively, the state could book the revenue losses from a state EITC on the expenditure side of the budget—essentially as an appropriation of state General Fund moneys to EITC filers each year. Precedent exists for this type of treatment. In the past, certain refundable tax credits have been booked as appropriations in Item 9100 of the annual state budget (Tax Relief). One such example was the prior refundable renters’ personal income tax credit. Under current budgetary conventions, treating the state EITC as an annual appropriation generally would avoid the revenue interactions with Proposition 98 described above.
Options as Building Blocks. While each of the options discussed below could be implemented as presented, we note that it is more helpful to think of these options as building blocks that could be mixed, matched, and modified to meet the Legislature’s policy objectives. As we describe the options, we also give examples of ways the options could be altered.
As noted above, one possible policy goal for a state EITC is to strengthen incentives to work by increasing the return from work at low wages. The first option we present would magnify the existing work incentives and disincentives (encouraging or discouraging work depending on the taxpayer’s income) created by the federal EITC by piggybacking on the federal credit’s design. Specifically, this option represents a fully refundable state EITC that would be equal to 15 percent of the federal EITC, consistent with past legislative proposals. The amount of this state EITC option for different levels of annual earned income is displayed in Figure 8.
Poverty Reduction. We estimate that roughly 10.3 million Californians were in households that would have benefited from this option in 2012 if it had been available. Of those benefiting from this option, we estimate that the additional resources provided would move roughly 120,000 individuals out of poverty (above 100 percent of the SPM poverty threshold). This is equivalent to a 0.32 percentage point reduction in the state’s SPM poverty rate. Figure 9 displays the estimated number of individuals moved above other multiples of the SPM poverty threshold.
Figure 9
Option 1: Piggyback on Federal Credit
Poverty Impacts in 2012
|
Number of Individuals in
Households Receiving State EITC
|
10,325,000
|
|
Number of Individuals Moved Above:
|
|
|
50 percent of SPM poverty threshold
|
43,750
|
|
100 percent of SPM poverty threshold
|
120,750
|
|
150 percent of SPM poverty threshold
|
44,000
|
|
200 percent of SPM poverty threshold
|
14,050
|
Changes to Work Incentives. Option 1 piggybacks on the federal credit, so the incentive to work over the phase–in range increases, the incentive to work over the flat range stays the same, and the disincentive to work over the phase–out range also increases. As shown in Figure 10, option 1 increases the effective hourly wage that a single filer with two dependent children would receive when moving from no work to working 20 hours per week by 63 cents. This represents an increased incentive to work. Option 1 would also increase the effective hourly wage when moving from no work to working 40 hours per week or when moving from working 20 hours per week to 40 hours a week, but by smaller amounts.
Figure 10
Option 1: Piggyback on Federal Credit
Changes in Work Incentives for a Single Filer With Two Dependent Children
|
Weekly Hours of Work
|
|
Average Effective Hourly Wage
|
|
Before
|
After
|
With Federal EITC Only
|
With Federal And State EITC
|
Change
|
|
0
|
20
|
|
$9.56
|
$10.19
|
+$0.63
|
|
20
|
40
|
|
4.23
|
4.32
|
+0.09
|
|
0
|
40
|
|
6.90
|
7.25
|
+0.35
|
Administrative Burden. Of the three options we present in this report, option 1 is conceptually the simplest to administer. Because the amount of the state credit would be equal to a specific percentage of the federal credit, the state could ask for very little additional information from filers beyond the amount of their federal EITC. Some states (such as Michigan) simply add lines to their income tax form for the filer to list his or her federal EITC amount and then calculate the state EITC amount by applying the appropriate percentage. Other states (such as New York) require filers to submit much of the same information as is required for the federal EITC, including earnings from wages and self–employment and identification and ages of dependents. The administrative costs to the state of California for option 1 would depend to some extent on how much information the state required filers to provide.
In any case, a state EITC consistent with option 1 would result in an increased number of income tax returns, as many individuals who would be eligible for it are not currently required to file. All individuals who are eligible for the federal EITC would be eligible for this option. However, we assume that only 90 percent of individuals who claim the federal EITC would choose to file for the state EITC. Most federal EITC recipients are not required to file state tax returns because their taxable income is so low, and many would likely not be aware of the new state EITC especially in the first few years. Were the credit available in 2012, we estimate that 2.9 million state EITC claims would have been filed. The FTB estimates that its costs for administering a state EITC broadly consistent with option 1 would be $20.1 million, including $3.4 million for processing, $13 million for enforcement activities, and $3.7 million for education and outreach.
Revenue Loss. Had a state EITC consistent with option 1 been available in tax year 2012, we estimate that this credit would have resulted in reduced personal income tax revenue of roughly $1 billion.
Potential Modifications. The choice of what percentage of the federal EITC to match under a piggybacked option is somewhat arbitrary. For example, if the state EITC were to match 30 percent of the federal EITC, we estimate that the number of individuals moved out of poverty would be roughly 250,000 (an SPM poverty rate reduction of about 0.7 percentage points). Associated changes in work incentives and disincentives would roughly double, as would the estimated revenue loss ($2 billion in 2012). In general, we estimate that the state’s revenue loss in 2012 would have been around $65 million for each additional percent of the federal EITC that is matched by the state EITC.
As noted previously, the state could choose to focus resources on individuals and families at certain income levels. One example would be to focus the benefits of a state EITC on those families that have the very lowest incomes. Option 2 would accomplish this by matching the federal EITC dollar for dollar for all annual earnings up to about one–half of the level required to obtain the maximum federal EITC benefit (in other words, halfway through the phase–in range). For a single parent with two dependents in tax year 2014, this would be $6,825 in annual earned income, as the federal phase–in range ends at $13,650. Option 2 would then phase out at the same rate, such that the state credit would fully phase out just as the maximum federal EITC benefit is reached. The amount of this state EITC for different levels of annual earned income is displayed in Figure 11. As the figure shows, the practical effect of this option is to make the phase–in range of the combined federal and state EITCs steeper, such that the maximum benefit is reached earlier and the flat range is longer, benefitting individuals and families with earnings in the federal phase–in range. (This structure allows for the state credit to phase out while the federal credit is still phasing in.)
Poverty Reduction. We estimate that roughly 2.7 million Californians were in households that would have benefitted from this option in 2012. We estimate that these additional resources would have moved roughly 45,000 individuals out of poverty (above 100 percent of the SPM poverty threshold). This is equivalent to a reduction in the state’s SPM poverty rate of 0.12 percentage points. Figure 12 displays the estimated number of individuals moved above other multiples of the SPM poverty threshold.
Figure 12
Option 2: Focus on Working Families With Lowest Incomes
Poverty Impact in 2012
|
Number of Individuals in Households Receiving State EITC
|
2,675,000
|
|
Number of Individuals Moved Above:
|
|
|
50 percent of SPM poverty threshold
|
56,250
|
|
100 percent of SPM poverty threshold
|
45,250
|
|
150 percent of SPM poverty threshold
|
6,200
|
|
200 percent of SPM poverty threshold
|
3,575a
|
Changes to Work Incentives. Much like the federal EITC, option 2 would strengthen work incentives over its phase–in range but reduce them over its phase–out range. Specifically, for the hypothetical household consisting of a single parent and two dependent children, option 2 significantly increases the take–home resources made available when transitioning from no work to part–time work at $10 per hour, as shown in Figure 13. This increase in work incentives, however, would be reversed for a similar parent transitioning from part–time to full–time work (as the credit is phased out). Because option 2 fully phases out at a level of earnings below the equivalent of a full–time job at $10 per hour, individuals moving from no work to full–time work miss the benefit of this credit entirely and would experience no change to their incentives.
Figure 13
Option 2: Focus on Working Families With Lowest Incomes
Changes in Work Incentives for a Single Filer With Two Dependent Children
|
Weekly Hours of Work
|
|
Average Effective Hourly Wage
|
|
Before
|
After
|
With Federal EITC Only
|
With Federal and And State EITC
|
Change
|
|
0
|
20
|
|
$9.56
|
$10.66
|
+$1.10
|
|
20
|
40
|
|
4.23
|
3.13
|
–1.10
|
|
0
|
40
|
|
6.90
|
6.90
|
No change
|
Administrative Burden. Conceptually, option 2 would likely be administratively more burdensome for the state and for filers because credit amounts would be determined by a separate state schedule. This might require that the state request additional information from filers or require that filers perform additional calculations. However, because fewer filers would be eligible for option 2, the total administrative costs would be lower than the costs to administer option 1. Unlike option 1, most tax filers who qualify for the federal EITC (those with higher incomes) would not qualify for option 2. We estimate that roughly 785,000 tax filers would have been eligible for option 2 had it been available in 2012. We assume that 90 percent of these, or roughly 700,000, would have actually filed for the credit. The FTB estimates that administering a state EITC that is broadly consistent with option 2 would cost $7.1 million annually, including $2.3 million for processing, $3.8 million for enforcement activities, and $1 million for education and outreach. The average administrative cost of option 2 would be about $10 per return compared to about $7 per return for option 1.
Revenue Loss. Had a state EITC consistent with option 2 been available in tax year 2012, we estimate that this credit would have resulted in reduced personal income tax revenue of roughly $450 million.
Potential Modifications. Depending on available resources, the Legislature could consider enacting a state EITC similar to option 2 but with a smaller benefit amount. For example, if option 2 were reduced by half, we estimate that the number of individuals moved out of poverty would be roughly 20,000, for an SPM poverty rate reduction of 0.05 percentage points. Associated changes to work incentives and disincentives would be reduced roughly by half, as would the estimated revenue loss ($220 million). Alternatively, if the Legislature wished to focus on families with the lowest incomes but also encourage full–time work, it could create a hybrid between options 1 and 2 that would, in addition to building on the federal EITC over the phase–in range, increase the maximum benefit provided by the federal EITC through the flat range. The Legislature could also consider focusing resources on families with higher earnings, which could partially offset work disincentives created by the federal EITC as its benefits are phased out.
As noted previously, the Legislature may wish to enact a state EITC that would compensate for perceived gaps in the federal EITC. In March 2014, the Obama administration released a proposal to increase the federal EITC for filers with no dependents. (There have also been other congressional proposals of this type.) Under the administration’s proposal, the phase–in rate and maximum benefit for filers with no dependents would roughly double and the maximum amount of annual earned income allowed to still receive the federal EITC would be increased by over $2,000. Option 3 would create a state EITC that, when combined with the existing federal EITC, would equal the expanded federal EITC for filers with no dependents, as proposed by the President. Figure 14 displays the amount of this state EITC for different levels of annual earned income. As can be seen in the figure, option 3 would be available only to filers with no dependents.
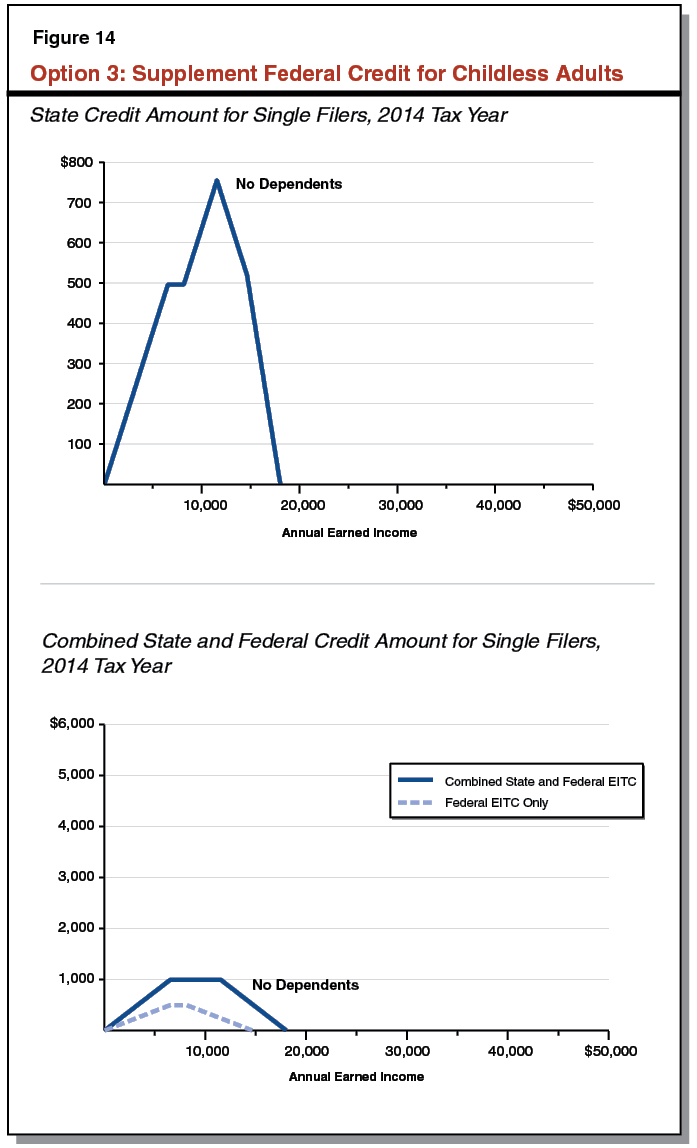
Poverty Reduction. We estimate that roughly 3.2 million Californians would have benefitted from this option in 2012. We estimate these additional resources would have moved roughly 21,000 individuals out of poverty (above 100 percent of the SPM poverty threshold). This is equivalent to a reduction in the state’s SPM poverty rate of 0.06 percentage points. Figure 15 displays the estimated number of individuals moved above other multiples of the SPM poverty threshold.
Figure 15
Option 3: Supplement Federal Credit for Childless Adults
Poverty Impacts in 2012
|
Number of Individuals in Households Receiving State EITC
|
3,200,000
|
|
Number of Individuals Moved Above:
|
|
|
50 percent of SPM poverty threshold
|
28,500
|
|
100 percent of SPM poverty threshold
|
21,000
|
|
150 percent of SPM poverty threshold
|
20,425
|
|
200 percent of SPM poverty threshold
|
12,425a
|
Changes to Work Incentives. As with the previous options, option 3 would strengthen work incentives over its phase–in range but reduce them over its phase–out range. Specifically, for a household consisting of a single individual with no dependents, option 3 increases the take–home resources made available when transitioning from no work to part–time work, as shown in Figure 16. This increase in work incentives is reversed for a similar single individual transitioning from part–time to full–time work (as the credit phases out). Because option 3 fully phases out below the level of earnings that are equivalent to a full–time job at $10 per hour, individuals moving from no work to full–time work would miss the benefit of this credit entirely and would experience no change to their incentives.
Figure 16
Option 3: Supplement Federal Credit for Childless Adults
Changes in Work Incentives for a Single Filer With No Dependent Children
|
Weekly Hours of Work
|
|
Average Effective Hourly Wage
|
|
Before
|
After
|
With Federal
EITC Only
|
With Federal
And State EITC
|
Change
|
|
0
|
20
|
|
$9.46
|
$10.14
|
+$0.68
|
|
20
|
40
|
|
4.12
|
3.44
|
–0.68
|
|
0
|
40
|
|
6.79
|
6.79
|
No change
|
Administrative Burden. Similar to option 2, option 3 would be more burdensome to administer than option 1 because it would rely on a separate state credit schedule and may require that filers provide additional information and perform additional calculations. However, also similar to option 2, fewer filers would be eligible for option 3 than for option 1 and as such overall administrative costs would be lower than for option 1. Unlike the previous two options, some tax filers who do not qualify for the federal EITC would qualify for this state EITC—specifically, filers with no dependents and with earned income just above the current maximum income allowed for the federal EITC. We estimate that roughly 1 million tax filers would have been eligible for option 3 had it been available in 2012. We assume that 90 percent of these, or roughly 900,000, would have actually filed for the credit. The FTB estimates that administering a state EITC that is broadly consistent with option 3 would cost about $13.8 million annually, including $2.1 million for processing, $10.3 million for enforcement activities, and $1.4 million for education and outreach efforts. This works out to a cost of about $15 per return.
Revenue Loss. Had a state EITC consistent with option 3 been available in tax year 2012, we estimate that this credit would have resulted in reduced personal income tax revenue of roughly $400 million.
Potential Modifications. Although option 3 would increase the maximum amount of earnings a filer with no children could have and still claim the EITC, option 3 would still be fully phased out before reaching earnings equivalent to working full–time at $10 per hour. If the Legislature wished to increase incentives to work up to full–time at low wages, it could consider a variant of option 3 that would extend the flat region such that it phased out at the same level of earnings as the federal EITC for filers with dependents. We estimate that this variation would dramatically increase the number of eligible filers (to about 1.3 million) and also increase revenue loss (to roughly $700 million) and the number of individuals moved above SPM poverty thresholds (to roughly 70,000).
The Legislature could consider focusing resources of a state EITC on noncustodial parents, who are considered childless adults for purposes of the federal EITC. For example, New York State provides an EITC that piggybacks on the federal EITC in most respects. Under a straight piggyback credit, noncustodial parents would be eligible for a very small state EITC benefit (matching a percentage of the small benefit provided through the federal EITC). However, New York’s state EITC offers noncustodial parents who are current on their child support obligations the option of claiming the state EITC as if they had custody of their children, which provides a higher benefit. (Noncustodial parents use the same EITC schedule as custodial parents do, but get a lower percentage of the federal credit.) This encourages these parents to work and to keep current on their child support obligations, potentially fostering improved relationships between noncustodial parents and their children. The costs and potential poverty impacts of such an option in California would depend on how the credit is structured.
Figure 17 summarizes key features of the three options described above.
Figure 17
Summary of LAO Options
|
|
Option 1:
Piggyback on Federal Credit
|
Option 2: Focus on
Working Families With
Lowest Incomes
|
Option 3: Supplement
Federal Credit for
Childless Adults
|
|
Direct Poverty Impact
|
|
|
|
|
Individuals moved above SPM poverty threshold
|
120,750
|
45,250
|
21,000
|
|
Change in SPM poverty rate
|
–0.32%
|
–0.12%
|
–0.06%
|
|
Estimated 2012 Revenue Loss
|
$1 billion
|
$450 million
|
$400 million
|
|
Change in Work Incentive
|
|
|
|
|
Currently not working and considering 20 hours per weeka
|
+$0.62/hour
|
+$1.10/hour
|
+$0.68/hour
|
|
Currently not working and considering 40 hours per weekb
|
+$0.35/hour
|
None
|
None
|
Assessment of Trade–Offs. As noted above, the structure of any state EITC adopted in California will depend on the policy goals the Legislature wishes to achieve. While various options can meet multiple policy goals, some options are suited to particular goals. For example, option 1 is well–suited to address goals of strengthening work incentives and providing increased resources to low–income working families. One drawback of option 1 is that it distributes significant resources to a large number of individuals and families, such that providing a given benefit to all eligible individuals results in a relatively higher revenue loss. Option 1 also does not address concerns about the amount of assistance received by filers without dependents. Option 2 is more focused than option 1 and is well–suited to provide additional resources to working families with the very lowest incomes. Focusing the resources provided by a state EITC more narrowly allows for a more substantial benefit to be provided to fewer people. At the same time, providing benefits to fewer households limits the number of individuals moved above poverty thresholds. Option 2 encourages part–time work more than option 1, but does not encourage full–time work, as option 1 does. Option 3 addresses potential concerns about the low federal EITC received by filers with no dependents. Because option 3 is more focused, a more substantial benefit can be provided to fewer people. As with option 2, the number of individuals moved out of poverty may be more limited. Option 3 is also relatively less effective at strengthening incentives to work full–time, unless it is modified as discussed above.
Assessment of Trade–Offs. As noted above, the structure of any state EITC adopted in California will depend on the policy goals the Legislature wishes to achieve. While various options can meet multiple policy goals, some options are suited to particular goals. For example, option 1 is well–suited to address goals of strengthening work incentives and providing increased resources to low–income working families. One drawback of option 1 is that it distributes significant resources to a large number of individuals and families, such that providing a given benefit to all eligible individuals results in a relatively higher revenue loss. Option 1 also does not address concerns about the amount of assistance received by filers without dependents. Option 2 is more focused than option 1 and is well–suited to provide additional resources to working families with the very lowest incomes. Focusing the resources provided by a state EITC more narrowly allows for a more substantial benefit to be provided to fewer people. At the same time, providing benefits to fewer households limits the number of individuals moved above poverty thresholds. Option 2 encourages part–time work more than option 1, but does not encourage full–time work, as option 1 does. Option 3 addresses potential concerns about the low federal EITC received by filers with no dependents. Because option 3 is more focused, a more substantial benefit can be provided to fewer people. As with option 2, the number of individuals moved out of poverty may be more limited. Option 3 is also relatively less effective at strengthening incentives to work full–time, unless it is modified as discussed above.
State Would Have to Determine Appropriate Level and Focus of Enforcement Efforts. As described above, the level of improper payments in the federal EITC is a significant issue. Were the state to adopt its own EITC, it would need to dedicate some resources to reducing improper payments from taxpayer errors or fraud. However, it is not possible to completely eliminate improper payments in a state EITC because there is an inherent trade–off between dollars saved through enforcement efforts and dollars spent to finance those activities. The state ultimately might wish to consider what an acceptable level of improper payments would be and how to focus enforcement funds and activities to achieve that goal.
EITC Enforcement Activities in Other States. In the course of preparing this report, we discussed enforcement activities with officials of agencies in some states that currently administer EITCs. Across these states, certain aspects of enforcement efforts were common. For example, the states focused more on preventing improper payments before they happen than on recovering them after sending them out. Common preventive measures include (1) real–time verification of some information with available electronic sources (such as Social Security numbers with the federal Social Security Administration) and (2) stopping payment of refunds in cases where the claims have a high likelihood of containing errors until the claim can be verified. For example, the states we spoke with have developed methodologies to flag claims that fit certain criteria that would indicate higher likelihood of a common error, such as reporting self–employment income in an amount that provides the maximum EITC benefit.
The level of enforcement activity varies somewhat across states (due to differences in priorities, relative values of those states’ EITC benefits, and the number of claims that are processed). For example, the state of Minnesota, which had 355,000 federal EITC recipients in 2012 compared to 3.2 million in California, reports that they devote 12 full–time enforcement staff to EITC enforcement during the peak season. New York State, which processes about 1.6 million state EITC claims, reports that during peak season they have well over 100 staff devoted to enforcement activities.
Options for Limiting Improper Payments. In addition to the activities described above, the Legislature could consider other options to structure a state EITC to reduce the level of improper payments.
- Restrict to Wage Income. As mentioned above, the IRS estimates that the cost of improper payments due to misreporting self–employment income is three to four times as large as for wage income, despite the fact that total reported wage income on all EITC returns is more than eight times the amount of total reported self–employment income. If policymakers view fraud prevention as a major concern, they could consider restricting an EITC to wage income. This would have some drawbacks. By adopting a different definition of income than the federal EITC, the state would lose the simplicity of piggybacking on the federal credit. A wage–only EITC would also be detrimental to individuals with legitimate self–employment income. On the other hand, a wage–only EITC would likely reduce the level of enforcement staff for EITC fraud prevention. The FTB estimates that restricting an EITC to wage income would reduce the associated administrative costs by about 10 percent. The tax revenue loss from a wage–only EITC would likely be about 10 percent smaller than a comparable EITC that also covers self–employment income, as self–employment income accounts for 11 percent of federal EITC recipients’ earned income.
- Delay Payment Until More Administrative Data Are Available for Verification. One challenge the state may face in limiting improper payments is the need to balance timely refunds against the lag in availability of some administrative data that could be helpful in enforcement efforts. For example, wage information reported to the state as part of the Unemployment Insurance program could be used as a check on the wage information reported by state EITC claimants, but this information would likely not be available early enough in the year to allow it to be used for enforcement purposes. The information resulting from IRS enforcement efforts is also not available early enough to be used in processing refunds. The state could consider delinking a state EITC from the income tax return, and provide the benefit as a rebate at a later time. The State of Washington, which has no state income tax, has approved (but not funded) a state EITC that is expected to function in a similar way.
The IRS estimates that in 2010, only 71 percent of California tax filers who qualified for the federal EITC claimed it. The state has pursued some efforts in the past to increase participation in the federal EITC, including enacting requirements that employers and state departments that interact with low–income workers inform them at least annually that they may be eligible for the federal EITC and provide information on how to claim the credit. Enacting a state EITC may further increase awareness of the federal EITC and increase participation on the natural. If a state EITC is enacted, the Legislature could consider whether additional activities are warranted to promote participation and maximize the credit’s effects.
The federal EITC is a large antipoverty program. It reduces poverty and generally encourages work, particularly among low–wage and low–skilled single parents. Were the state to adopt a supplemental EITC structured similarly to the federal EITC, it likely would have similar effects. The Legislature would have many decisions to make and trade–offs to consider in crafting a state EITC to meet its policy objectives, including how closely to link a state credit to the federal EITC and whether to focus the benefit broadly or narrowly. Should the state enact an EITC, it may wish to consider ways to limit improper payments.
In the development of this report we consulted with various organizations, listed below. Our analysis and findings are our own.
- California Budget Project.
- California Taxpayers Association.
- Center on Budget and Policy Priorities.
- County Welfare Directors Association of California.
- Franchise Tax Board.
- Michigan Senate Fiscal Agency.
- Minnesota Department of Revenue.
- Minnesota House of Representatives Research Department.
- National Conference of State Legislatures.
- New York State Senate Finance Committee.
- New York State Department of Taxation and Finance.
- Office of the Chief Financial Officer of the District of Columbia.
- Public Policy Institute of California.
- University of California Davis Center for Poverty Research.
- Western Center on Law and Poverty.
Data Sources. Throughout this report, we present estimates of the number of individuals moved out of poverty assuming the enactment of different options for a state earned income tax credit (EITC). To develop these estimates, we used Supplemental Poverty Measure (SPM) Public Use Research Files from 2010 through 2013 and the Current Population Survey Annual Social and Economic Supplement, both made available by the U.S. Census Bureau. These data sources provide detailed survey information on a sample of between 5,300 and 7,400 California households each year from 2010 through 2013 (about 27,000 households total). These data sources also include Census Bureau calculations used to determine the SPM poverty status of each household, including calculations of the household’s SPM poverty threshold and total resources that are compared against that threshold.
General Steps in Methodology. The general steps in our methodology are as follows:
- Estimate Federal EITC Benefit. The datasets include an estimate of each household’s federal EITC benefit; however, the intermediate values used to develop these estimates are not publicly available. In order to be consistent in how estimates were developed across all state EITC options and the federal EITC, we used information available in the datasets to approximate federal EITC benefits calculated by the Census Bureau. When comparing numbers of returns, total benefits, and poverty impacts, our approximation is close to the Census Bureau estimates.
- Estimate State EITC Benefit. We then used the same information to estimate the amount of state EITC each household would receive under the various options.
- Adjust SPM Resources to Include State EITC. We then added the total state EITC benefit received by members of each household to the other resources that are measured against the household’s SPM poverty threshold.
- Count the Number of Individuals That Move Above Poverty Threshold. Once the state EITC benefit is assigned, some households cross over poverty thresholds. We counted the number of individuals in each of these households to arrive at a number of individuals moved out of poverty.
Detailed Estimation Results. Appendix Figure 1 provides the detailed results of our estimation.(Confidence intervals were calculated using replicate weights provided by the Census Bureau.)
Appendix Figure 1
Detailed Poverty Estimates
|
|
Federal EITC
|
|
State EITC
|
|
As Estimated by
U.S. Census Bureau
|
As Estimated
By LAO
|
Option 1
|
Option 2
|
Option 3
|
|
Individuals Moved Above 50 Percent of SPM Threshold
|
|
|
|
|
|
|
|
Number
|
362,500
|
372,500
|
|
43,750
|
56,250
|
28,500
|
|
90 percent confidence interval
|
+/–44,004
|
+/–44,826
|
|
+/–17,519
|
+/–19,082
|
+/– 9,582
|
|
Percent of California population
|
0.96%
|
0.99%
|
|
0.12%
|
0.15%
|
0.08%
|
|
90 percent confidence interval
|
+/–0.12%
|
+/–0.12%
|
|
+/–0.05%
|
+/–0.05%
|
+/–0.03%
|
|
Individuals Moved Above 100 Percent of SPM Threshold
|
|
|
|
|
|
|
|
Number
|
760,000
|
752,500
|
|
120,750
|
45,250
|
21,000
|
|
90 percent confidence interval
|
+/–74,025
|
+/–69,090
|
|
+/–26,114
|
+/–17,067
|
+/–7,567
|
|
Percent of California population
|
2.02%
|
1.99%
|
|
0.32%
|
0.12%
|
0.06%
|
|
90 percent confidence interval
|
+/–0.20%
|
+/–0.18%
|
|
+/–0.07%
|
+/–0.05%
|
+/–0.02%
|
|
Individuals Moved Above 150 Percent of SPM Threshold
|
|
|
|
|
|
|
|
Number
|
235,750
|
248,750
|
|
44,000
|
6,200
|
20,425
|
|
90 percent confidence interval
|
+/–41,948
|
+/–43,593
|
|
+/–15,175
|
+/–5,017
|
+/–8,883
|
|
Percent of California population
|
0.62%
|
0.66%
|
|
0.12%
|
0.02%
|
0.05%
|
|
90 percent confidence interval
|
+/–0.11%
|
+/–0.12%
|
|
+/–0.04%
|
+/–0.01%
|
+/–0.02%
|
|
Individuals Moved Above 200 Percent of SPM Threshold
|
|
|
|
|
|
|
|
Number
|
41,000
|
42,250
|
|
14,050
|
3,575a
|
12,425a
|
|
90 percent confidence interval
|
+/–14,682
|
+/–15,710
|
|
+/–9,212
|
+/–3,549
|
+/–5,716
|
|
Percent of California population
|
0.11%
|
0.11%
|
|
0.04%
|
0.01%
|
0.03%
|
|
90 percent confidence interval
|
+/– 0.04%
|
+/–0.04%
|
|
+/–0.02%
|
+/–0.01%
|
+/–0.02%
|
|
Individuals in Affected Households
|
|
|
|
|
|
|
|
Number
|
10,275,000
|
10,325,000
|
|
10,325,000
|
2,675,000
|
3,200,000
|
|
90 percent confidence interval
|
+/–253,330
|
+/–259,499
|
|
+/–259,499
|
+/–143,938
|
+/–158,331
|
|
Percent of California population
|
27.22%
|
27.35%
|
|
27.35%
|
7.06%
|
8.45%
|
|
90 percent confidence interval
|
+/–0.68%
|
+/–0.70%
|
|
+/–0.70%
|
+/–0.38%
|
+/–0.42%
|
|
Individuals in Poverty
|
|
|
|
|
|
|
|
Number
|
8,844,250
|
8,852,750
|
|
8,732,000
|
8,807,500
|
8,831,750
|
|
90 percent confidence interval
|
+/–148,980
|
+/–148,980
|
|
+/–147,856
|
+/–149,502
|
+/–148,810
|
|
Percent of California population
|
23.43%
|
23.46%
|
|
23.14%
|
23.34%
|
23.40%
|
|
90 percent confidence interval
|
+/–0.65%
|
+/–0.65%
|
|
+/–0.65%
|
+/–0.65%
|
+/–0.65%
|
Limitations. Our methodology has some limitations, as described below.
- Major Public Assistance Benefits Are Underreported. The datasets feature reported survey data for various pieces of information, including earnings and receipt of public assistance. It has been shown that a significant portion (nearly half in some cases) of total benefits received through major programs like Temporary Assistance for Needy Families (known as California Work Opportunity and Responsibility to Kids in California) and the Supplemental Nutrition Assistance Program (known as CalFresh in California) are not reported in the data set. As a result, the SPM methodology that relies on these datasets overstates the extent of poverty by failing to account for these underreported benefits. Underreporting these other public benefits may result in our estimates of the poverty impact of the state EITC options being overstated, as some of whom that we estimate would be moved above the poverty threshold may already be above the threshold once underreported benefits are accounted for.
- Federal and State EITC Amounts Are Assigned Rather Than Reported. Unlike other major forms of public assistance, the federal EITC is not reported in the datasets. Rather, it is assigned based on what other reported information indicates the household would be eligible for. (All households that are determined to be eligible based on survey data are assumed to claim the EITC.) As discussed above, our approach for assigning state EITC benefits is similar. When comparing the numbers of returns and total credit amounts as determined by the datasets against administrative records of how many individuals actually received the federal EITC from the Internal Revenue Service (IRS), total credits claimed as calculated from the survey data understate the actual reported total credits by up to 21 percent. Appendix Figure 2 displays the total federal EITC credit amounts for California as calculated from the datasets when using the Census Bureau estimate of federal EITC amounts, when using the LAO estimate of federal EITC amounts, and actual credit amounts reported by IRS. This discrepancy can likely be attributed to a combination of (1) improper payments, (2) sampling error, and (3) errors in assigning federal EITC amounts in the survey data. The fact that the datasets consistently estimate total benefits below administrative totals for the federal EITC implies who our state EITC estimates likely understate their full poverty impact. We note that not all state income tax filers that are eligible for a state EITC will file, particularly in early years of implementation. This effect should somewhat offset the understatement of benefits observed in the dataset.
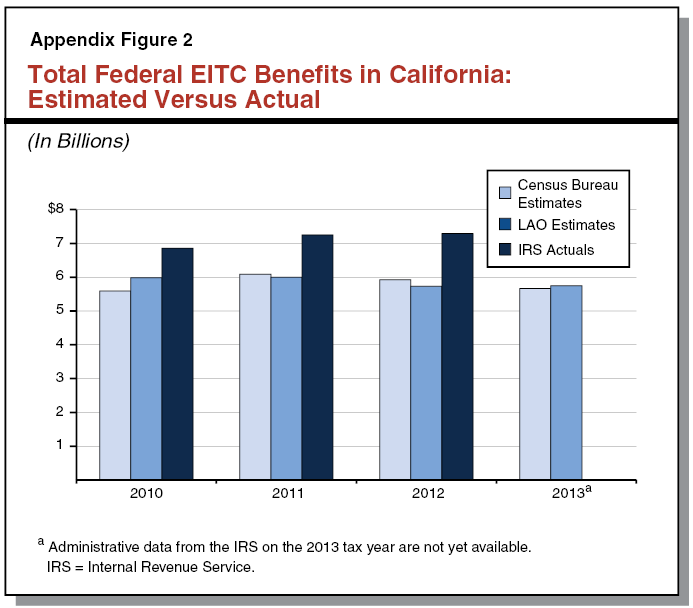
Caution Should be Used in Interpreting Estimates. Given the limitations described above, estimates of poverty impact for the various state EITC options are intended to provide a rough sense of the magnitude of potential effects in order to facilitate comparisons among competing policy options, but are subject to uncertainty and should be interpreted with caution.
This appendix lists some, but not all, of the resources we consulted in the course of preparing this report. These references link to more detailed information on the effects of the federal earned income tax credit (EITC) and the nature and extent of noncompliance in the federal EITC.
Dahl, G. and Lochner, L. (2012). The Impact of Family Income on Child Achievement: Evidence from the Earned Income Tax Credit. American Economic Review 2012, 102(5). http://econweb.ucsd.edu/~gdahl/papers/children–and–EITC.pdf
Eissa, N. and Hoynes, H. (2005). Behavioral Responses to Taxes: Lessons from the EITC and Labor Supply. National Bureau of Economic Research Working Paper. http://www.nber.org/papers/w11729.pdf
Hoynes, H., Miller, D., and Simon, D. (2012). Income, the Earned Income Tax Credit, and Infant Health. National Bureau of Economic Research Working Paper. http://www.nber.org/papers/w18206
Internal Revenue Service (2014). Compliance Estimates for the Earned Income Tax Credit Claimed on 2006–2008 Returns. http://www.irs.gov/pub/irs–soi/EITCComplianceStudyTY2006–2008.pdf
Meyer, B. (2010). The Effects of the Earned Income Tax Credit and Recent Reforms. In Tax Policy and the Economy, Volume 24 (2010). National Bureau of Economic Research. http://www.nber.org/chapters/c11973