California Teacher Compensation
The graphic below shows data for each of California’s 58 counties from 2000-01 through 2021-22. Adjust the slider at the top to change the year. Hover your mouse over a county to see its compensation broken down by salary and benefits. School districts and teacher unions typically negotiate compensation packages, with the graphic showing the average package offered by districts in a county. The benefits component includes health, dental, and vision coverage but excludes other benefits, most notably pension contributions.
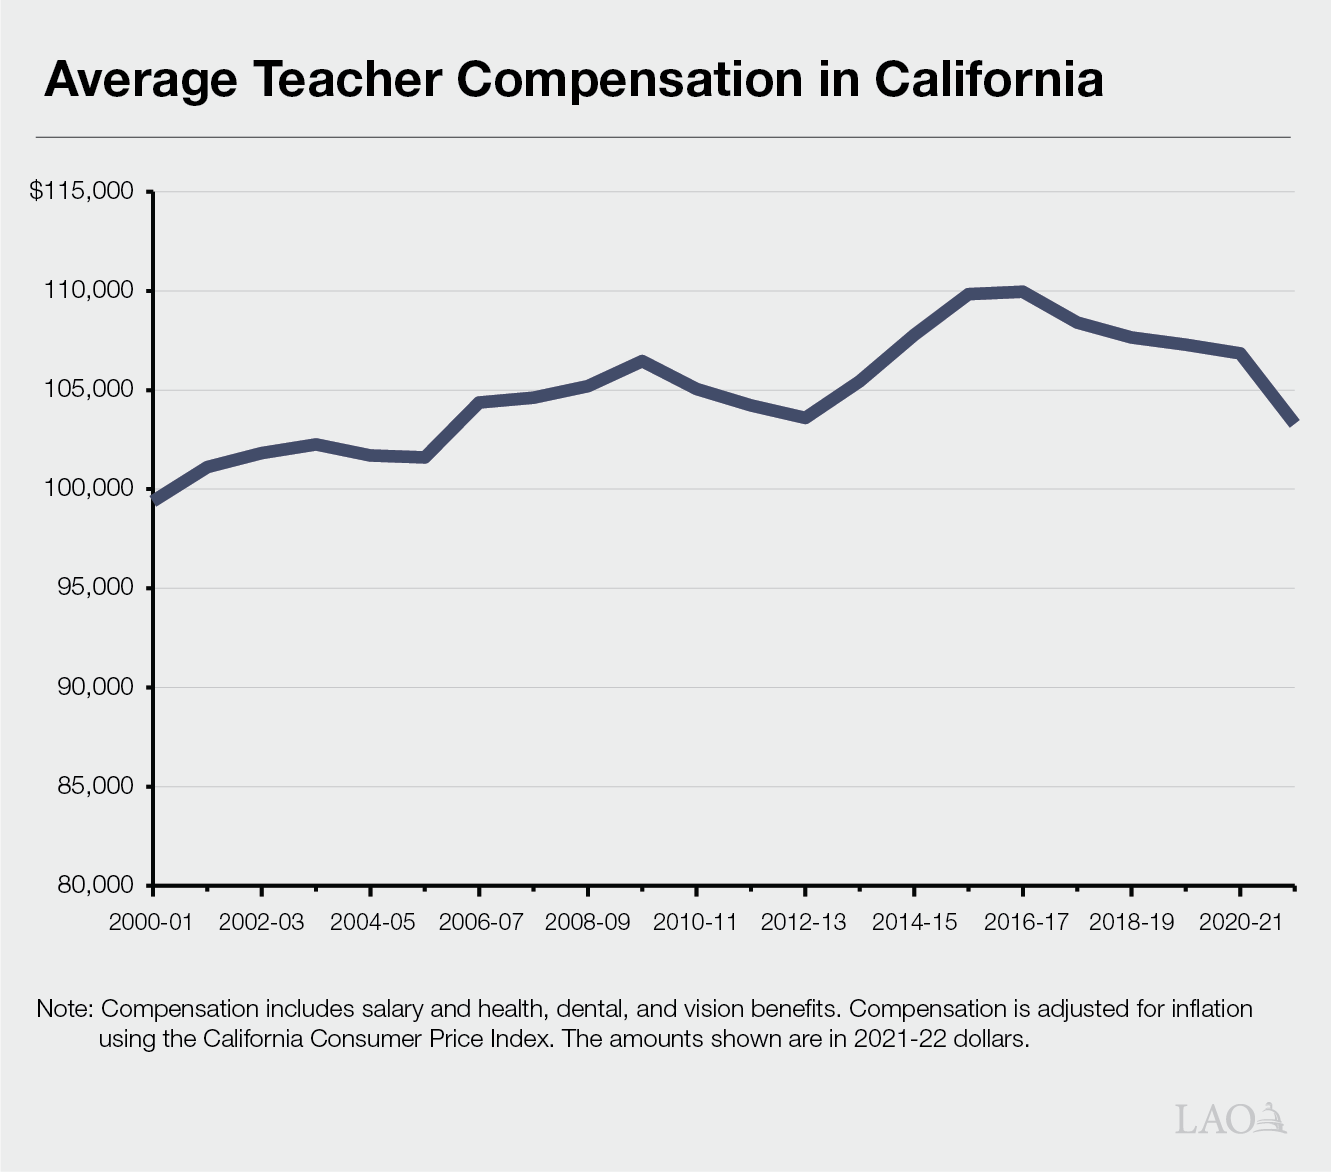
The graphic below shows changes in average statewide teacher compensation since 2000-01. In inflation-adjusted terms, average statewide teacher compensation in 2021-22 was $3,901 (4 percent) higher than in 2000-01.

Source: District-reported data from the California Department of Education's "Salary and Benefits Schedule for the Certificated Bargaining Unit" (Form J-90).
