The 2019-20 Budget:
California's Fiscal Outlook
See a list of this year's fiscal outlook material, including the core California's Fiscal Outlook report, on our fiscal outlook budget page.
LAO Contact

November 14, 2018
The 2019-20 Budget
California's Fiscal Outlook
Proposition 98 Outlook
Executive Summary
Modest Growth Projected for School and Community College Funding in the Upcoming Budget Year. Each year, the state calculates a “minimum guarantee” for school and community college funding based upon a set of formulas established by Proposition 98 (1988). Under our near‑term outlook, the 2019‑20 minimum guarantee is up $2.4 billion (3.1 percent) over our revised estimate of 2018‑19 funding. After accounting for this increase and backing out various one‑time initiatives funded in the prior year, among other adjustments, we estimate the Legislature would have an additional $2.8 billion for Proposition 98 programs in 2019‑20. The state could use this funding to cover a 3.1 percent statutory cost‑of‑living adjustment for school and community college programs (estimated to cost $2.3 billion) and certain other previously scheduled commitments (estimated to cost $57 million). Were the state to fund those increases, about $480 million would remain available for other activities. The Legislature might wish to consider using this remaining funding for one‑time initiatives, as doing so would provide a modest buffer in case the minimum guarantee drops after the budget year. The volatility of the minimum guarantee, the possibility of a recession sometime after 2019‑20, and the lack of funding in the state school reserve are all reasons the Legislature might wish to budget cautiously in the upcoming year.
Introduction
Report Provides Our Fiscal Outlook for Schools and Community Colleges. State budgeting for schools and the California Community Colleges is governed largely by Proposition 98, a constitutional amendment approved by California voters in 1988 and modified in 1990. The measure establishes a minimum funding requirement, commonly known as the minimum guarantee. In this report, we examine how the minimum guarantee might change over the next several years and discuss the factors likely to be driving those changes. We then examine key aspects of district budgets—focusing on the main cost pressures facing districts over the next several years. (The 2019‑20 Budget: California’s Fiscal Outlook contains a summary version of our Proposition 98 outlook, along with the outlook for other major programs in the state budget.)
Proposition 98 Funding Estimates
This part of the report has five sections. First, we explain the formulas that determine the guarantee. Second, we describe our key economic and revenue assumptions underlying the near‑term outlook. Third, we explain how our estimates of Proposition 98 funding in 2017‑18 and 2018‑19 differ from the estimates included in the June 2018 budget plan. Fourth, we estimate the 2019‑20 guarantee and identify the resulting funding that would be available for new commitments. Fifth, we forecast changes in the minimum guarantee through 2022‑23 under two economic scenarios.
Calculating the Minimum Guarantee
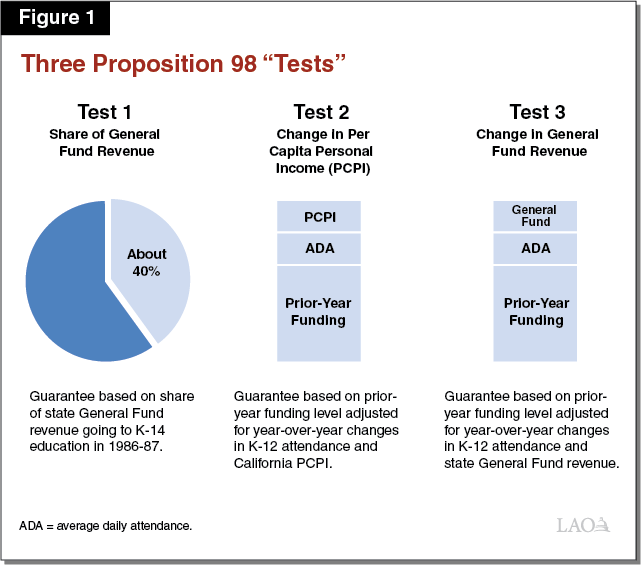
Minimum Guarantee Depends on Various Inputs and Formulas. The California Constitution sets forth three main tests for calculating the minimum guarantee. These tests depend upon several inputs, including K‑12 attendance, per capita personal income, and per capita General Fund revenue (see Figure 1). Depending on the values of these inputs, one of the three tests becomes “operative” and determines the minimum guarantee for that year. In most years, Test 2 or Test 3 is operative and the guarantee builds upon the guarantee from the previous year. The state meets the guarantee through a combination of General Fund and local property tax revenue, with increases in property tax revenue usually reducing General Fund costs dollar for dollar. Although the state can provide more funding than required, in practice it usually funds at or near the guarantee. With a two‑thirds vote of each house of the Legislature, the state can suspend the guarantee and provide less funding than the formulas require that year.
“Maintenance Factor” Payments Required in Certain Years. In addition to the three main tests, the Constitution requires the state to track an obligation known as maintenance factor. The state creates a maintenance factor obligation when Test 3 is operative or when it suspends the guarantee. The obligation equals the difference between the actual level of funding provided and the Test 1 or Test 2 level (generally whichever is higher). Moving forward, the state adjusts the outstanding maintenance factor each year for changes in K‑12 attendance and per capita personal income. In subsequent years, when General Fund revenue is growing relatively quickly, the Constitution requires the state to make maintenance factor payments. The magnitude of these payments is determined by formula, with stronger revenue growth generally requiring larger payments. These maintenance factor payments become part of the base for calculating the minimum guarantee the following year.
Estimates of Minimum Guarantee Revised After Budget Enactment. When the state updates the relevant Proposition 98 inputs, the guarantee typically changes from the level initially assumed in the budget act. Throughout the fiscal year, the state also revises its estimate of each school district’s allotment under the Local Control Funding Formula (LCFF) and automatically adjusts funding accordingly. Due to these changes, Proposition 98 funding typically ends up somewhat different than the final calculation of the guarantee.
New Process for Finalizing Proposition 98 Calculations and Truing Up. As part of the June 2018 budget plan, the state established a new process to finalize the Proposition 98 calculations. The process begins in May with the administration publishing a proposed final calculation of the minimum guarantee for the prior year. This is followed by defined periods for review, public comment, and potential legal challenge, with the guarantee generally becoming final in November. The state also established a new true‑up mechanism. For those years in which school and community college funding ends up higher than the minimum guarantee, the state is to credit the funding above the guarantee to a new Proposition 98 true‑up account (technically named the “Cost Allocation Schedule”). Total credits in the true‑up account are capped at 1 percent of the minimum guarantee. For those years in which funding ends up below the minimum guarantee, the state is to apply any credits in the account toward the amount required to meet the minimum guarantee. If the credits are insufficient to meet the higher guarantee, the state is required to make a one‑time “settle‑up” payment to schools and community colleges for the remaining difference.
Key Economic and Revenue Assumptions
Near‑Term Outlook Assumes Continued Growth of the California Economy. Our economic outlook is based on many national economic forecasts produced by various institutions and professional economists that Moody’s Analytics compiles into one “consensus forecast.” This forecast assumes continued growth of the U.S. economy. Based on this consensus national forecast, we develop projections about growth in the California economy. We expect wages and salaries in California to grow at an above‑average rate over the near term, similar to growth over the past few years. We assume that job growth continues but at a slower rate, similar to the slowing trend over the past few years. These wage and job trends are due, in part, to record low unemployment. Regarding the stock market, the consensus forecast assumes that stock prices—which grew rapidly for several years but have been volatile recently—will grow much more slowly moving forward.
Near‑Term Outlook Assumes Growth in State Revenue. Consistent with our economic assumptions, we estimate that state General Fund revenue will grow in the near term. Compared to the estimates underlying the June 2018 budget package, we estimate revenues from the state’s three largest taxes—the personal income tax, the corporation tax, and the sales tax—are up $2.6 billion in 2017‑18 and $5.1 billion in 2018‑19. For 2019‑20, our outlook assumes revenue from these taxes increases $4.9 billion (3.6 percent) over the revised 2018‑19 level. In all three years, growth in the personal income tax accounts for the largest share of the increase.
2017‑18 and 2018‑19 Updates
Proposition 98 Minimum Guarantee Down in 2017‑18 and 2018‑19. Compared with the estimates included in the June 2018 budget plan, we estimate that the minimum guarantee has dropped $226 million in 2017‑18 and $461 million in 2018‑19 (see Figure 2). The main factor explaining these drops is a reduction in K‑12 student attendance. Whereas the June budget plan assumed student attendance would be virtually flat over the period, our outlook incorporates more recent data showing attendance declines both years. The rest of the decrease in the minimum guarantee is due to various adjustments the state made in September to true up its estimates of the minimum guarantee back to 2009‑10. These true‑up calculations show that the state did not create as much maintenance factor as it previously assumed in prior years, resulting in a somewhat smaller maintenance factor payment being required in 2017‑18. These drops in the minimum guarantee occur despite General Fund revenue exceeding June estimates by a few billion dollars each year. This is because Test 2 is operative in both years, with the guarantee affected mainly by per capita personal income (an input the state locked down in June 2018) rather than changes in General Fund revenue.
Figure 2
Updating Prior‑ and Current‑Year Proposition 98 Estimates
(In Millions)
|
2017‑18 |
2018‑19 |
||||||
|
June Budget Plan |
November LAO |
Change |
June Budget Plan |
November LAO |
Change |
||
|
Minimum Guarantee |
$75,618 |
$75,391 |
‑$226 |
$78,393 |
$77,932 |
‑$461 |
|
|
K‑14 Funding |
|||||||
|
General Fund |
$53,381 |
$52,911 |
‑$471 |
$54,870 |
$54,230 |
‑$640 |
|
|
Local property tax |
22,236 |
22,556 |
320 |
23,523 |
24,096 |
572 |
|
|
Totals |
$75,618 |
$75,467 |
‑$151 |
$78,393 |
$78,325 |
‑$68 |
|
|
Funding Above Guarantee |
— |
$76a |
$76 |
— |
$394a |
$394 |
|
|
aReflects amount that will be credited to the Proposition 98 true‑up account. |
|||||||
School and Community College Funding Also Down in 2017‑18 and 2018‑19. Separate from changes to the minimum guarantee, our outlook also contains revised estimates of the funding allocated to schools and community colleges. Relative to the June 2018 budget plan, we estimate that funding is down $151 million in 2017‑18 and $68 million in 2018‑19 (see Figure 2). For 2017‑18, the decrease mainly reflects data from the California Department of Education showing lower‑than‑expected LCFF costs, mostly attributable to lower K‑12 attendance. For 2018‑19, the decrease is mainly attributable to our expectation that community college enrollment will not grow as quickly as assumed in June 2018. Lower enrollment typically reduces community college apportionment funding.
Funding Above the Guarantee Credited to New True‑Up Account. Although school and community college funding is down somewhat since the adoption of the June budget plan, the decrease in the minimum guarantee is much larger. As a result, funding under our outlook exceeds the minimum guarantee by $76 million in 2017‑18 and $394 million in 2018‑19. Under the new true‑up procedure, this funding (totaling $469 million) would be credited to the Proposition 98 true‑up account.
Increases in Local Property Tax Revenue Free Up State General Fund. Across 2017‑18 and 2018‑19, our estimates of local property tax revenue are up $892 million over the amounts assumed in the June budget plan. This upward revision mainly reflects actual (2017‑18) and projected (2018‑19) increases in the revenue schools and community colleges are receiving from former redevelopment agencies. (The state dissolved redevelopment agencies in 2011‑12.) This higher property tax revenue does not directly affect the calculation of the minimum guarantee or total school funding in either year. It does, however, reduce the amount of General Fund revenue that the state must allocate to schools and community colleges to meet the minimum guarantee.
2019‑20 Budget Planning
Under Near‑Term Outlook, 2019‑20 Guarantee Grows $2.4 Billion Over Revised 2018‑19 FundingLevel. As Figure 3 shows, the minimum guarantee grows to $80.8 billion in 2019‑20, an increase of $2.4 billion (3.1 percent) compared to our revised estimate of school funding in 2018‑19. State General Fund and local property tax revenue each cover about half of the increase. The growth in property tax revenue is due primarily to an estimated 6 percent increase in assessed property values, similar to growth rates the past few years. Test 1 is projected to be operative in 2019‑20, with the change in the guarantee mainly attributable to an increase in General Fund revenue. Despite the estimated 3.1 percent increase, the guarantee still grows less quickly than per capita personal income. Based on the way the state has interpreted the Proposition 98 formulas over the past several years, we assume no new maintenance factor is created under these conditions. In the nearby box, we discuss how the guarantee could change if General Fund revenue comes in higher or lower than our outlook assumptions.
Figure 3
Proposition 98 Near‑Term Outlook
(Dollars in Millions)
|
2017‑18 |
2018‑19 |
2019‑20 |
|
|
Minimum Guarantee |
$75,391 |
$77,932 |
$80,765 |
|
K‑14 Funding |
|||
|
General Fund |
$52,911 |
$54,230 |
$55,447 |
|
Local property tax |
22,556 |
24,096 |
25,318 |
|
Totals |
$75,467 |
$78,325 |
$80,765 |
|
Year‑to‑Year Change in Funding |
|||
|
General Fund |
$2,596 |
$1,319 |
$1,217 |
|
Percent change |
5.2% |
2.5% |
2.2% |
|
Local property tax |
$1,153 |
$1,539 |
$1,223 |
|
Percent change |
5.4% |
6.8% |
5.1% |
|
Total funding |
$3,748 |
$2,858 |
$2,440 |
|
Percent change |
5.2% |
3.8% |
3.1% |
|
General Fund Tax Revenuea |
$134,494 |
$139,972 |
$145,133 |
|
Growth Rates |
|||
|
K‑12 average daily attendance |
‑0.13% |
‑0.29% |
‑0.04% |
|
Per capita personal income (Test 2) |
3.69% |
3.67% |
4.70% |
|
Per capita General Fund (Test 3)b |
9.58% |
3.97% |
3.65% |
|
Operative Test |
2 |
2 |
1 |
|
Maintenance Factor |
|||
|
Amount created (+) or paid (‑) |
‑$1,201 |
— |
— |
|
Total outstanding |
— |
— |
— |
|
True‑Up Account |
|||
|
Credit (+) or withdrawal (‑) |
$76 |
$394 |
— |
|
Cumulative balance |
76 |
469 |
$469 |
|
aExcludes non‑tax revenues and transfers, which do not affect the calculation of the minimum guarantee. bAs set forth in the State Constitution, reflects change in per capita General Fund plus 0.5 percent. |
|||
Effects of Changes in State Revenue on the Guarantee
Guarantee Not Especially Sensitive to Revenue Changes in 2018‑19. When Test 2 is operative and the state is carrying no maintenance factor obligation (as is the case in 2018‑19), the guarantee tends not to be very sensitive to changes in state revenue. We estimate state revenues would need to increase about $1 billion before the guarantee would be affected. Increases in excess of $1 billion would result in the minimum guarantee rising about 40 cents for every additional state revenue dollar, as the operative test would shift to Test 1. On the downside, revenues would need to fall about $400 million before the guarantee would begin dropping. Decreases beyond this threshold would result in the guarantee falling about 55 cents for each dollar of revenue reduction, as Test 3 would become operative. Any changes to the guarantee on the downside would increase the amount credited to the true‑up account.
Guarantee More Sensitive to Revenue Changes in 2019‑20. For 2019‑20, Test 1 is the operative test under our outlook. If revenue were to be lower than our estimate by any amount, Test 1 would remain operative and the guarantee would drop about 40 cents for each dollar of lower revenue. The dynamics on the upside are somewhat more complicated. If revenue were to exceed our estimate by even a small margin, Test 3 would become operative. The guarantee is even more sensitive to revenue changes in Test 3 years, typically increasing about 55 cents for each dollar of additional revenue. If revenue were to increase more than $1.5 billion, Test 2 would become operative and the guarantee at that point would no longer increase. (For purposes of this analysis, we assume estimates of the minimum guarantee and General Fund revenue in 2018‑19 remain constant. Changes in 2018‑19, however, could affect the operative test in 2019‑20. We also hold other Proposition 98 inputs constant, though these inputs likely will change somewhat in the coming months as the state receives better data.)
$2.8 Billion Available for Proposition 98 Priorities in 2019‑20. The 2018‑19 budget plan allocated $413 million of Proposition 98 funding within the minimum guarantee for various one‑time initiatives. The largest allocations were related to K‑12 discretionary grants and startup costs for the new online community college. The budget plan also relied upon $55 million in one‑time savings. Backing out these one‑time costs and savings results in $358 million becoming available for other priorities. These freed‑up funds, in combination with the $2.4 billion increase from the higher minimum guarantee, provide the state with an additional $2.8 billion to allocate for school and community college programs in 2019‑20.
Covering Statutory Cost‑of‑Living Adjustment Estimated to Cost $2.3 Billion. When the minimum guarantee is growing, the state typically provides a statutory cost‑of‑living adjustment (COLA) for certain school and community college programs. For 2019‑20, we estimate the K‑14 COLA rate is 3.1 percent. The state also automatically adjusts LCFF for changes in student attendance. For 2019‑20, our outlook assumes K‑12 attendance declines 0.04 percent, which slightly offsets the cost of providing COLA. After accounting for this slight downward adjustment, we estimate COLA to cost $2.3 billion. This amount consists of $1.9 billion for LCFF, $164 million for other school programs (including $20 million for State Preschool), and $239 million for community college programs (mainly apportionments).
About Half a Billion Dollars Remaining. In addition to COLA, the state has indicated its intent to fund several other commitments in 2019‑20. These other commitments total $57 million and consist of the following:
- Grants for Fiscally Distressed Districts. In September, the state enacted legislation indicating that it would provide grants to two fiscally distressed school districts (Oakland Unified and Inglewood Unified) to cover part of their operating deficits. The administration estimates these grants will cost a total of $28 million in 2019‑20. (This estimate does not account for the additional cost pressure the state likely would face from other fiscally distressed districts seeking similar treatment.)
- New Preschool Slots. The 2018‑19 budget package funded 2,959 new full‑day State Preschool slots beginning April 1, 2019. We estimate the cost to annualize these slots in 2019‑20 is $27 million.
- Other Operating Support. The state decided two years ago to provide temporary operating support for one particular joint powers agency (the Southern California Regional Occupational Center). For 2019‑20, the state is scheduled to provide this agency with a direct appropriation of $2 million.
If the state were to cover these three scheduled commitments, we estimate it would have about $480 million remaining for other Proposition 98 purposes.
State Typically Sets Aside Some Funding Each Year for One‑Time Activities. Although the state could allocate all available Proposition 98 funding for ongoing programs, in practice it has tended to set aside some funding for one‑time activities. The main advantage of this budget approach is that it provides a measure of protection against future volatility in the minimum guarantee. Specifically, the expiration of one‑time initiatives provides a buffer that reduces the likelihood of cuts to ongoing programs if the guarantee were to experience a year‑over‑year decline. Over the past six years, the state has set aside an average of about $700 million per year for one‑time purposes. The exact one‑time allotment has ranged from a high of $1.2 billion in 2014‑15 to a low of $413 million in 2018‑19. In this context, the state’s cushion would be relatively modest even if it allocated the entire $480 million for one‑time activities.
State Usually Signals Its One‑Time Priorities. In recent years, the state has encouraged (but not required) districts to use one‑time funding for certain priorities. The 2018‑19 budget plan, for example, suggested school districts use their one‑time funding for professional development, instructional materials, technology upgrades, and employee benefit costs. Many school districts indicate they have spent their one‑time funds on these priorities. Regarding employee benefit costs, a few districts indicate using their one‑time funding to address retirement liabilities, in some cases achieving a significant reduction in their future retirement‑related costs. For community colleges, the state typically has provided somewhat tighter spending parameters for one‑time allotments. For example, in recent years, the state has required community colleges to use their one‑time allotments specifically for deferred maintenance and instructional equipment.
Outlook Through 2022‑23
Many Economic Scenarios Possible Over the Period. Over the next four years, state General Fund revenue will change due to various economic developments, such as changes in employment and fluctuations in the stock market. Changes in General Fund revenue, in turn, can have significant effects on the minimum guarantee. In this section, we describe how the guarantee would change through 2022‑23 under two economic scenarios: (1) a growth scenario and (2) a recession scenario. The growth scenario assumes personal income in California continues to grow and the stock market remains about level from today through 2022‑23. The recession scenario assumes a moderate recession begins early in 2020‑21. These two scenarios are intended to be illustrative rather than predictive about the direction of the economy in the coming years.
Under Growth Scenario, Minimum Guarantee Rises Steadily. The minimum guarantee increases steadily under the growth scenario from $77.9 billion in 2018‑19 to $89.2 billion in 2022‑23 (see Figure 4 and the Appendix). The average annual increase is $2.8 billion (3.4 percent). Annual increases of this magnitude likely would be more than enough to cover the statutory COLA for school and community college programs. Over the past 20 years, the statutory COLA has averaged 2.6 percent. Under the current consensus forecast prepared by Moody’s Analytics, the COLA after 2019‑20 is projected to be somewhat lower than this historical average—hovering around 1 percent per year. (We note that the statutory COLA has been difficult to predict, with the actual COLA rate, as locked down in April each year, exceeding Moody’s fall consensus projection the past few years.)
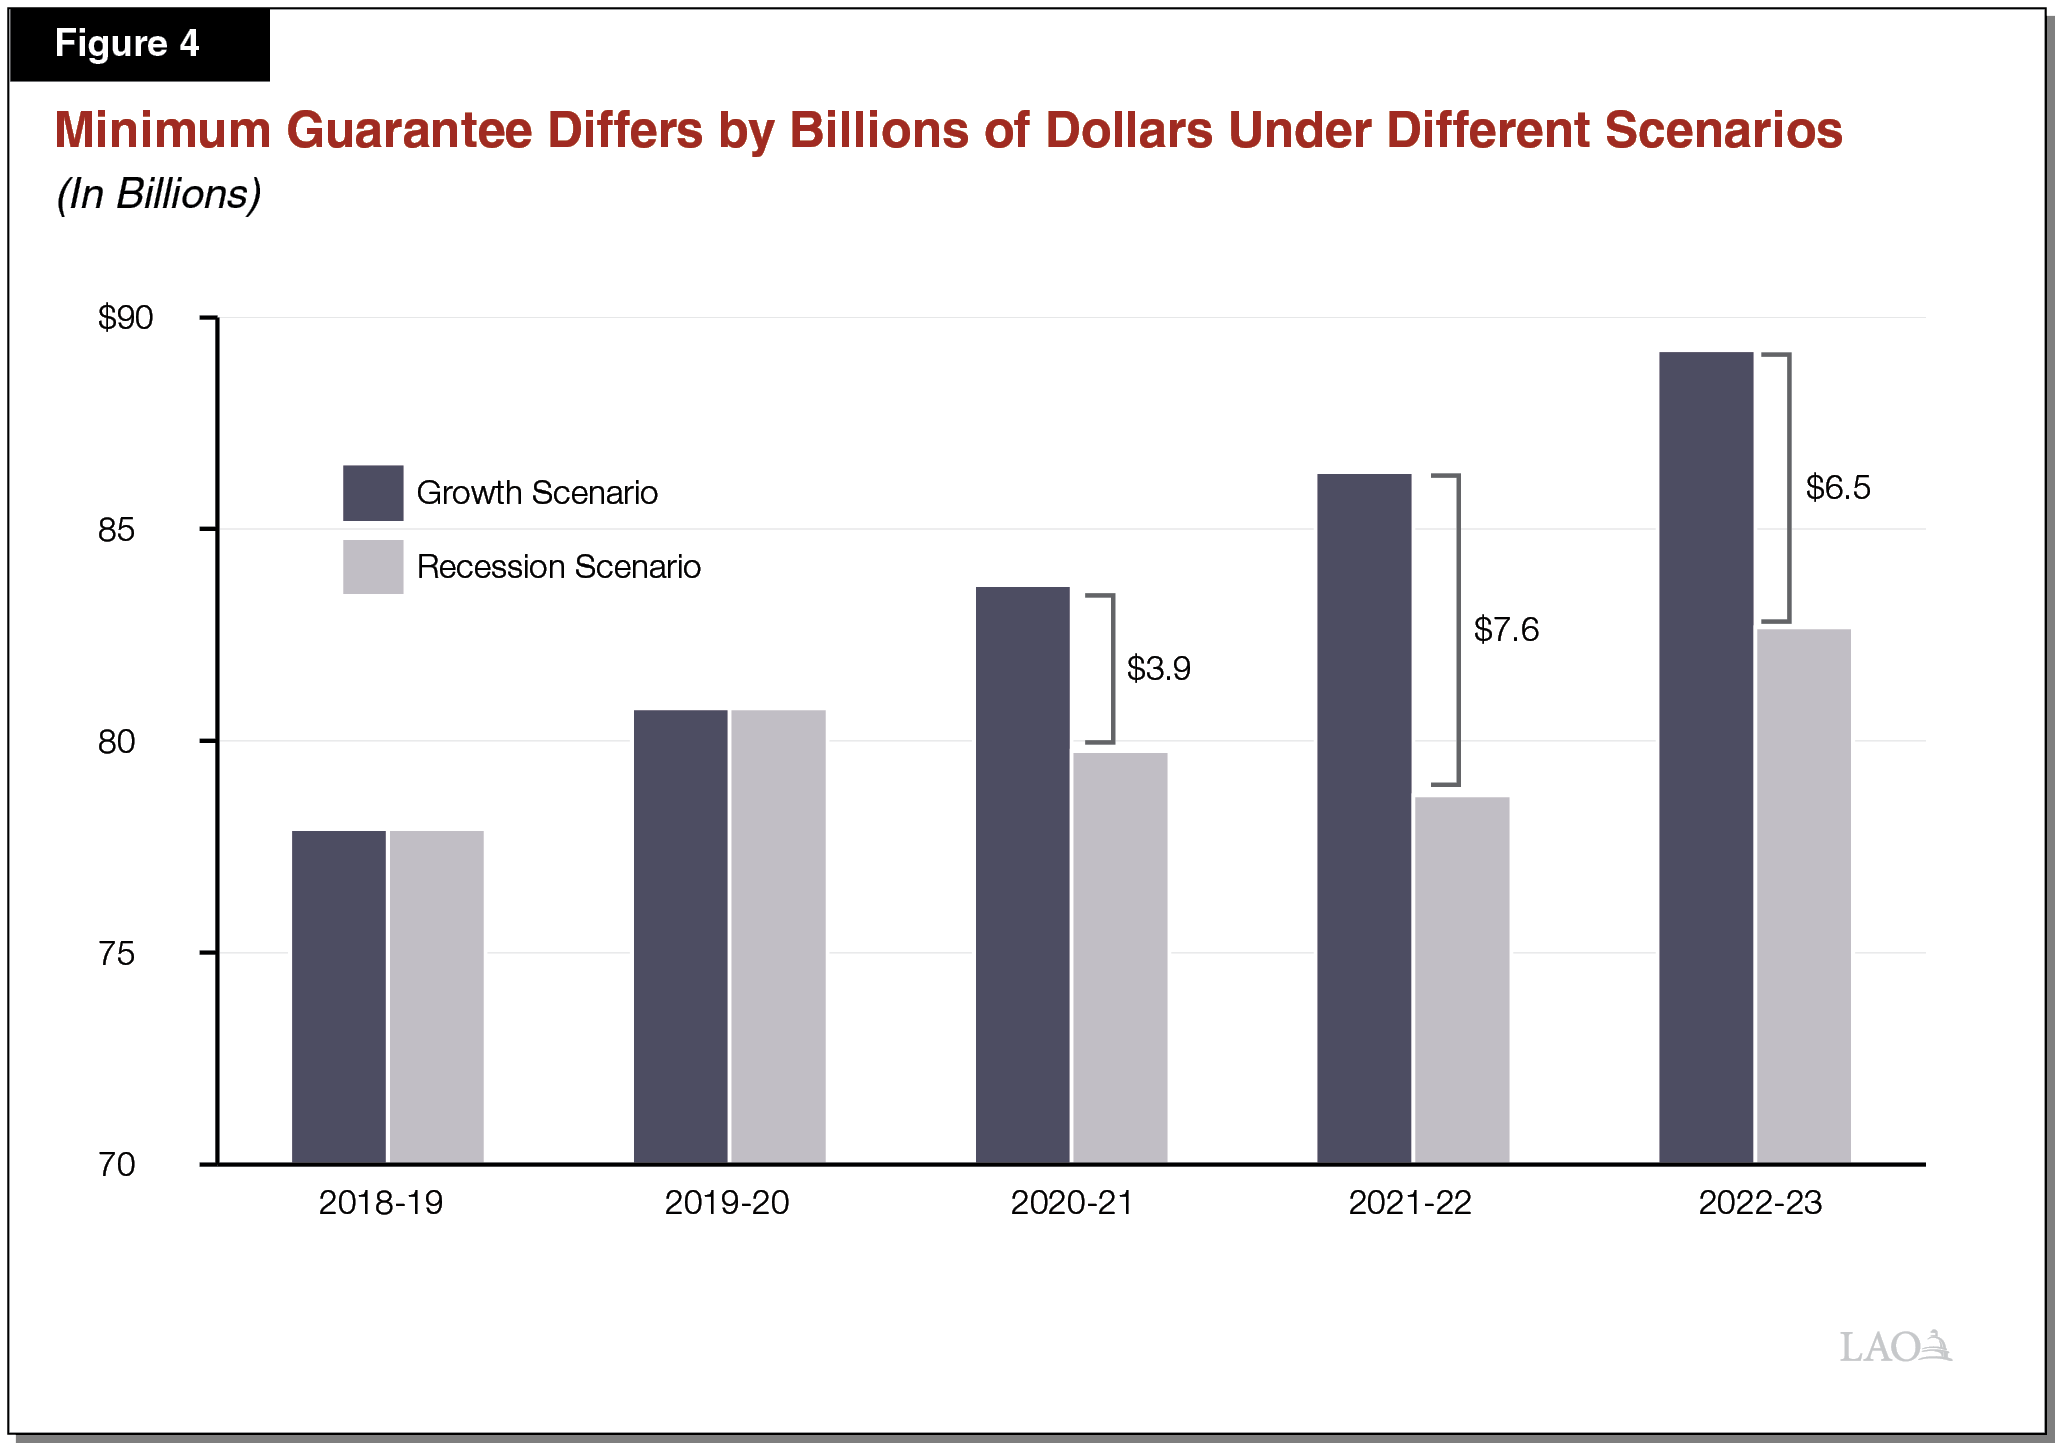
Under Recession Scenario, Minimum Guarantee Drops in 2020‑21 and 2021‑22. Under the recession scenario, the minimum guarantee drops $1 billion (1.2 percent) in 2020‑21 and a further $1.1 billion (1.3 percent) in 2021‑22. By 2021‑22, the guarantee is about $7.6 billion (8.8 percent) below the level in our growth scenario (see Figure 4). Under the recession scenario, the state not only would be unable to provide COLA in 2020‑21 and 2021‑22, it also would need to reduce spending (assuming it funds at the lower minimum guarantee). It could do this by making reductions to ongoing programs, deferring school and college payments, or exploring possible fund swaps.
State School Reserve Seems Unlikely to Provide Much Relief During Next Recession. Proposition 2 (2014) created a special state reserve for schools and community colleges. The Proposition 2 rules for making deposits into this reserve are relatively restrictive. Notably, despite strong economic growth over the past several years, the state has made no deposit to date into this reserve. Under our growth scenario, the school reserve continues to have a zero balance through 2022‑23. Were state revenues to increase more than our growth scenario assumes, the rules governing the state school reserve still are such that any balance accumulated before the next recession likely would be small.
State Could Help Districts Prepare for the Next Recession in Various Ways. The significant limitations of the Proposition 2 school reserve highlight the importance of schools and community colleges preparing for the next recession in other ways. The state could help in this regard by (1) setting aside funding for schools and community colleges outside of the Proposition 2 school reserve, (2) allowing and encouraging districts to increase their local reserves, (3) allocating some Proposition 98 funding for one‑time activities, (4) encouraging districts to pay down their liabilities (such as deferred maintenance and retiree health benefits), and (5) encouraging districts to be cautious in increasing their ongoing spending commitments. Any of these options (or combination of options) could mitigate the reductions districts might otherwise need to make during the next downturn.
Property Tax Revenue Projected to Rise. Whereas the minimum guarantee tends to be volatile, property tax revenue typically grows at a steadier pace. Under the growth scenario, property tax revenue grows from $24.1 billion in 2018‑19 to $28.5 billion by 2022‑23. This increase would be sufficient to cover about 40 percent of the growth in the guarantee projected over the period. The increase in property tax revenue is driven primarily by our assumption that assessed property values will increase by 6 percent in 2019‑20 and about 5 percent per year from 2020‑21 through 2022‑23. The slightly slower pace after 2019‑20 reflects our expectation that residential home prices and new construction will grow more slowly compared with the past few years. Under the recession scenario, property tax revenue would grow somewhat less quickly, though historically it has been much less sensitive to economic downturns than the minimum guarantee.
Key Trends in District Budgets
Turning to a District Perspective. This part of the report has four sections. First, we examine recent changes in school and community college district funding. In the next two sections, we discuss districts’ two main cost drivers: student attendance and staffing. In the fourth section, we focus on overall district fiscal health and summarize the key trade‑offs districts face moving forward.
District Funding
Per‑Student Funding Has Grown Significantly for School Districts. The 2018‑19 budget provided $61 billion for LCFF, an increase of nearly $22 billion (55 percent) over the 2012‑13 level. As the state phased in implementation of LCFF over the past six years, individual districts experienced notably different amounts of funding growth. By design, LCFF provided larger funding increases for districts with large proportions of disadvantaged students and/or historically low funding levels. Districts receiving the largest LCFF funding increases have seen their funding grow more than 70 percent per student. By comparison, districts receiving the smallest LCFF funding increases have experienced growth closer to 20 percent per student.
Per‑Student Funding Also Has Grown Significantly for Community College Districts, With Less Variation Among Districts. The 2018‑19 budget provided $7.1 billion for community college apportionments, an increase of about $1.6 billion (30 percent) over the 2012‑13 level. Until 2018‑19, the state distributed apportionment funding at a virtually uniform rate per student. Over the past several years, the state also has provided considerable increases in categorical funding, which were distributed largely on a per‑student basis. Given these funding practices, all community colleges have tended to see their per‑student funding levels rise about the same degree, with less variation in their growth compared with school districts.
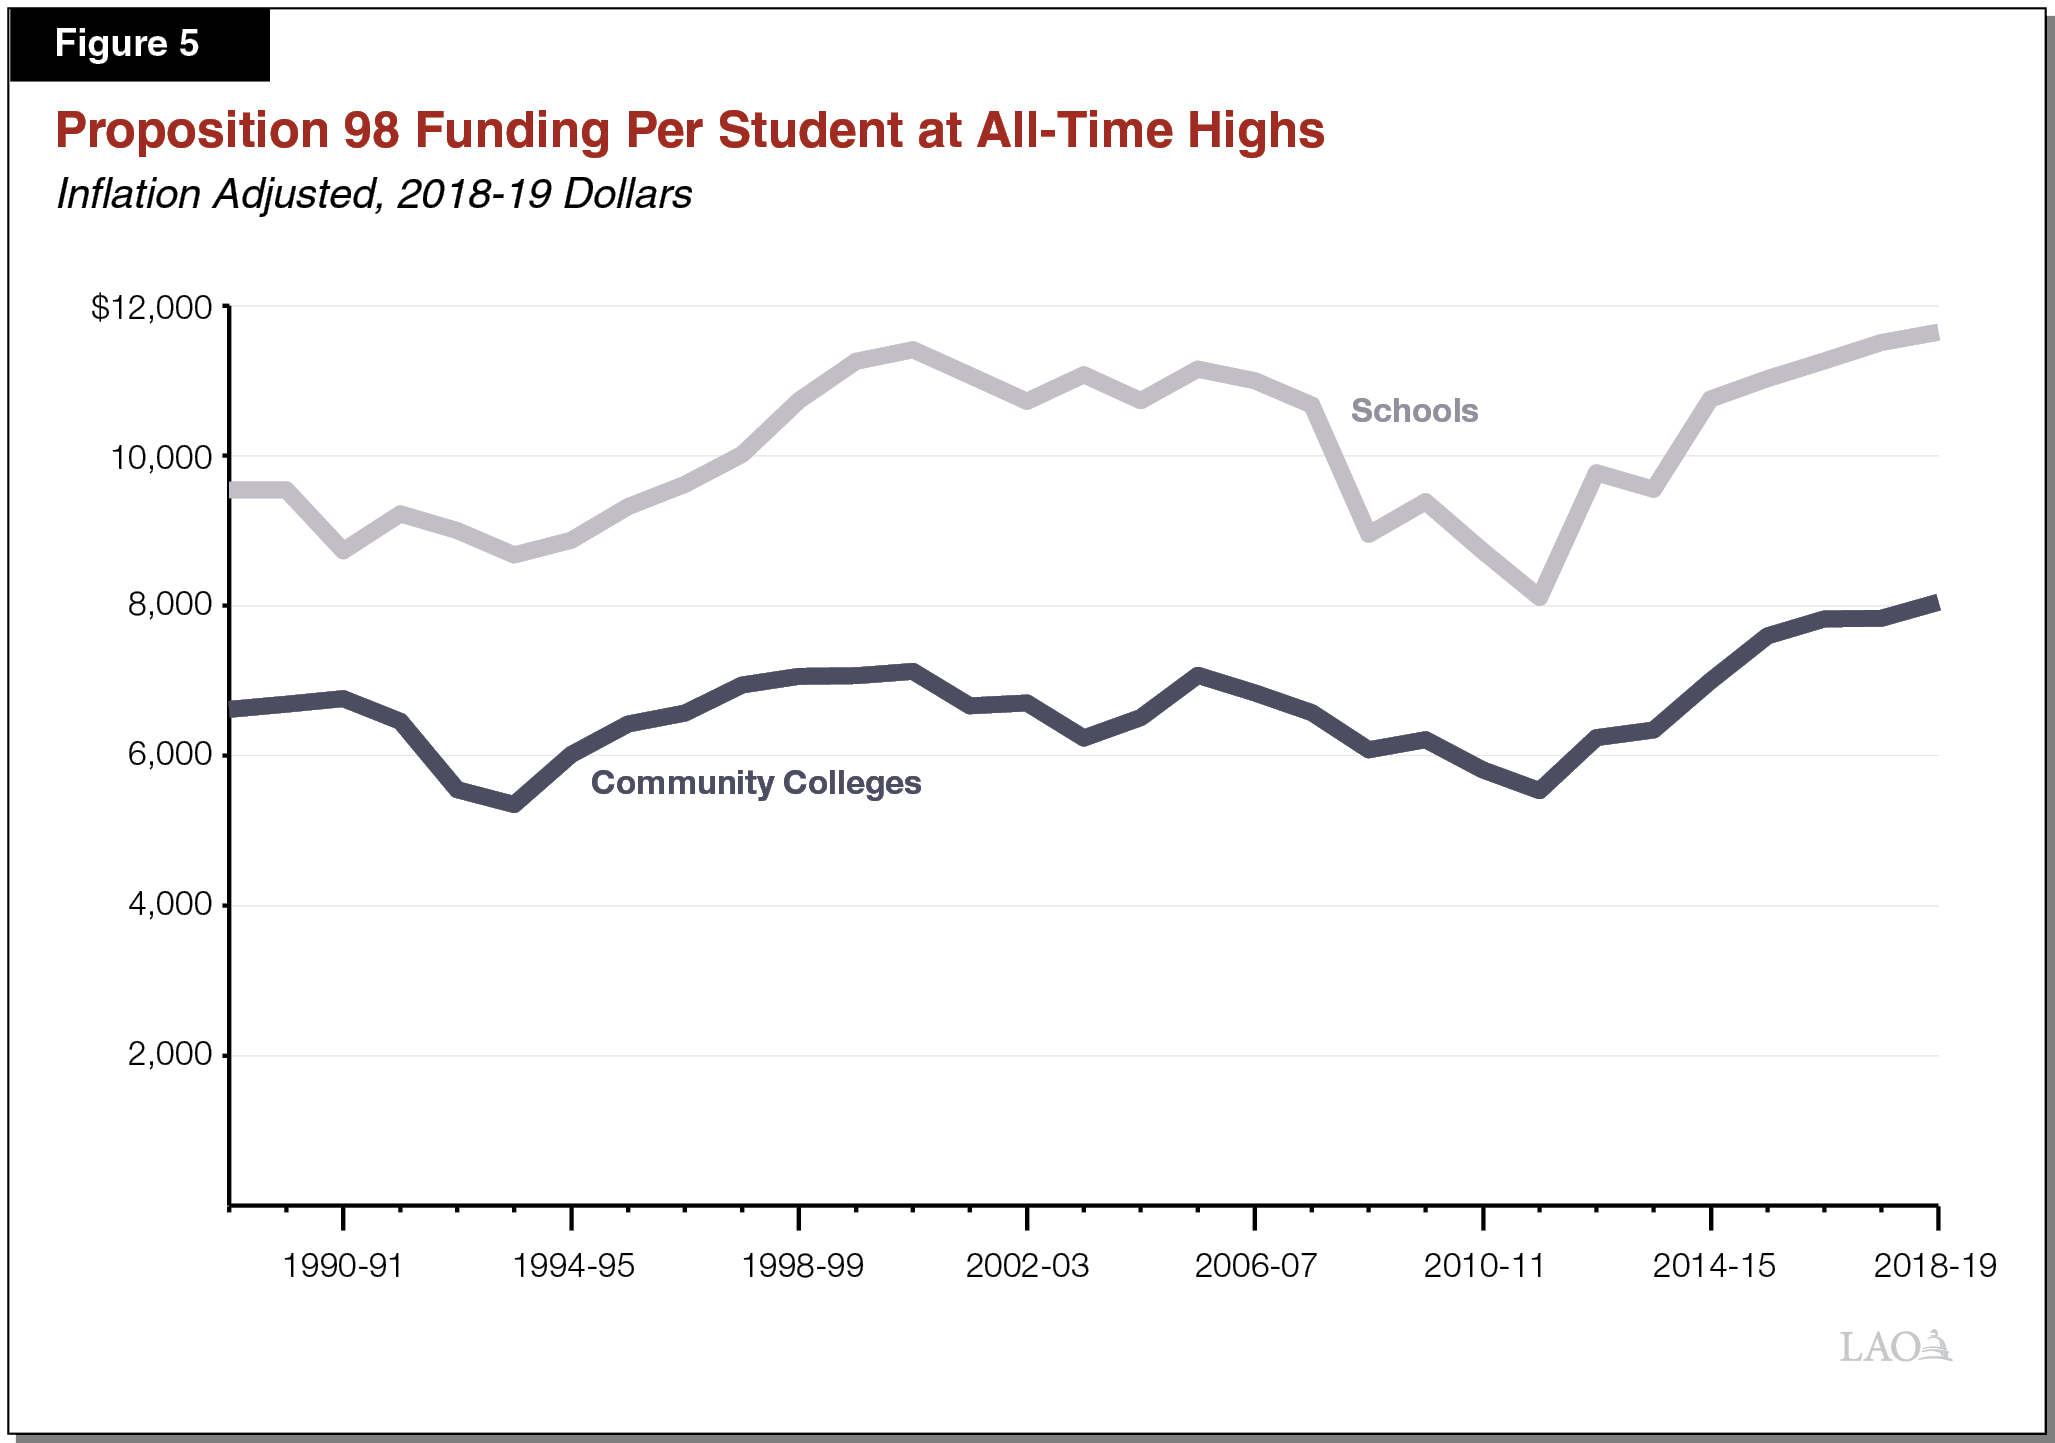
Per‑Student Funding Now at All‑Time High for Both Schools and Community Colleges. In 2018‑19, the state provided average Proposition 98 funding of $11,645 per K‑12 student and $7,584 per community college student. (Neither of these rates include funding for the Adult Education Block Grant.) Adjusted for inflation, these are the highest levels of per‑student funding since the passage of Proposition 98 in 1988 (see Figure 5). The K‑12 rate is about $1,000 per student (9 percent) above the amount school districts were receiving in 2007‑08 prior to the Great Recession. Similarly, the community college rate is about $1,000 per student (15 percent) above its inflation‑adjusted 2007‑08 level.
Growth Likely to Slow, Distribution Likely to Change. Over the past six years, Proposition 98 funding per student has grown by an average of about 6.5 percent per year. This is notably higher than the average historical growth rate of 3.8 percent. A significant portion of recent growth has been linked to maintenance factor payments. As of the end of 2017‑18, the state has paid all outstanding maintenance factor, such that growth in the minimum guarantee over at least the next few years is likely to be considerably slower (and could decline under our recession scenario). For school districts, full implementation of LCFF (reached in 2018‑19) also means that future funding increases are more likely to come through uniform COLAs rather than the differentiated augmentations districts have received since 2012‑13. The situation is reversed for community colleges. Under the new community college apportionment formula (adopted in 2018‑19), some college districts—those with relatively good student outcomes and relatively high numbers of low‑income students—can expect to receive somewhat larger increases than other districts over the next few years.
Enrollment Pressures
Overall School and Community College Enrollment Has Been Declining. School district attendance grew at an average annual rate of 2.4 percent from the late 1980s to early 2000s, remained essentially flat from 2004‑05 through 2013‑14, and began declining in 2014‑15. The primary factor explaining the recent decline is a drop in births, with somewhat lower migration into the state also having a modest impact. Community college enrollment has followed a similar long‑term trajectory, growing at an average rate of 2.6 percent from late 1980s through early 2000s and remaining essentially flat since that time. Compared with school districts, however, community college enrollment has fluctuated more notably from year to year. This is because community college enrollment is driven by a more complex set of factors including not only demographic trends but also college participation rates, economic cycles, and the condition of the state budget.
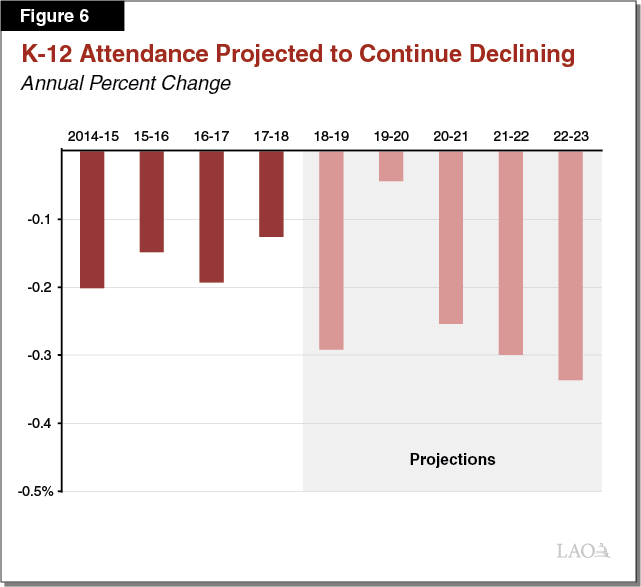
Overall Enrollment Likely to Continue Declining. Our estimates of K‑12 attendance are based on projections prepared by the Department of Finance in May 2018, with an adjustment to account for newly available data on 2017‑18 school attendance. These projections have K‑12 attendance declining at a relatively modest pace over the next few years (see Figure 6). These declines are consistent with our assumption that births and migration into the state will remain at relatively low levels throughout the outlook period. Regarding community colleges, our outlook assumes the number of full‑time equivalent (FTE) students declines an average of 0.7 percent per year over the next four years. This decline reflects two main sets of assumptions: (1) the traditional college‑age population (individuals between the ages of 18 to 24) will continue declining due to demographic trends, despite assuming a slight increase in their college participation rate; and (2) the older‑adult population (25 years of age and older) will continue declining due to a slight reduction in their participation rate, despite continued demographic growth. Both sets of assumptions reflect trends that have been evident for several years.
Enrollment Trends Vary Notably by Region. The overall trend in student attendance masks some notable regional variations. Over the past several years, school district attendance has decreased in many parts of the state, including the Bay Area and portions of northern California, with more pronounced declines in Los Angeles County and Orange County. It has grown, however, in the other parts of the state, particularly the Central Valley and some inland and southern regions, including Kern, San Joaquin, Sacramento, Fresno, Riverside, and San Diego counties. Community college enrollment has decreased primarily in the Bay Area and central coast region but has grown notably in southern California. Looking forward over the next several years, school attendance is projected to continue decreasing and increasing in these same respective areas.
Staffing Pressures
Districts Have Been Adding Faculty. One way districts have used their funding increases over the past several years is to hire additional staff. School districts had about 295,000 FTE teachers in 2017‑18, an increase of about 22,000 (8 percent) over the 2012‑13 level. Coupled with declining enrollment, the statewide student‑to‑teacher ratio, in turn, has been dropping over the past several years. In 2017‑18, it stood at about 21:1—comparable to the level prior to the Great Recession. Community colleges also are prioritizing adding faculty. College districts had about 36,000 FTE faculty (tenured and temporary) in 2017‑18, an increase of about 2,100 (6.3 percent) over the 2012‑13 level. The community college student‑to‑faculty ratio stood at about 33:1 in 2017‑18—slightly below the pre‑recession level.
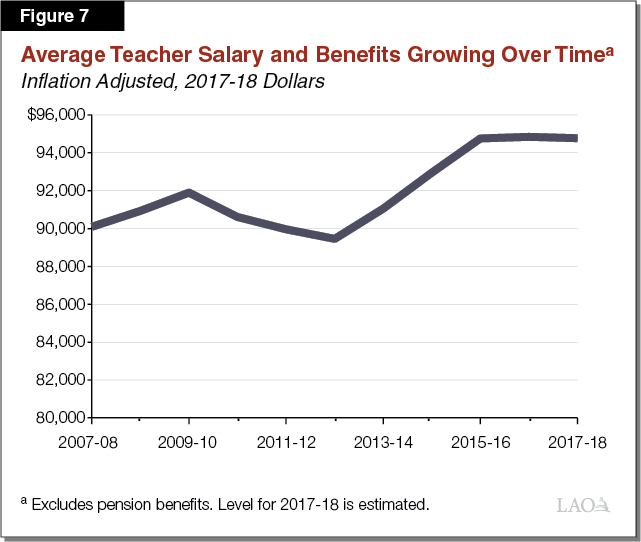
Districts Have Been Raising Salaries. In addition to hiring more teachers, districts have been increasing staff compensation. We estimate that the average salary and benefit cost of a school district teacher in 2017‑18 was approximately $95,000, an increase of about $5,300 (5.9 percent) over the inflation‑adjusted 2012‑13 level (see Figure 7). Though the state has less information about trends in community college districts, available data suggest that overall compensation for faculty has grown at least as quickly as inflation since 2012‑13. Inflation‑adjusted teacher/faculty compensation for both school districts and colleges also is higher today compared to 2007‑08 (the pre‑recession level).
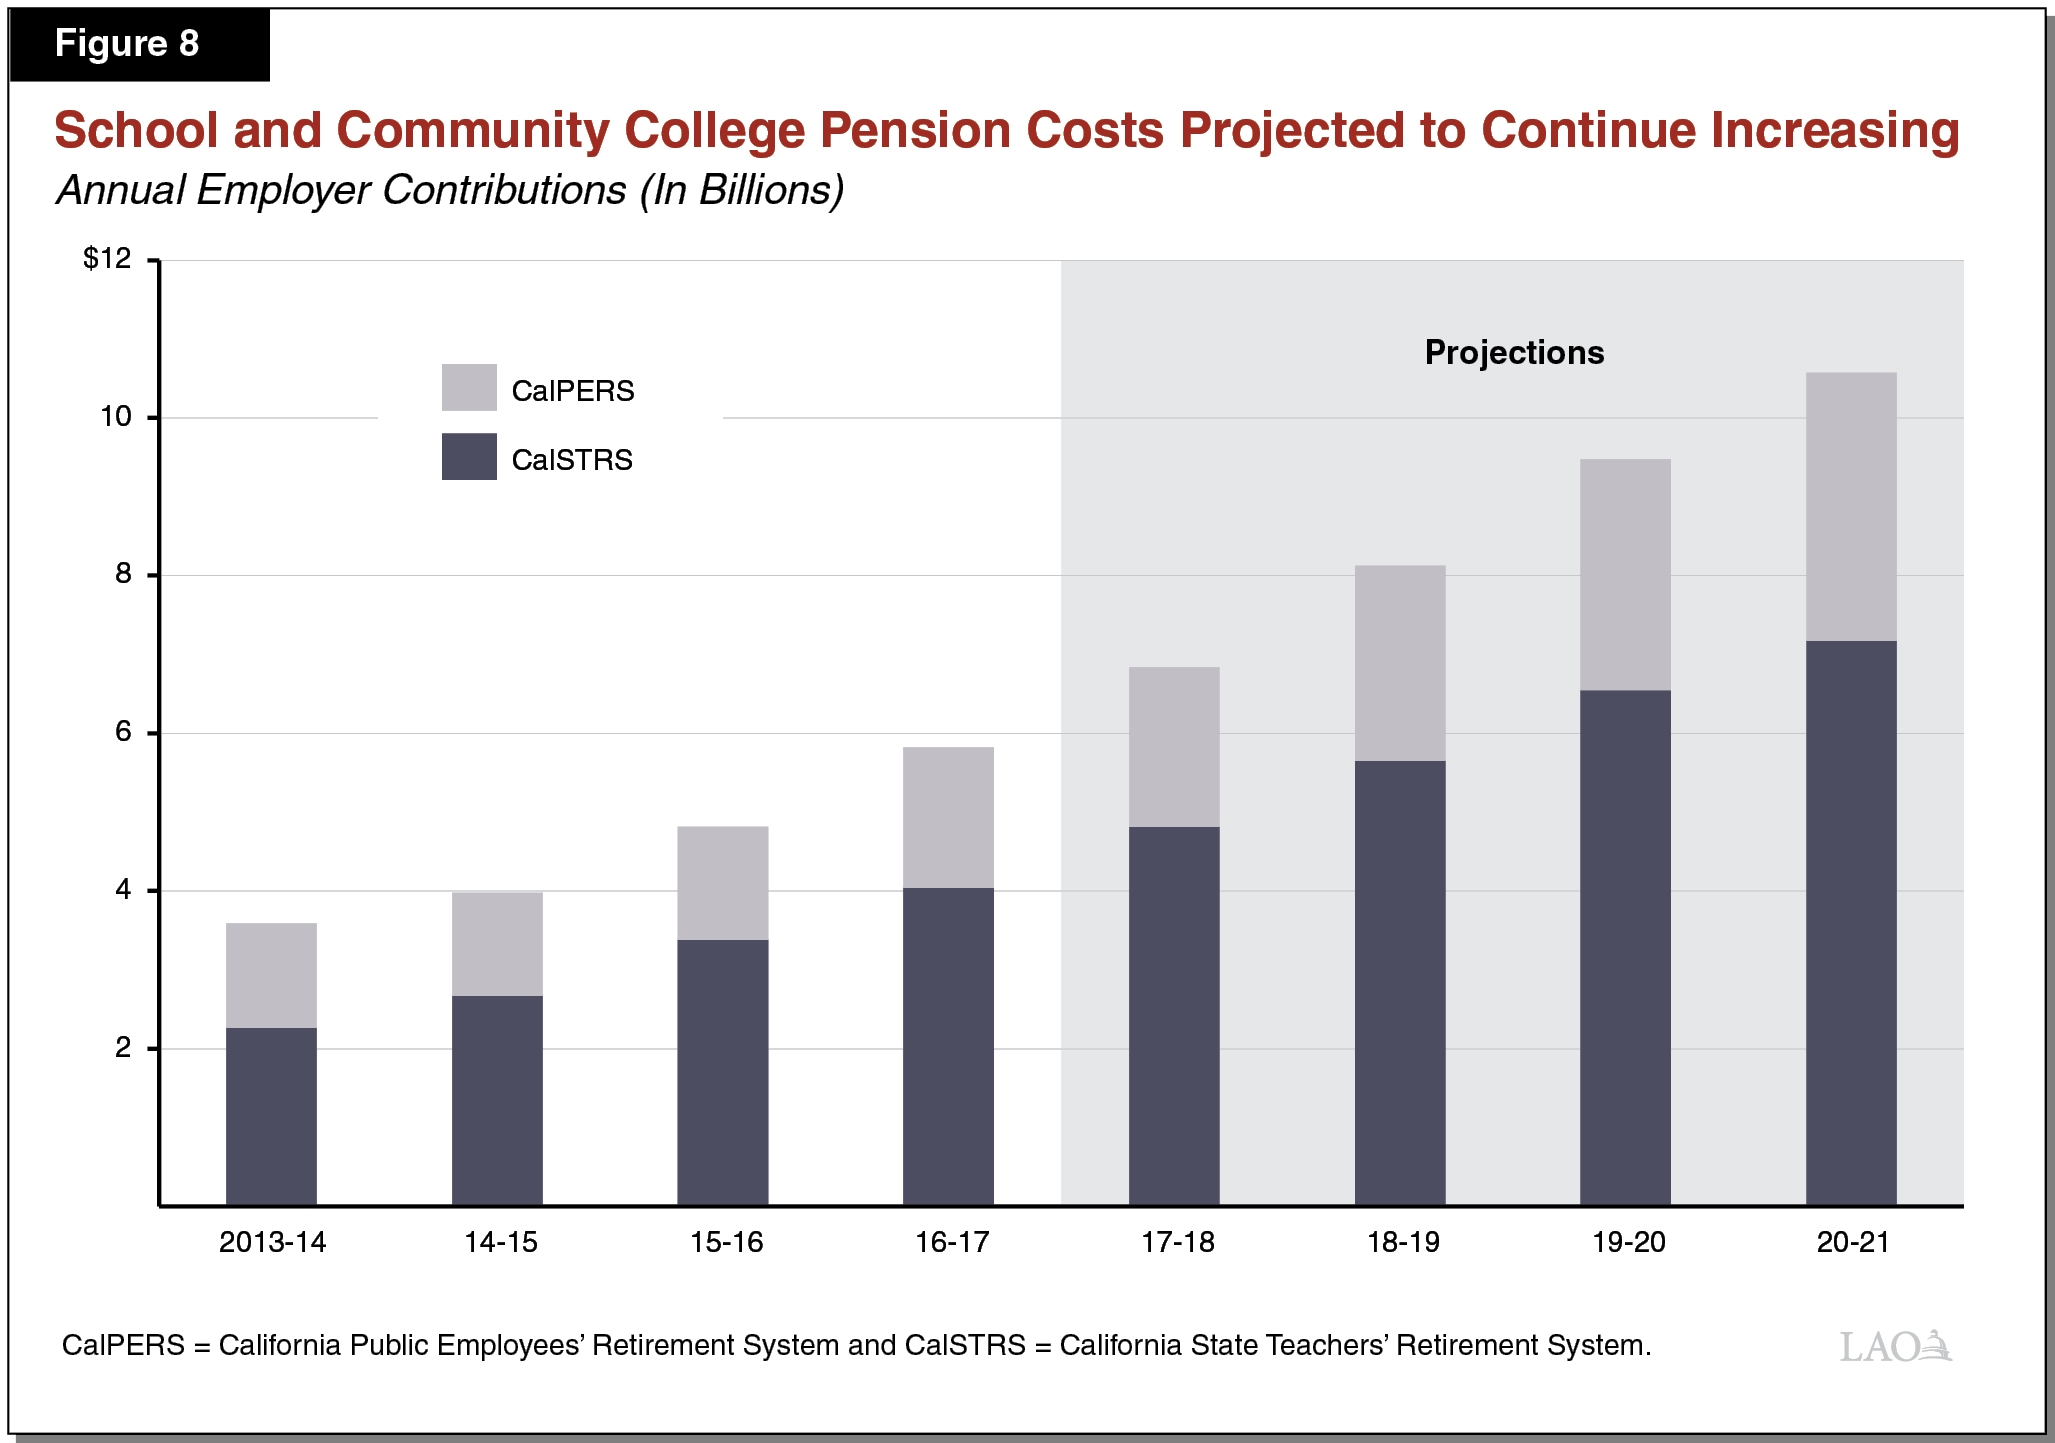
Pension Rates and Costs Have Been Growing. School and community college employees generally participate in one of two state pension systems. The California State Teachers’ Retirement System administers pension benefits for teachers, administrators, and other certificated employees, whereas the California Public Employees’ Retirement System (CalPERS) administers pension benefits for noncertificated employees. The 2014‑15 budget included a plan to fully fund the CalSTRS pension system by increasing contribution rates for districts, employees, and the state. Under the plan, district contribution rates increase on a statutory schedule from 8.3 percent of payroll prior to 2014‑15 to 19.1 percent by 2020‑21. We estimate total district contributions at $5.7 billion in 2018‑19, an increase of nearly $3.4 billion over the amount districts were paying before the funding plan began (see Figure 8). The governing board of CalPERS also is increasing district contribution rates. As of 2018‑19, districts’ CalPERS contribution rate is 18.1 percent of payroll, up from 11.4 percent in 2013‑14. CalPERS estimates total contributions at $2.5 billion in 2018‑19, an increase of $1.1 billion over the 2013‑14 level.
CalSTRS Contribution Rates Are Scheduled to Rise Through 2020‑21, Could Rise or Fall Thereafter. For the next two years, districts’ CalSTRS contributions are to continue increasing according to the statutory schedule. We estimate the associated cost increases at about $900 million in 2019‑20 and another $600 million in 2020‑21. After 2020‑21, CalSTRS can increase or decrease the district rate by up to 1 percentage point per year, provided the total district rate does not exceed 20.25 percent. Under CalSTRS’ current projections, the district rate would drop to 18.2 percent for 2021‑22 and 2022‑23. These projections, however, assume moderate payroll growth. If district payroll growth were to slow or decline—as would likely occur under our recession scenario—district rates could increase rather than decrease after 2020‑21. This is because district costs to amortize their share of CalSTRS’ unfunded liabilities are effectively fixed. If payroll were to decline in a recession, those costs would be higher when expressed as a percentage of payroll.
CalPERS Contribution Rates Also Are Likely to Rise in Coming Years. Districts’ CalPERS rates also are likely to increase over the next five years. Between 2018‑19 and 2019‑20, CalPERS projects that schools’ and community colleges’ contribution rates will increase from 18.1 percent to 20.7 percent—increasing total district contributions by about $450 million. By 2025‑26, CalPERS projects that the district rate will have reached 25.5 percent. When projecting future contribution rates, CalPERS actuaries make a variety of assumptions—including the rate of return on investments, payroll growth, and inflation. The actual contribution rate in the future will be higher or lower than currently projected depending on how future experience compares with these assumptions. For example, the district contribution rate could grow more slowly than projected if investment returns end up being higher than the assumed 7 percent. Conversely, the contribution rate could grow more quickly if investment returns are lower than the assumed 7 percent.
A Few Other Notable Staffing‑Related Pressures. For school districts, another key cost pressure relates to special education. Since 2012‑13, the number of students qualifying for special education services has increased by about 10 percent. Much of this increase is attributable to the growing prevalence of autism, a disability that typically requires districts to provide intensive support, often with aides and specialists. Some school districts and several community college districts also face large liabilities resulting from their agreements to provide health care for their retirees. The associated annual benefit costs in these districts are growing relatively quickly. Finally, some districts report cost pressure associated with recent increases in the minimum wage, with increases for their lowest paid employees placing upward pressure on the rest of their salary schedule.
Looking Ahead, Districts Likely to Continue Facing Staffing‑Related Cost Pressures. The cost pressures districts have faced the past few years are likely to continue over the outlook period. Available data indicate that district staffing costs statewide consistently grow in years when the minimum guarantee is projected to increase. In some cases, these staffing pressures also interact with one another. For example, districts that hire additional staff and grant above‑average salary increases will tend to experience above‑average growth in pension costs because pension contribution rates are tied to payroll.
Bottom Line for District Budgets
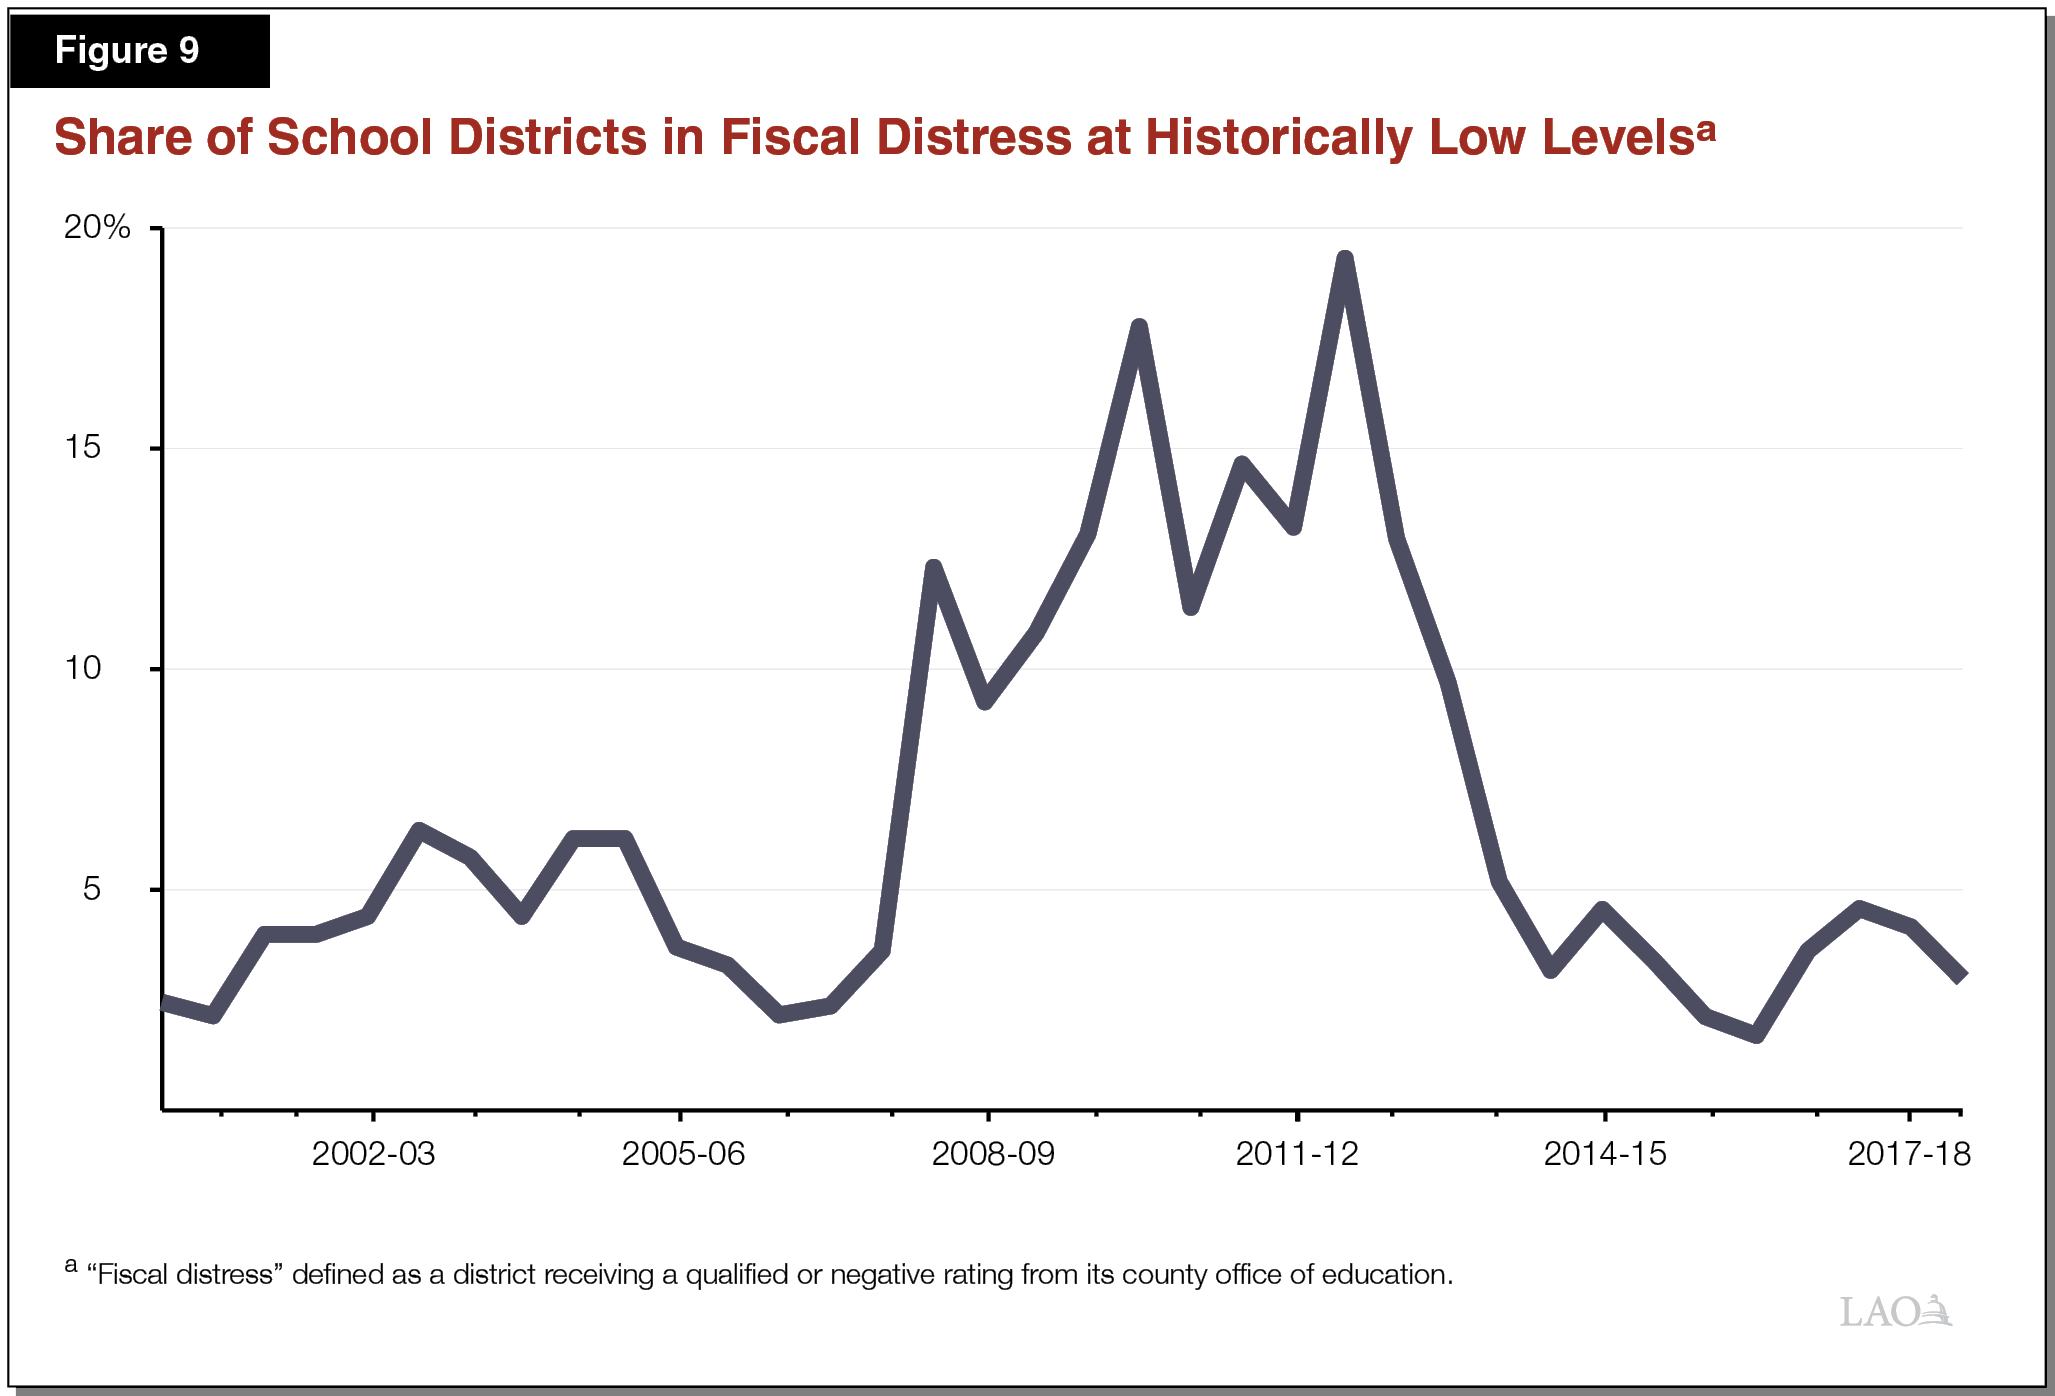
School District Fiscal Health Is Relatively Good. The state’s system of fiscal oversight requires county offices of education to review the financial condition of their school districts at various points during the year. Under this system, districts receive a “positive” rating if they are projected to meet their financial obligations in the current and subsequent two years, a “qualified” rating if they may be unable to meet their obligations at some point during this period, and a “negative” rating if they are at imminent risk of being unable to meet their obligations. During the spring 2018 review, more than 97 percent of school districts received positive ratings. As Figure 9 shows, the share of districts with qualified or negative ratings is near historic lows. Other evidence of positive fiscal health comes from school district credit ratings. According to S&P Global Ratings, which rates the majority of the state’s school districts, district credit ratings have been improving over the past several years. Though the state does not have a comparable system of fiscal oversight for community colleges, their budgets probably are in similarly good fiscal health.
Like State Budgeting, District Budgeting Entails Managing Competing Priorities. To remain in good fiscal condition moving forward, school and community college districts will need to continue building their budgets with care, arguably even greater care over the next few years given the expected slowing of growth in Proposition 98 funding. Despite the expected slowing of growth, virtually all districts will continue to face staffing‑related cost pressures. Many districts also will face pressure to downsize given their continued trajectory of declining student attendance. Maintaining positive fiscal health in this environment will require districts to balance local priorities carefully and expand programs cautiously.
Appendix
Proposition 98 Outlook Under Two Economic Scenarios
(Dollars in Billions)
|
2018‑19 |
2019‑20 |
2020‑21 |
2021‑22 |
2022‑23 |
|
|
Growth Scenario |
|||||
|
Minimum Guarantee |
|||||
|
General Fund |
$54.2 |
$55.4 |
$57.1 |
$58.9 |
$60.7 |
|
Local property tax |
24.1 |
25.3 |
26.5 |
27.5 |
28.5 |
|
Totals |
$78.3a |
$80.8 |
$83.7 |
$86.3 |
$89.2 |
|
Annual Change in Guarantee |
|||||
|
Amount |
$2.9 |
$2.4 |
$2.9 |
$2.7 |
$2.9 |
|
Percent |
3.8% |
3.1% |
3.6% |
3.2% |
3.3% |
|
General Fund Tax Revenueb |
$140.0 |
$145.1 |
$149.6 |
$153.9 |
$158.7 |
|
Growth Rates |
|||||
|
K‑12 average daily attendance |
‑0.3% |
‑0.04% |
‑0.3% |
‑0.3% |
‑0.3% |
|
Per capita personal income (Test 2) |
3.7% |
4.7% |
4.6% |
3.2% |
3.0% |
|
Per capita General Fund (Test 3)c |
4.0% |
3.7% |
3.1% |
2.9% |
3.1% |
|
Operative Test |
2 |
1 |
1 |
1 |
1 |
|
Maintenance Factor Outstanding |
— |
— |
— |
— |
— |
|
Recession Scenario |
|||||
|
Minimum Guarantee |
|||||
|
General Fund |
$54.2 |
$55.4 |
$53.2 |
$51.2 |
$54.1 |
|
Local property tax |
24.1 |
25.3 |
26.5 |
27.5 |
28.5 |
|
Totals |
$78.3 |
$80.8 |
$79.8 |
$78.7 |
$82.7 |
|
Annual Change in Guarantee |
|||||
|
Amount |
$2.9 |
$2.4 |
‑$1.0 |
‑$1.1 |
$4.0 |
|
Percent |
3.7% |
3.1% |
‑1.2% |
‑1.3% |
5.0% |
|
General Fund Tax Revenueb |
$140.0 |
$145.1 |
$139.4 |
$134.0 |
$141.6 |
|
Growth Rates |
|||||
|
K‑12 average daily attendance |
‑0.3% |
‑0.04% |
‑0.3% |
‑0.3% |
‑0.3% |
|
Per capita personal income (Test 2) |
3.7% |
4.7% |
4.6% |
1.1% |
‑1.0% |
|
Per capita General Fund (Test 3)c |
4.0% |
3.7% |
‑4.0% |
‑3.8% |
5.7% |
|
Operative Test |
2 |
1 |
1 |
1 |
1 |
|
Maintenance Factor Outstanding |
— |
— |
— |
— |
— |
|
Comparison of Scenarios |
|||||
|
Minimum Guarantee |
|||||
|
Growth scenario |
$78.3 |
$80.8 |
$83.7 |
$86.3 |
$89.2 |
|
Recession scenario |
78.3 |
80.8 |
79.8 |
78.7 |
82.7 |
|
Differences |
— |
— |
$3.9 |
$7.6 |
$6.5 |
|
aIncludes $394 million in General Fund spending that exceeds the minimum guarantee. We assume this funding is credited to the true‑up account and not part of the base for calculating the 2019‑20 guarantee. bExcludes non‑tax revenue and transfers, which do not affect the calculation of the minimum guarantee. cAs set forth in the State Constitution, reflects change in per capita General Fund plus 0.5 percent. |
|||||