LAO Contact

December 21, 2018
Assessing California's Climate Policies—
An Overview
- Introduction
- State GHG Targets and Policies
- Policies Have a Wide Variety of Effects
- Key Challenges in Estimating Policy Effects
- Issues for Legislative Consideration
- Conclusion
Executive Summary
Overview of Report. Chapter 135 of 2017 (AB 398, E. Garcia) requires our office to annually report on the economic impacts and benefits of California’s statutory greenhouse gas (GHG) emission goals—statewide emissions to 1990 levels by 2020 and to 40 percent below 1990 levels by 2030. This report provides a conceptual overview of the potential economic effects of policies intended to help meet these goals—both positive and negative—as well as identifies some key issues for the Legislature to consider when designing and evaluating state climate policies. In a companion report, Assessing California’s Climate Policies—Transportation, we provide more detailed information and comments on the state’s major policies aimed at reducing emissions from the transportation sector.
Climate Policies Have a Wide Variety of Effects. The state’s wide range of climate policies to reduce GHGs likely have many different effects. Such effects include:
- GHG Reductions. Since GHG emissions cause economic damage, there is a global benefit to reducing those emissions.
- Co‑Benefits. Policies that reduce GHGs can have other benefits, such as reducing co‑pollutants that affect local air quality, reducing future energy costs, and/or correcting other existing market distortions.
- Direct Costs. In addressing emission reductions, there are often costs for businesses or households that require some type of additional monetary payment, such as households paying for more expensive types of electricity or businesses paying to produce more expensive goods. Other costs are not explicit monetary losses, but households nonetheless give up something valuable to them, such as comfort, convenience, or time.
- Indirect Effects. Some direct costs have indirect effects in other areas of the economy as markets adjust to changes in how households and businesses behave.
- Economic Transfers. Some of the most visible effects of state climate policies—such as cap‑and‑trade allowance auctions—largely reflect economic “transfers” between different households or businesses.
Key Challenges in Estimating Policy Effects. There are a variety of challenges in accurately estimating the overall net effects of California’s climate policies—both before (prospective) and after (retrospective). Some of the key challenges include (1) controlling for factors that are largely unrelated to state climate policy (such as changes in economic conditions, technological progress, and federal policies), (2) assessing GHG effects that extend beyond the state’s formal system for monitoring statewide emissions (such as emissions related to biofuels, upstream emissions from imported goods, and leakage of emissions into other jurisdictions), (3) measuring implicit and indirect effects, and (4) considering interactions between different state and federal policies.
Issues for Legislative Consideration. Given the wide variety of effects that state climate policies generate and the challenges associated with estimating those effects, we identify the following key issues for the Legislature to consider in regards to future climate policy design and evaluation:
- Use economywide carbon pricing to achieve low‑cost GHG reductions.
- Implement “complementary” policies only in circumstances when they are well‑targeted and justified to ensure they are achieving benefits that carbon pricing would not. Examples might include policies that effectively promote innovation or reduce other types of pollution.
- Focus on policies that are most likely to encourage GHG reductions in other jurisdictions to maximize the overall GHG reduction benefits for California.
- Establish a robust system for climate policy evaluation that helps ensure the Legislature has more complete information about the effects of state climate policies.
Introduction
Chapter 135 of 2017 (AB 398, E. Garcia) requires our office to annually report on the economic impacts and benefits of California’s statutory greenhouse gas (GHG) emission goals—limiting GHG emissions statewide to 1990 levels by 2020 and to 40 percent below 1990 levels by 2030. The state has implemented a range of policies intended to help meet these GHG limits, hereafter referred to as climate policies or programs. These policies have a wide variety of economic effects—both positive and negative. This report provides a conceptual overview of these effects, as well as some key issues to consider when designing and evaluating state climate policies. Specifically, we (1) provide a general overview of the state’s GHG limits and the major policies that are being implemented to achieve those targets, (2) describe the general types of economic effects associated with these policies, (3) identify key challenges in estimating the magnitude of these effects, and (4) discuss key issues for the Legislature to consider in regards to future climate policy design and evaluation. In a companion report, Assessing California’s Climate Policies—Transportation, we provide more detailed information and comments on the state’s major policies aimed at reducing emissions from the transportation sector. In subsequent reports, we intend to assess policies that reduce emissions from other sources, such as electricity generation and short‑lived climate pollutants.
State GHG Targets and Policies
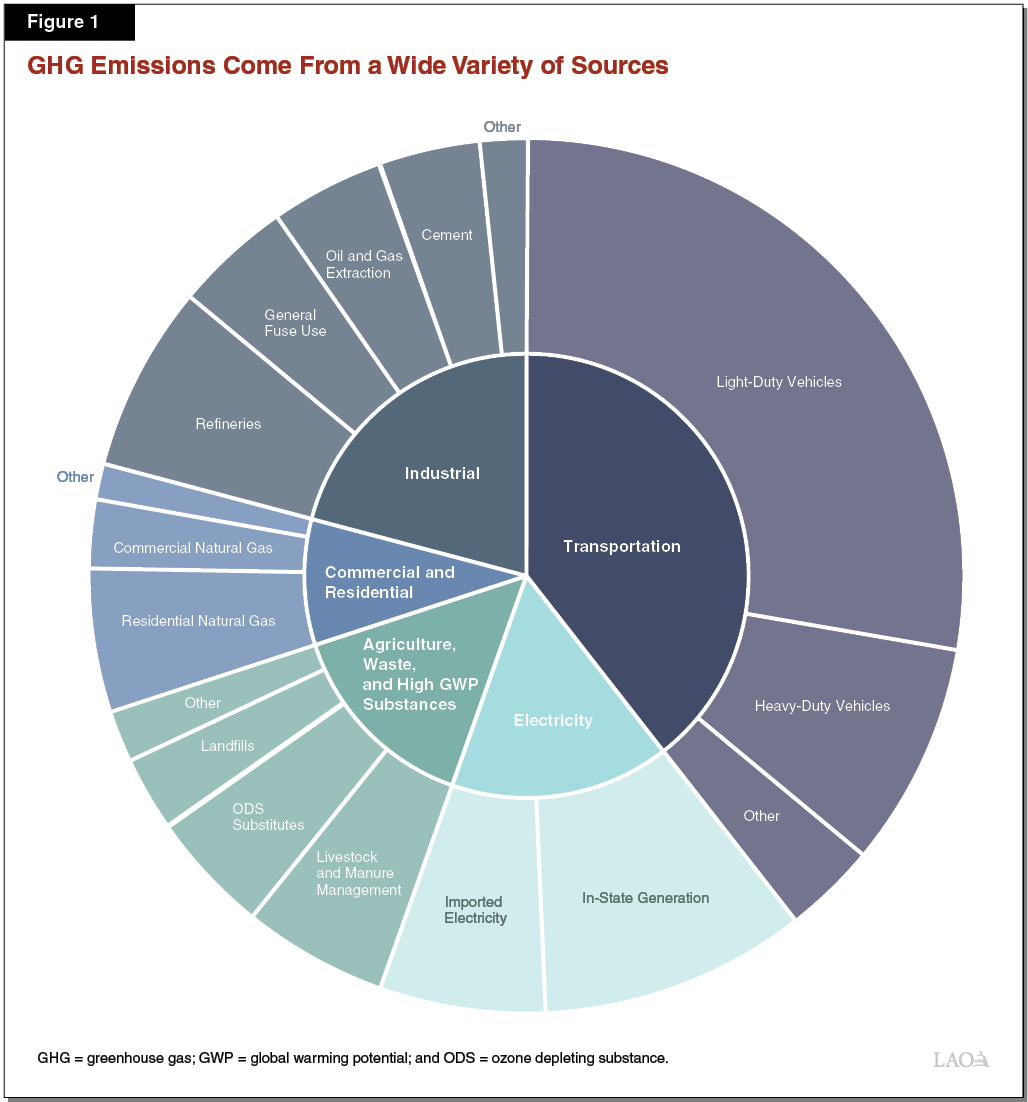
Emissions Come From a Wide Variety of Sources. Figure 1 shows the different sources of GHG emissions in California, as measured by the California Air Resources Board’s (CARB’s) inventory. The inventory is CARB’s estimate of statewide emissions, consisting mainly of emissions that occur from in‑state combustion of fossil fuels (such as gasoline, diesel, and natural gas) and production of goods (such as refining oil into gasoline and manufacturing cement). In general, emissions associated with goods produced out‑of‑state, but imported into California, are excluded. (We discuss some of the emissions that are excluded from the inventory in more detail later in this report.) One key exception is that the inventory includes estimated emissions from electricity that is generated out‑of‑state, but consumed in California.
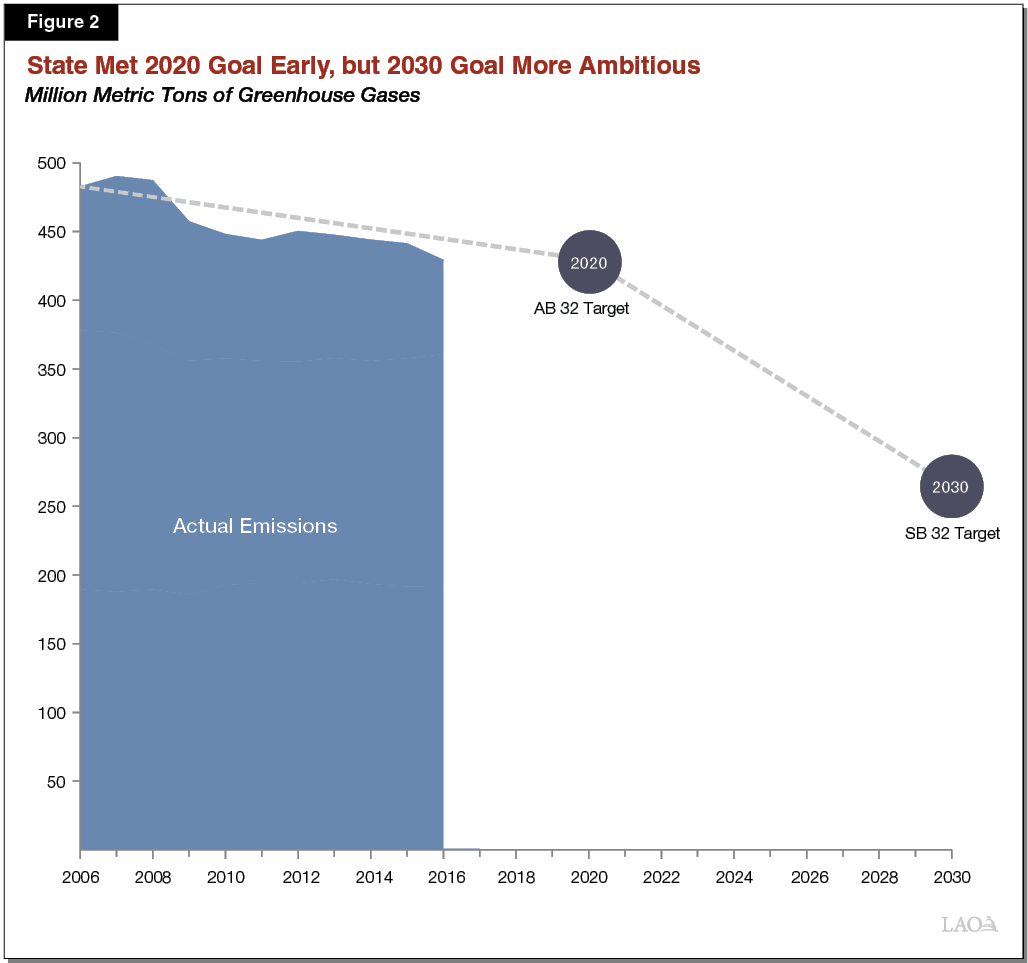
AB 32 and SB 32 Establish State GHG Limits. Chapter 488 of 2006 (AB 32, Núñez/Pavley) established the goal of limiting GHG emissions statewide to 1990 levels by 2020. In 2016, Chapter 249 (SB 32, Pavley) extended the limit to 40 percent below 1990 levels by 2030. As shown in Figure 2, emissions have decreased since AB 32 was enacted—dropping to below the 2020 limit in 2016. However, the rate of reductions needed to meet the SB 32 target are much greater.
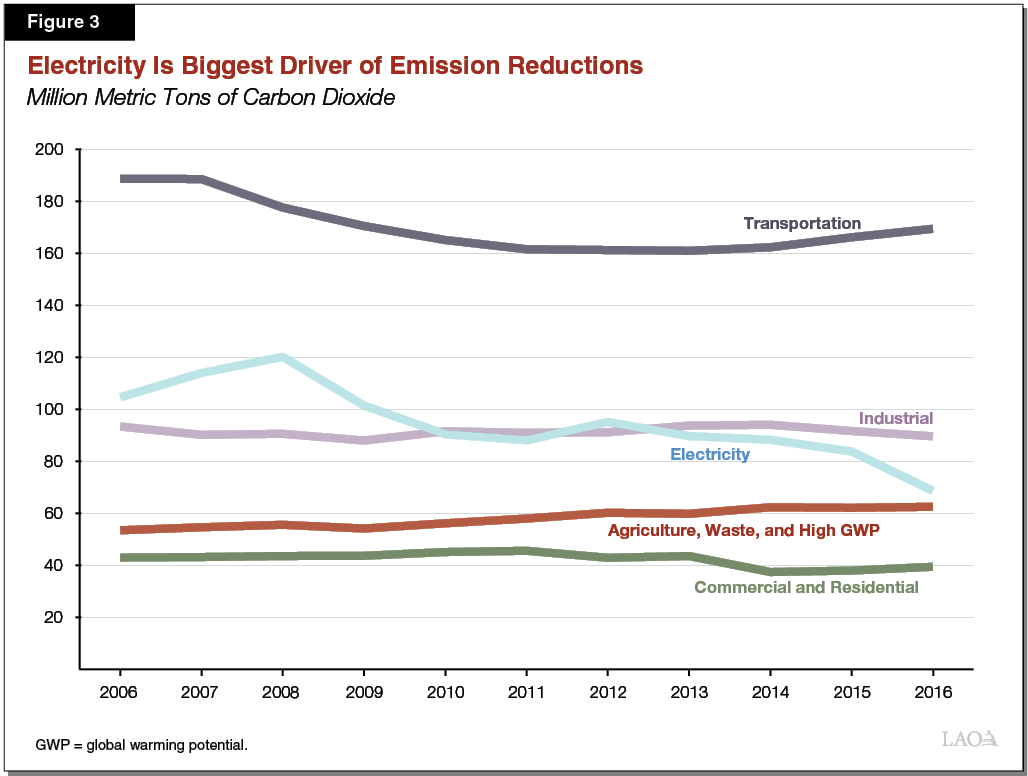
Reduction in Emissions Driven by Electricity Sector. The reduction in emissions since 2006 are the result of a wide variety of factors, including state policies, technological advancements, and the Great Recession. As Figure 3 shows, most of the reductions have come from electricity, and almost all of those reductions have come from electricity that is imported from out‑of‑state.
State Has Many Policies to Reduce GHGs. State law requires CARB to develop a Scoping Plan to achieve the emissions limits and update the plan periodically. The first Scoping Plan was approved by CARB in 2008, then updated in 2014 and 2017. The state has dozens of different policies in place to reduce emissions. Figure 4 summarizes the major policies in the 2017 Scoping Plan intended to help the state meet its 2030 GHG target. CARB administers many of the major climate policies, but some policies are administered by other state agencies. For example, the renewable portfolio standards and energy efficiency programs are largely administered by the California Public Utilities Commission and the California Energy Commission. Many of these policies have been operating for the last several years to help the state meet its 2020 target and are being expanded to achieve the 2030 goals. In some cases, such as the renewable portfolio standard, the Legislature provides specific direction to agencies about which policies should be implemented to meet the goals and how they are designed. In other cases, such as the low carbon fuel standard (LCFS), state agencies are given discretion to determine whether a policy is implemented and how.
Figure 4
Major Policies to Meet Statewide Greenhouse Gas Limits
|
Cap‑and‑Trade. Regulation that establishes a “cap” on overall emissions from large emitters by issuing a limited number of permits (also known as allowances). Allowances can be bought and sold (traded), which creates a market price for allowances and an incentive for lowest cost reductions. |
|
|
Short‑Lived Climate Pollutants. Regulations and incentives intended to reduce certain types of emissions from dairies, landfills, and refrigeration equipment. |
|
|
Renewable Portfolio Standard. Regulations that require utilities to provide a certain percentage of electricity from qualifying renewable sources, such as wind and solar. |
|
|
Energy Efficiency. Regulations and financial incentives to encourage more efficient energy use in commercial buildings, homes, and manufacturing facilities. |
|
|
Low Carbon Fuel Standard. Regulation that requires transportation fuel suppliers to reduce the amount of greenhouse gases per unit of fuel used in California—also known as carbon intensity of fuels. |
|
|
Vehicle‑Related Programs. Regulations and incentives to encourage more efficient light‑ and heavy‑duty vehicles, as well as promote certain types of technologies such as electric vehicles. |
|
|
Vehicle Miles Traveled. Planning strategies and financial incentives intended to reduce the amount of light‑duty vehicle use through such things as increased transit and changes to land use. |
Policies Have a Wide Variety of Effects
Social Benefits and Costs
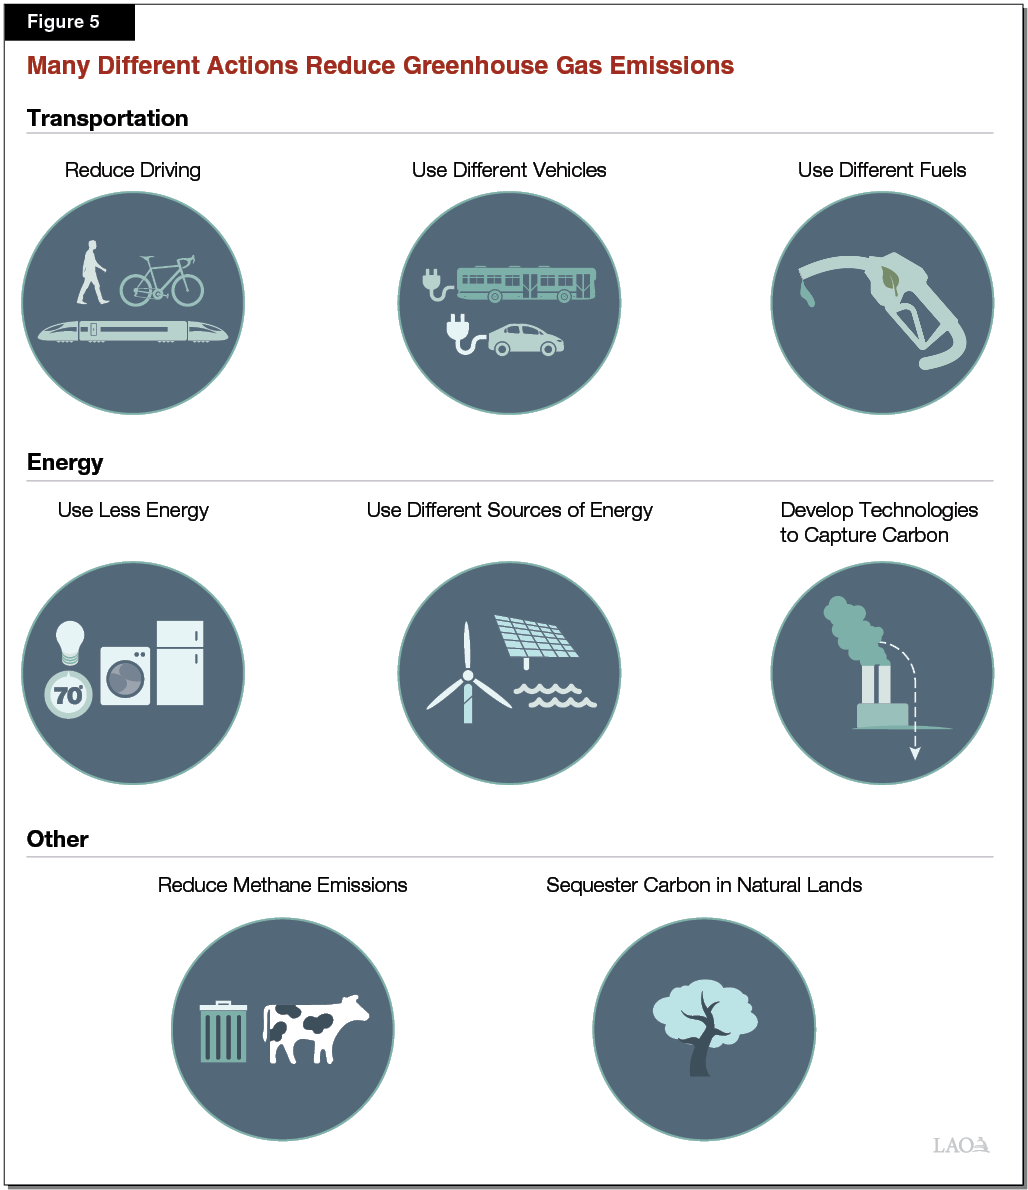
Households, businesses, and governments can take a variety of different actions to reduce emissions. Figure 5 provides examples of some of the major actions. State policies encourage these actions through market incentives, regulations, and financial subsidies. For example, building regulations require new home builders to install rooftop solar. However, quantifying the economic effects of these actions is challenging because they each have different trade‑offs—both monetary and nonmonetary. Economists often attempt to measure these trade‑offs in terms of “social” costs and benefits. In short, this is the net value of what society as a whole gains and loses by reallocating resources—such as time and money—to a different set of activities. One advantage of using social costs and benefits to measure economic effects is that it allows policymakers to compare across a wide variety of different types of costs and benefits. For example, social benefits includes the estimated value of environmental benefits (such as GHG reductions), even though they are typically not bought and sold in a marketplace. We discuss the major types of social benefits and costs in more detail below.
We note that a wide variety of other metrics—including energy prices, jobs, and gross domestic product (GDP)—are often used to describe the economic effects of climate change policies. Although these metrics can provide information about some of the effects of state policies, they often have key limitations as a primary tool for evaluating overall economic effects. For example, the effect on gasoline prices often does not reflect the net economic costs of a policy because (1) it includes economic transfers, which are distinct from economic costs, and (2) it ignores other costs that are not reflected in gasoline prices. (Please see the nearby box for a detailed discussion of the various limitations of commonly used metrics.)
Commonly Used Metrics for Evaluation Have Limitations
A few metrics that are commonly used to describe the economic effects of climate policies include energy prices, jobs, and gross domestic product (GDP). Although these metrics can provide some useful information, as we discuss below, each of them has key limitations that policymakers should consider when evaluating state climate policies. Given these limitations, we caution against using any one of them as the primary metric for evaluating the net economic effects of a policy.
Effects on Energy Prices
Climate policies often affect prices for different types of energy, such as electricity, natural gas, gasoline, and/or diesel fuel. These changes can have significant effects on certain types of energy spending, but they are often poor measures of the overall net economic effects of a policy. This is because they ignore other costs, benefits, and transfers that might occur as a result of a policy. For example, changes in gasoline prices are often used to describe the costs of a policy. However, gasoline price changes fail to capture overall net economic costs in a couple of key ways.
Often Reflects Economic Transfers, Not Economic Costs. In some cases, higher gasoline prices paid by households and businesses is simply a transfer of money, rather than a net economic cost. For example, by design, cap‑and‑trade increases gasoline prices as a way to encourage less consumption. The price increase has two main effects:
- Economic Costs. There are economic costs associated with actions taken to reduce gasoline consumption. The economic costs could be such things as the cost of buying a more efficient vehicle or the time lost because a person takes an alternative form of transportation that takes longer (such as public transit). These changes in behavior—and their costs—are often difficult to identify and measure.
- Economic Transfers. In contrast, the most visible effect of the policy—and the one that is reflected in gasoline prices—reflects a transfer of money from drivers to state government. Essentially, these transfers occur because the state auctions allowances to transportation fuel suppliers and generates revenue. Transportation fuel suppliers then pass the costs of purchasing allowances on to drivers in the form of higher gasoline prices. In effect, drivers pay for the allowances to cover the emissions from the gasoline they continue to consume. The net effect of these actions is largely a shift of money from households that purchase gasoline to the state government, not a net economic cost.
Importantly, the transfers are distinct from economic costs because the government can redistribute it back to households in a way that offsets the higher gasoline prices and still maintains the incentive to reduce gasoline consumption, or use the cap‑and‑trade auction revenue for other socially beneficial activities. For example, if the funds were rebated to households on a lump‑sum basis, many households could actually have more money as a result of the transfer and still have an incentive to lower their fuel consumption.
Ignores Other Costs That Do Not Affect Gasoline Prices. Many of the state’s policies have costs that are not reflected in gasoline prices. For example, the renewable portfolio standard can increase electricity prices, but likely has very little effect on gasoline prices. Similarly, vehicle efficiency standards impose costs related to producing more efficient vehicles, but could actually decrease gasoline prices by reducing demand for gasoline. As a result, changes in gasoline prices provide no information about the relative costs of these policies.
Jobs
Although stakeholders often use changes in employment to illustrate the economic effects of policies, economists generally express caution about using this as a primary metric for climate policy evaluation. First, many estimates of employment effects are misleading because they show changes in employment for a subset of specific industries, such as renewable energy providers or fossil fuel producers. They often do not show how a policy affects overall employment because they ignore changes in other parts of the economy. There might be significant effects on some workers who lose jobs in certain industries, which merits some attention from policymakers. However, most research suggests that overall changes in employment from climate policies are relatively modest, at least in the long run.
Second, even if government policies create additional net jobs, this job creation often comes with trade‑offs. This is because the money used to pay the wages of these additional jobs comes from somewhere else in the economy. For example, the money used to pay these workers could come from households paying higher prices or higher taxes or fees. These households would have otherwise spent the money on some other economic activity. Similarly, businesses might have otherwise used the money to increase wages for existing jobs, invest in new technologies, or expand production.
GDP
GDP is a common, and generally reasonable, measure of many types of economic activity. It measures the market value of all final goods and services produced. However, it does not measure all things that are valuable to households. For example, such things as environmental benefits, leisure time, and product quality are not fully captured in this measure. In addition, modeling the effects of climate policies on statewide GDP can be difficult given the size of California’s economy and the complicated nature of economic relationships.
Types of Social Benefits
GHG Reductions. Reducing GHGs has a social benefit because it reduces the damages associated with climate change. The estimated global damages from a ton of carbon dioxide—the most common GHG—is known as the Social Cost of Carbon (SCC). Some of the estimated damages included in SCC are higher heat‑related mortality, increased flood damages, and increased energy costs. The magnitude of these and other costs is the subject of much research and debate. The most widely used SCC estimate was developed by the Obama Administration’s Interagency Working Group on the Social Cost of Greenhouse Gases. Its central estimate was roughly $50 per ton. However, there is substantial uncertainty around and disagreement about this estimate. Some economists estimate the SCC is about $10 per ton while others estimate the cost is hundreds of dollars per ton. The variation is caused by differences in modeling methods and assumptions, including discount rates.
While the specific value of GHG reductions is subject to uncertainty, the following issues are important considerations when evaluating the benefits of GHG reductions in California:
- Effects of GHGs Are Global. Unlike other types of air pollutants, GHGs—mainly carbon dioxide—are dispersed into the global atmosphere. This means the costs are borne by people around the world. As a result, most of the benefits of reducing GHGs in California accrue to other parts of the world. Similarly, reductions in other parts of the world will have benefits in California.
- California Represents a Very Small Share of Global GHGs. California emits roughly 1 percent of global GHGs. Without reductions in other jurisdictions, large reductions in California’s GHG emissions will have almost no effect on global climate change. On the other hand, policies that lead to reductions in other jurisdictions will have benefits that exceed the value of the reductions that occur only within California. As we discuss later in the report, this is critical context as the Legislature designs its climate policies and evaluates their overall effects.
Co‑Benefits. Many policies that reduce GHGs have other benefits—sometimes called co‑benefits. Some examples include:
- Reduction in Co‑Pollutants. Many activities that reduce GHGs also reduce other types of pollutants, known as co‑pollutants. For example, incentives to replace older diesel engines with newer technologies can reduce GHGs (carbon dioxide), as well as criteria pollutants (nitrous oxides) and toxic air pollutants (diesel particulate matter). Reducing these co‑pollutants has public health benefits by improving local and regional air quality.
- Reduced Energy Costs. Policies that promote efficiency—such as efficiency standards for buildings, appliances, and vehicles—can lower the amount of money spent on energy or fuel. This means households and businesses can use the money for other activities.
- Correcting Other Market Distortions. In some cases, policies can reduce existing market distortions that have economic costs. For example, revenue from cap‑and‑trade auctions could be used to reduce other state taxes that reduce economic activity, such as income taxes and certain types of sales taxes.
Types of Social Costs
In concept, economic costs occur when people give up something valuable as a result of actions taken to reduce emissions—also referred to as “opportunity costs.” In practice, this means households have less money to spend on goods and services they value, or the products they consume have less of some other valuable attribute—such as reliability, convenience, or performance. We explain some of the general types of costs in more detail below. These include both direct costs—explicit and implicit—as well as the indirect effects that stem from those direct costs.
Explicit Direct Costs. Direct costs are borne by businesses or consumers that are directly affected by a state policy. Some direct costs are relatively explicit because they require additional monetary payments. For example, regulations might force utilities to pay for more expensive sources of electricity (such as renewables) or require businesses to produce more expensive goods (such as more energy efficient products). Businesses also often have administrative costs to comply with a regulation, including internal staff to ensure compliance and the payment of government fees to support state agencies that implement the regulation.
Although many of these costs are initially borne by the businesses—such as fuel suppliers, utilities, or manufacturers—the costs are ultimately borne by households. For example, many of the business’ costs are likely passed on to consumers through higher product prices. This often means consumers have less money to spend on other goods and services. When businesses cannot pass costs on to consumers through higher prices, the costs are still borne by households in the form of lower wages for workers and/or lower profits for households that own those businesses (including shareholders).
Implicit Direct Costs. Some direct costs are not explicit monetary losses, but households nonetheless give up something valuable. These are sometimes called implicit costs. Some examples include:
- In response to higher prices for gasoline, people might chose an alternative mode of transportation to get to work (such as rail or transit). In this scenario, they might give up (1) leisure time at home if the trip takes longer, (2) convenience related to being able to travel when you want rather than being on a fixed transit schedule, and/or (3) comfort related to being in their own vehicle rather than sharing space on transit.
- In response to higher electricity prices, households might adjust their thermostat to use their furnace and air conditioning less often. This could make their homes somewhat less comfortable in the summer and winter.
- Car manufacturers might meet electric vehicle requirements by producing vehicles that have less range, or other attributes that drivers value.
- Prices for certain goods that are GHG‑intensive—such as certain processed food products—become more expensive, thereby encouraging consumers to purchase less of it. As a result, households could lose the value they would have otherwise gotten from consuming the item.
Although implicit costs are often more difficult to quantify than direct monetary payments, they nonetheless reflect important costs because households trade off something valuable, such as comfort, convenience, or time.
Indirect Effects. Some direct costs have indirect effects. For example, in response to higher energy prices, households and businesses will change their overall spending on energy, as well as other goods and services. As a result, markets for these other goods will adjust through changes in prices, output, and wages. As we discuss in more detail below, estimating indirect costs can be difficult because it requires more complex models and a wide variety of assumptions about how different businesses and households interact.
Distributional Effects
In addition to overall net economic effects, the distribution of costs and benefits is often an important criterion for evaluating policies. These effects can vary across households based on such things as geographic location and income level. Below, we discuss some key distributional considerations when evaluating state climate policies.
Distribution of GHG Benefits Mostly Global, Co‑Benefits More Local. As discussed above, the direct benefits of GHG reductions are distributed across the globe. The location of where the emissions are reduced does not have any impact on who benefits. However, many of the potential co‑benefits from actions taken to reduce GHGs in California—such as co‑pollutant reductions—accrue primarily to California residents. In addition, the location of the reduced emissions does affect who receives the co‑benefits. For example, programs to replace diesel freight equipment at ports in Southern California produce air quality benefits to a different group of people than programs that replace agricultural equipment in the Central Valley.
Distribution of Costs Depends on Who Produces and Consumes GHG‑Intensive Goods. Costs are generally greater for households that spend more on GHG‑intensive products (such as electricity and gasoline) or receive income from GHG‑intensive industries (such as workers or shareholders). However, the distribution of costs ultimately depend on which specific policies are implemented. For example, a policy that increases costs to provide electricity disproportionately affects households that spend a greater share of their income on electricity or work for businesses that produce or consume a lot of electricity. On the other hand, policies that increase costs for transportation fuels have a greater effect on households that consume a lot of transportation fuels or work for businesses that produce or consume a lot of transportation fuels. Furthermore, as we discuss below, the distributional effects of carbon pricing policies (such as cap‑and‑trade) depend heavily on how the government allocates allowances and auction revenue.
Some Policies Result in Substantial Economic Transfers. As discussed earlier, some of the most visible effects of state climate policies are transfers of money, rather than net economic costs. For example, cap‑and‑trade results in a large transfer of money from households and businesses that pay—either directly or indirectly—for allowances needed to cover their emissions. This increases costs for these households and businesses. However, these allowances are generally sold by the state government and utilities, who then use the revenue to benefit certain households and businesses. Currently, utilities mostly use the revenue to provide bill credits to customers and the state funds a range of different programs. As a result, the net distributional effects of the policy largely depend on how the auction revenue is allocated to different businesses and households.
Key Challenges in Estimating Policy Effects
There are a variety of challenges to estimating the effects of California’s climate policies—both before (prospective) and after (retrospective) they have been implemented. In general, the accuracy of any estimates depend on how effectively researchers address these challenges. Below, we discuss the challenges of measuring (1) effects of factors unrelated to climate policy, (2) effects not reflected in the state’s GHG inventory, (3) implicit and indirect effects, and (4) the interactions with other policies.
Controlling for Factors Unrelated to Climate Policy. Many different factors affect the costs and benefits of meeting the state’s GHG limits, including economic conditions, technological changes, and federal policies that would have otherwise occurred in the absence of state climate policies. Controlling for these external factors is a key challenge when trying to isolate the effects of just state policies. For example, if economic growth is slow or negative, emissions could decline even without the implementation of state climate policies. Similarly, unexpected technological advancements for low‑GHG technologies (and lower prices for these technologies) can reduce emissions absent state policies. For retrospective analyses, it is difficult to know how these and other factors would have changed emissions in the absence of state policy. Similarly, for prospective analyses of the effects of state climate policies, forecasting economic conditions and technological advancements over the next 10 to 12 years is subject to substantial uncertainty.
Assessing GHG Effects That Extend Beyond State’s Inventory. CARB uses its GHG inventory to track the state’s progress in meeting the statewide emissions limits. As discussed earlier, the inventory includes emissions that occur in‑state, as well as emissions associated with electricity that is imported from other states. While this is a reasonable starting point for measuring California’s GHG emissions given various technical and financial constraints, it does not fully capture the impact of activities in California on global GHGs. For example, the current GHG inventory does not reflect the effect of the following:
- Biofuels. The state inventory generally excludes emissions related to burning biofuels, such as ethanol used in cars and biodiesel for trucks. This is consistent with common GHG accounting principles, which assume that carbon from the biological materials used to produce the fuels would have eventually been released back to the atmosphere as part of the natural carbon cycle. However, in some cases, there are likely other emissions related to indirect land use changes needed to grow plants used to produce biofuels. For example, CARB’s LCFS program estimates emissions associated with converting forests and pasturelands to grow crops that are used to produce ethanol.
- “Upstream” Emissions From Imports. The inventory includes emissions associated with consuming fossil fuels in California. However, it does not capture all of the emissions from producing these fuels—also known as upstream emissions. For example, emissions related to oil extraction and refining that occurs in California are included, but upstream emissions from gasoline that is imported from out‑of‑state are not. Emissions associated with producing other goods that are imported into California, such as cement, are not currently estimated. It is worth noting that CARB currently estimates the upstream emissions for transportation fuels, but they are not included in the inventory.
- Leakage. Policies that increase the costs of producing goods in California could result in a shift in some production to other states or countries. In this scenario, emissions would decline in California, but increase elsewhere. This is known as emissions leakage.
- Natural and Working Lands. The net change to carbon stored in plants, soils, and wetlands—commonly known as “natural and working lands”—is not currently included the state’s inventory. Chapter 368 of 2016 (SB 859, Committee on Budget and Fiscal Review) requires CARB to develop an inventory for natural and working lands by the end of 2018.
- Offsets. Entities subject to the state’s cap‑and‑trade program can cover their emissions by purchasing either allowances or offsets. (The number of offsets that can be used is subject to limitations.) Offsets are generated through certain types of projects that reduce GHGs from sources not covered by the emissions cap. Most of these reductions (1) occur out‑of‑state or (2) are from sources that are not currently included in the state’s inventory, such as forestry activities that store more carbon. As a result, any reductions that occur from these projects are not counted in the inventory.
Measuring Implicit and Indirect Effects. Most available estimates of economic costs—including those used in CARB’s 2017 Scoping Plan—are largely based on what are known as “bottom‑up,” “engineering,” or “techno‑economic” models. These models generally focus on the explicit costs and benefits of adopting certain technologies. Researchers use their understanding of the technologies that might be used to reduce emissions (such as electric vehicles and more efficient household appliances) and estimate the monetary costs and benefits to produce, install, and/or operate these technologies. Although these estimates can provide information about some of the effects of these changes, they also have significant limitations. For example, they often ignore how the technological changes might affect producer and consumer behavior. They also do not assess implicit costs associated with the new technologies—for example, whether a product loses some other type of attribute that households value, such as reliability, performance, or convenience.
Researchers also use outputs from engineering models that estimate explicit direct costs as inputs into economic models that estimate indirect economic effects. For example, CARB uses an economic model to estimate effects on employment and GDP. Such models require a substantial number of assumptions about how households and businesses behave and interact. As we discussed in our 2017 report, Improving California’s Regulatory Analysis, the Legislature should be cautious about relying heavily on these estimates. This is because they have substantial uncertainty and it can be difficult for policymakers, stakeholders, and the public to evaluate some of the underlying modeling and assumptions that drive the results.
Considering Interactions With Other Policies. State climate policies often interact with other federal, state, and local policies in complicated ways. For example, as we discussed in our 2016 report, Cap‑and‑Trade Revenues: Strategies for Promoting Legislative Priorities, policies that reduce emissions in capped sectors might simply change the source of emissions without changing the overall level of emissions. This is because a policy that reduces emissions from one covered entity would free‑up an allowance to be used by a different covered entity. As a result, there would be no net change in emissions. In addition, as we discuss in our companion report, Assessing California’s Climate Policies—Transportation, the state has a wide variety of policies to promote zero‑emission vehicles that interact with one another, as well as with federal policies meant to encourage fuel efficiency. These types of interactions make it difficult to evaluate the effects of any one state policy.
Issues for Legislative Consideration
As discussed above, the broad scope of state climate policies, the wide variety of benefits and costs they generate, and the complicated interactions between them make it challenging to estimate their effects. In light of these challenges, we identify below a few issues for the Legislature to consider. Our comments aim to inform future climate policy design and evaluation in a way that helps the Legislature achieve its GHG goals in the most cost‑effective manner.
Use Carbon Pricing to Achieve Low‑Cost GHG Reductions. There are benefits associated with reducing GHGs, but there are also costs that have real impacts on households. These costs are likely to become more significant as the state’s GHG reduction goals become more ambitious. As a result, it is important for the state to prioritize strategies that reduce GHGs at the lowest cost. A large body of academic literature indicates carbon pricing policies, such as cap‑and‑trade, are a more cost‑effective strategy to reduce emissions than other regulatory strategies. The potential for lower costs stems from the fact that the businesses and households that have to pay the carbon price have better information than policymakers and regulators about which reduction activities are least costly. (For additional information on how cap‑and‑trade encourages cost‑effective GHG reductions, see our 2017 report The 2017‑18 Budget: Cap‑and‑Trade.)
It is also worth noting that the overall effects—especially the distributional effects—of cap‑and‑trade largely depend on how the allowances and revenue are allocated. We continue to recommend the Legislature consider using most or all of the revenue to offset the higher energy payments (which we characterize as transfers above) by providing rebates or reducing other taxes, particularly if allowance prices increase significantly in future years.
Complementary Policies Should Be Well‑Targeted and Justified. There are some limited instances when non‑carbon pricing policies (often referred to as “complementary policies”) can help encourage socially beneficial activities that reduce GHGs. Two such activities include:
- Innovation. Most economists think that private businesses underinvest in innovation. This is because many of the benefits from the knowledge that is created from this innovative technology will “spillover” to other businesses, rather than being captured as profits for the innovator. Thus, there is an economic argument for government support to help promote greater research and development. In addition, as discussed below, the largest benefit of California’s policies could be related to how they affect emissions in other jurisdictions. Promoting technological innovation could make emission reduction activities cheaper for other jurisdictions to implement.
- Addressing Other Environmental Pollution. Certain regions and communities in California have environmental problems beyond climate change, such as poor air quality. Many of the policies that reduce GHGs can also reduce these other sources of pollution, such as criteria and toxic air pollutants.
Even with a carbon price in place, there could be a rationale for targeted policies that address these types of issues. However, when considering these other policies, the Legislature should ensure that there is strong evidence of other “market failures” that a carbon price does not adequately address prior to adopting them. This will help ensure there is a basis for adopting complementary policies, even if they are more costly ways to reduce GHGs. In addition, the Legislature should ensure that (1) the policies are designed in a way that achieves these other goals most effectively and (2) these other benefits outweigh the higher costs.
Effects on Emissions in Other Jurisdictions Are Important. California emits a very small portion of global GHGs. As a result, perhaps the most significant effect of California’s climate policies will be how they influence GHG emissions in other jurisdictions. For example, demonstrating to other countries how to design and implement cost‑effective policies to reduce GHGs could make them more likely to implement such policies. In addition, policies that encourage innovation and low‑GHG technologies could make such technologies less expensive. As a result, this could increase the likelihood of these technologies being adopted in other jurisdictions. The Legislature should design and evaluate its climate policies, in part, with a focus on which policies are most likely to encourage GHG reductions in other jurisdictions. The value of these GHG reductions could far exceed those that occur strictly within California.
Evaluation Is Especially Critical for State Climate Policies. Evaluation is an important aspect of all state policies, not just those related to climate change. They help inform future decisions about whether to continue, expand, modify, or eliminate policies or programs. In our view, robust evaluation of climate policies is even more critical than for typical state policies, for a couple of reasons. First, climate policies are among the broadest, and potentially costly, set of state regulatory policies. Given the magnitude of the effects, it is particularly important to ensure that the state is implementing such policies in an effective manner. Second, as discussed above, the most significant impact California can have on global GHGs is likely going to be how its policies affect emissions in other jurisdictions. For example, demonstrating which policies cost‑effectively reduce emissions (and which ones do not) can provide valuable information to other jurisdictions considering policies to reduce emissions. A high‑quality evaluation of the effects of California’s policies—including what works and what does not work—is a critical part of such a demonstration.
Establishing a robust system to evaluate state climate policies helps ensure the Legislature—and other entities—have more complete information on the overall effects of these polices. This information could help the Legislature make better decisions about which policies or programs to adopt, modify, or eliminate in the future. To ensure the state has such a system in place, the Legislature might want to consider the following actions:
- Require Additional Information in Statewide GHG Inventory Reports. As discussed above, there are certain emissions currently not included in CARB’s statewide GHG inventory reports. The Legislature could direct CARB to include some of this information in its future reports. Certain information—such as offsets and upstream transportation fuel emissions—is already being collected and would simply need to be reported alongside the current inventory. Other types of effects—such as leakage—are more difficult, and potentially costly, to estimate.
- Require Greater Use of Independent Reviewers to Assess Policy Effects. In addition, the Legislature could require agencies to make greater use of independent reviewers (such as academic economists) to assess the economic effects of policies, both prospectively and retrospectively. For example, the Legislature has created the Independent Emissions Market Advisory Committee to report on the environmental and economic performance of cap‑and‑trade and other relevant climate policies. As we discussed in our December 2017 report, Cap‑and‑Trade Extension: Issues for Legislative Oversight, the Legislature will want to be clear about the role of this committee, or similar committees, to ensure it provides the information that is most valuable to policymakers.
- Require Early Planning of Retrospective Evaluations. The Legislature could also require agencies, perhaps in collaboration with independent researchers or other oversight entities, to plan for retrospective evaluations as regulations are being developed. (Please see our report 2017 report, Improving California’s Regulatory Analysis, for a more detailed discussion of this issue.)
- Prioritize and Design Policies That Promote Transparency. Lastly, the Legislature could prioritize and design policies that promote transparency about their costs and/or benefits. For example, cap‑and‑trade and LCFS have market prices for allowances and credits, respectively. These prices provide information on the marginal costs of reducing a ton of GHG under each program. Such information is typically not available in other regulatory programs and, as a result, the costs are often much less transparent.
Conclusion
State climate policies have many different types of effects, and many of them are difficult to quantify. This report provides a general overview of some of the key conceptual issues to consider when assessing the economic impacts and benefits of state climate policies. We also identify some general issues for the Legislature to consider, which are aimed at promoting climate policies that are designed in a way that maximize benefits and minimize costs.
A companion report, Assessing California’s Climate Policies—Transportation, provides more detailed comments about the state’s major transportation climate policies. In the future, consistent with the requirements of AB 398, we plan to issue additional reports on the effects of other state policies intended to reduce GHGs. These reports aim to inform future legislative decisions about what mix of policies can most effectively achieve the Legislature’s GHG goals.