
December 21, 2018
Assessing California's Climate Policies—Transportation
- Introduction
- Background
- Key Takeaways From Review of Major Policies
- Light‑Duty Vehicles
- Heavy‑Duty Vehicles
- Low Carbon Fuels
- Vehicle Miles Traveled
- Conclusion
Executive Summary
Overview of Report. Chapter 135 of 2017 (AB 398, E. Garcia) requires our office to annually report on the economic impacts and benefits of California’s statutory greenhouse gas (GHG) emission goals—statewide emissions to 1990 levels by 2020 and to 40 percent below 1990 levels by 2030. This report provides our assessment of the effects, of major policies in the transportation sector intended to help meet these goals, as well as identifies some key issues for the Legislature to consider as it makes future policy and budget decisions. In a companion report, Assessing California’s Climate Policies—An Overview, we describe the general types of economic effects of state climate policies, key challenges in measuring these effects, and broad issues for the Legislature to consider when designing and evaluating its climate policies.
State Has Many Policies to Reduce Transportation Emissions. Transportation is the largest source of California’s GHG emissions—mostly from light‑duty passenger vehicles. Emissions declined from 2006 to 2016, but have increased slightly in recent years. As we discuss in this report, the state has many policies in place to reduce GHG emissions in the transportation sector. The major categories of programs include (1) reducing emissions from light‑duty vehicles, (2) reducing emissions from heavy‑duty vehicles, (3) increasing the use of lower carbon fuels, and (4) reducing the number of vehicle miles traveled. These programs are intended to work in a variety of ways. For example, some programs provide financial assistance incentives to reduce the cost of adopting lower emission technologies, while other programs are designed to increase the costs of using higher emission technologies. Some programs are targeted towards consumers of fuel, while other programs are targeted towards vehicle manufacturers and fuel producers.
Key Takeaways From Review of Major Policies. In this report, we assess each of the four major categories of programs in terms of their costs and benefits, as well as identify key issues for legislative consideration. Based on our review, we identified several important takeaways. Broadly, we find that:
- Overall Economic Impacts and Benefits Are Unclear. The overall effects of the state’s policies aimed at reducing transportation GHGs are largely unclear. The Legislature might want to consider options to facilitate a more consistent evaluation of these policies, such as requiring regular retrospective evaluations of these policies and prioritizing policies that are designed in ways that facilitate evaluation.
- Large Number of Policies Targeting Transportation Emissions Creates Challenges. Although implementing multiple programs could be justified in some instances, the wide range of programs creates several challenges, including (1) interactions whereby emission reductions from one policy offset those from a different policy, (2) challenges in evaluating the net effects of each policy, (3) a potential lack of coordination among policies, and (4) higher administrative costs.
- Policies Are Relatively Costly Ways to Reduce GHGs, but Could Be Valuable in Limited Instances. The state’s transportation‑specific policies are generally much more costly ways to reduce emissions than carbon pricing policies, such as cap‑and‑trade. As a result, the Legislature might want to consider relying more heavily on cap‑and‑trade to achieve low‑cost GHG reductions. In some limited instances, there is a rationale for targeted policies that complement carbon pricing—such as those that promote public zero‑emission vehicle fueling infrastructure and that promote technological innovation. Some policies might also be justified based on their ability to reduce co‑pollutants.
- Effect on Emissions in Other Jurisdictions Unclear. The effect of California’s transportation policies on emission reductions in other jurisdictions is especially difficult to quantify. In concept, policies such as those aimed at supporting technological innovation seem most likely to achieve “spillover” benefits from reductions in other jurisdictions.
Introduction
Chapter 135 of 2017 (AB 398, E. Garcia) requires our office to report annually on the economic impacts and benefits of the state’s greenhouse gas (GHG) limits. This report is one of two 2018 reports that fulfill this requirement. In a companion report, Assessing California’s Climate Policies—An Overview, we provide conceptual overview of the overall effects of the state’s GHG reduction policies. In this report, we assess in more detail the effects of the state’s major GHG policies aimed at reducing emissions from the transportation sector, specifically policies focused on light‑duty vehicles, heavy‑duty vehicles, low carbon fuels, and vehicle miles traveled (VMT). Our assessment is largely based on our review of available program data, agency reports, and academic studies. We begin the report by providing background information on California’s major GHG policies in the transportation sector and summarizing some of the key takeaways from our review. Then, for each group of policies, we (1) provide an overview of the policies, (2) assess the economic costs and benefits of those policies, and (3) identify issues for the Legislature to consider as it continues to modify and develop policies to achieve its statewide GHG goals.
Background
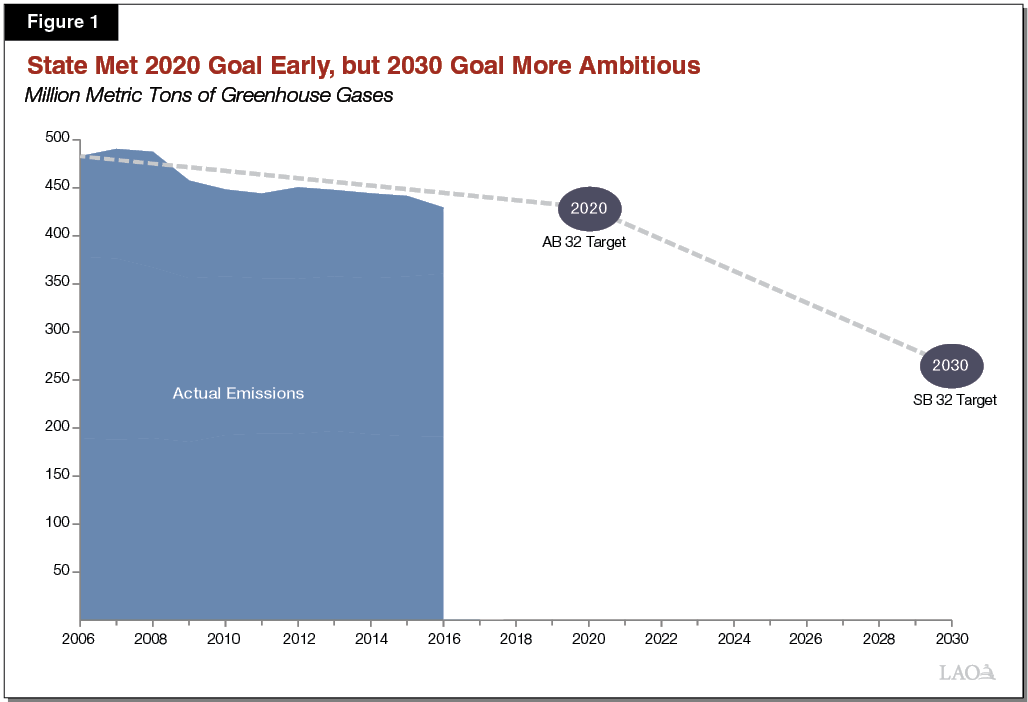
State Has Ambitious GHG Reduction Goals. Chapter 488 of 2006 (AB 32, Núñez/Pavley) established the goal of limiting GHG emissions statewide to 1990 levels—431 million metric tons of carbon dioxide equivalent (CO2e)—by 2020. In 2016, Chapter 249 (SB 32, Pavley) extended the limit to 40 percent below 1990 levels—259 million metric tons CO2e—by 2030. As shown in Figure 1, emissions have decreased since AB 32 was enacted and were already below the 2020 target in 2016. However, the rate of reductions needed to reach the SB 32 target are much greater.
Transportation Is Largest Source of State GHG Emissions. The California Air Resources Board (CARB) maintains a GHG inventory that estimates emissions from most sectors of the state. According to the inventory, there were 429 million tons CO2e emitted in California in 2016. As shown in Figure 2, these emissions came from a variety of sectors, with transportation being the largest source of emissions (39 percent).
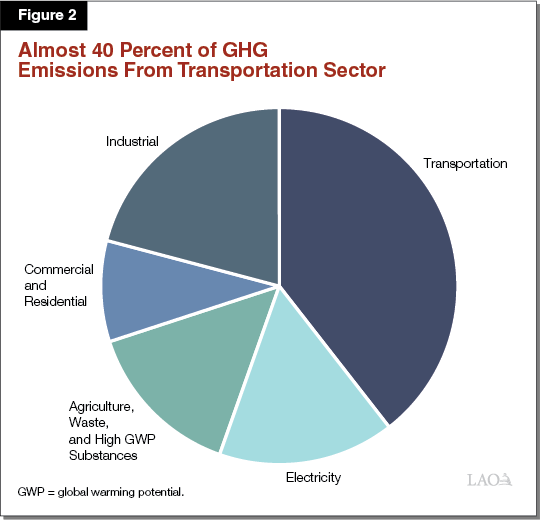
We note that CARB’s emission estimates for the transportation sector are based on tailpipe emissions only and do not include emissions associated with the extraction or production of gasoline or diesel products—also known as “upstream” emissions. To the extent that these activities occur in California (as does much of the refining activity for fuel sold in the state), the inventory reflects estimates for those emissions in other sectors (such as industrial sector). In addition, the estimates assume no net carbon dioxide emissions from combusting biofuels, such as ethanol used in cars and biodiesel for trucks.
In recent years, roughly 90 percent of emissions from the transportation sector have come from on‑road sources, specifically passenger vehicles (69 percent) and heavy‑duty vehicles (22 percent). The remaining emissions have come from a variety of other sources, including ships, airplanes, and rail.
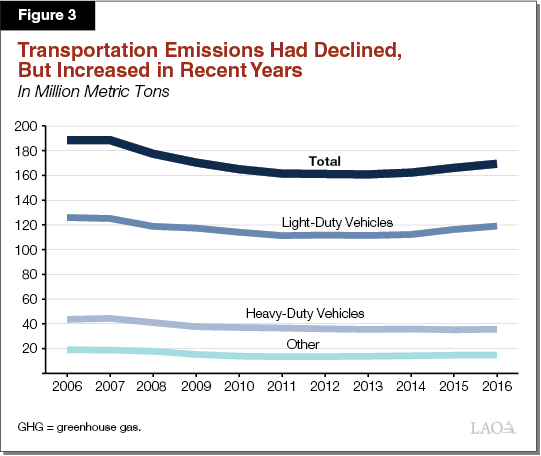
Transportation Emissions Have Been Increasing in Recent Years. Figure 3 shows the level of emissions from the transportation sector from 2006 to 2016 (most recent available data). As shown in the figure, overall transportation emissions declined by 14 percent from 2007 to 2011. This includes emission declines from light‑duty vehicles, medium‑ and heavy‑duty vehicles (together referred to as heavy‑duty vehicles), and other types of transportation. However, transportation emissions have increased since 2013, primarily from light‑duty vehicles. These overall trends are affected by a range of factors, including economic conditions and state policies (such as those intended to reduce emissions).
State Has Many Policies to Reduce Transportation Emissions. The state has many policies in place to reduce GHG emissions in the transportation sector. For the purpose of this report, we have categorized the major state transportation‑related programs into four major categories: (1) reducing emissions from light‑duty vehicles, (2) reducing emissions from heavy‑duty vehicles, (3) increasing the use of lower carbon fuels, and (4) reducing VMT. As discussed in more detail later in this report, these programs are intended to work in a variety of ways. For example, some programs provide financial (or other) incentives to reduce the costs of adopting lower‑emission technologies, while other programs are designed to increase the costs of using higher‑emission technologies. Some programs are targeted towards consumers of fuels (individual drivers, businesses, and governments that rely on vehicles), while other programs are targeted towards vehicle manufacturers and fuel producers. Figure 4 summarizes the various programs designed to reduce GHG emissions in the transportation sector.
Figure 4
State Oversees Various Programs Designed to Reduce Greenhouse Gas (GHG) Emissions in Transportation Sector
|
Light‑Duty Vehicle Programs |
|
|
|
|
|
|
|
Heavy‑Duty Vehicle Incentives |
|
|
|
|
|
Low Carbon Fuels |
|
|
Vehicle Miles Traveled |
|
In addition to the major state programs identified in Figure 4, the state oversees certain programs that are smaller in scale, as well as some programs that primarily are targeted at other goals, such as reducing criteria air pollutants. There are also a number of other state programs that—while not targeted specifically at the transportation sector—could impact GHG emissions in this sector. The clearest example of this is the state’s cap‑and‑trade program. In addition, there are a number of federal programs and policies that are designed to reduce transportation emissions. While the above programs could impact GHG emissions, this report primarily focuses on the state’s major transportation programs.
Key Takeaways From Review of Major Policies
Based on our review of the various polices designed to reduce GHG emissions in the transportation sector, we identified several important takeaways. Broadly, we find that (1) overall economic effects, including effects on GHG emissions, are unclear; (2) the large number of different policies creates various challenges for such things as program coordination and evaluation; and (3) the policies are generally more costly strategies to reduce GHGs than alternatives, such as cap‑and‑trade, although they could provide other important benefits in certain limited circumstances.
Overall Economic Impacts and Benefits Are Unclear. The overall effects of the state’s policies aimed at reducing transportation GHGs—both positive and negative—are largely unclear. The amount and quality of available information about each major program varies significantly, but, in many cases, the available research on major effects is limited. Most notably, there are very few retrospective analyses—conducted by outside researchers or state agencies—that isolate the effects of each policy from other important factors such as economic conditions and other policies. As we discuss in our companion report, these types of analyses are often difficult for a variety of reasons. For example, controlling for other factors that affect emissions (such as economic conditions) and quantifying implicit and indirect effects often require advanced statistical methods. In our view, such analyses are critical for understanding the actual effects of state policies. In our assessment of each major category of policies later in this report, we identify areas for future research that could help address key gaps in knowledge.
The Legislature might want to consider taking various steps to facilitate greater, more consistent evaluation of state climate policies. For instance, the Legislature could require agencies to use an independent expert review panel to comment on the estimated costs and benefits of programs before they are adopted. It could also require departments to conduct retrospective evaluations of major programs after they are implemented. As part of this process, the Legislature might also want to require state agencies to establish a plan for this retrospective evaluation before the program is implemented. These additional evaluation activities would likely result in additional state costs, but could improve the available information on the effects of these programs. Finally, the Legislature could (1) prioritize policies that lend themselves to an evaluation of costs, such as market‑based policies where credit prices provide information on program costs, or (2) design programs in a way that facilitate evaluation, such as piloting programs in certain parts of the state.
Large Number of Policies Targeting Transportation Emissions Creates Challenges. The wide range of state (and federal) programs intended to reduce emissions can overlap and interact in complex ways. For example, there are a wide variety of policies aimed at promoting light‑duty zero‑emission vehicles (ZEVs) such as battery electric vehicles. These include a few different types of consumer rebates for ZEV purchases, a regulation requiring manufacturers to produce a minimum number of ZEVs, and funding for charging and refueling infrastructure. There are likely some limited cases where more than one program is needed to effectively achieve a policy goal. For instance, separate (but coordinated) policies meant to encourage both vehicle purchases and charging infrastructure might be justified. However, having multiple programs often creates several problems or challenges, such as:
- Interactions With Other Policies. In some cases, emission reductions from one policy could be offset by increases in emissions from other policies. For example, in some cases, interactions between state transportation‑specific policies might interact with other policies—such as the state cap‑and‑trade program, the federal Renewable Fuel Standard (RFS), or federal fuel efficiency standards—in ways that “reshuffle” emissions to other jurisdictions, rather than reduce net emissions. This is an inherent challenge in implementing GHG reduction policies at the state‑level. As a result, the Legislature might want to consider funding more research on the relationship between different state and federal policies to better understand: (1) how they interact with one another and (2) the net effects of each policy.
- More Difficult to Evaluate Programs. These interactions also make it difficult to evaluate the effects of each policy. For example, although we know ZEV sales are increasing, it is difficult to evaluate the effects of any one policy. In turn, this makes it difficult to determine which policy the state should expand to achieve future state goals most effectively.
- Potential Lack of Coordination. The existence of multiple programs and administering agencies can make state coordination difficult. For example, three different state agencies administer different heavy‑duty vehicle and infrastructure incentive programs—many of which fund similar types of activities. Given the potential lack of coordination, it is not clear whether funds are allocated to the highest priority projects. In addition, having multiple programs could also create confusion among potential program recipients.
- Increased Administrative Costs. More programs tends to increase administrative overhead costs. At the time of this report, CARB had not provided updated information on the administrative costs of its major programs. However, based on available information, state administrative costs are likely at least in the low tens of millions of dollars annually. (These costs are relatively small compared to magnitude of the overall economic effects.)
Policies More Costly Than Cap‑and‑Trade . . . We recommend the Legislature consider limiting its GHG policies to those that achieve its policy goals most cost effectively, particularly as these goals become more ambitious in future years. Most notably, there is a broad consensus among economists that economy‑wide carbon pricing—cap‑and‑trade or a carbon tax—is the most cost‑effective way to reduce emissions. In contrast, some of the major policies aimed at reducing emissions in the transportation sector—such as the low carbon fuel standard (LCFS) and financial incentives for ZEVs—appear to be much more costly. As a result, the Legislature might want to consider modifying or eliminating some of the more costly programs and, instead, relying more heavily on cap‑and‑trade (or a carbon tax) to encourage the lowest‑cost emission reductions. In practice, this would likely lead to higher cap‑and‑trade allowance prices, but lower overall costs of GHG reductions.
. . . But Well‑Targeted Complementary Policies Could Be Valuable in Limited Instances. In some limited instances, there may be a strong rationale for additional state policies to complement a carbon price. Notably, in some cases, there are other “market failures” that would prevent businesses, households, or governments from taking low‑cost emission reduction activities, even with a carbon price in place. For example, there could be “network effects” related to electric vehicle deployment—meaning the demand for ZEVs and charging and refueling stations is partially dependent on the availability of each other. Other policies to address market failures could include research and development funding for new technologies or providing more information to consumers about the products they purchase.
Although some of these market failures almost certainly exist, we found limited evidence to suggest that the current mix of policies are effectively addressing these failures. The Legislature might want to direct agencies to ensure that any GHG reduction policy beyond carbon pricing is based on strong evidence that a market failure exists and the policy is effectively targeted at addressing that identified market failure.
We also note that some of the transportation policies—although not cost‑effective tools for reducing GHGs—might still be worthwhile based on the other benefits they provide (such as reducing co‑pollutants). If so, the Legislature will want to ensure that these policies are effectively targeted toward achieving these non‑GHG benefits and that the overall benefits outweigh the costs.
Effect on Emissions in Other Jurisdictions Unclear. Given California’s small contribution to global GHG emissions, the Legislature might want to give extra consideration to GHG policies that encourage reductions in other parts of the world. Unfortunately, the effect of California’s transportation policies on emission reductions in other parts of the world is difficult for our office to evaluate. In general, targeted policies aimed at supporting technological innovation—such as incentives for pilots and demonstrations of new technologies—seem more likely to encourage these types of “spillover” benefits than policies that address issues that are more California‑specific, such as land use and transportation planning in California.
In the following sections of this report, we (1) provide background on each of the state’s major transportation policies aimed at reducing GHGs, (2) provide our assessment of the available information on their costs and benefits, and (3) identify key issues for legislative consideration.
Light‑Duty Vehicles
CARB estimates that 70 percent of GHG emissions from California’s transportation sector—and 28 percent of all GHG emissions in California—come from light‑duty vehicles (specifically, cars and trucks that weigh 8,500 pounds or less). As discussed in detail below, the state oversees several programs designed to reduce emissions from light‑duty vehicles, including (1) financial and other incentives for consumers to purchase and use more fuel‑efficient and ZEVs, (2) regulations on auto manufacturers to sell more of these vehicles, and (3) increased financial support for additional ZEV charging and refueling stations.
Several of the state’s programs are specifically targeted at increasing the deployment of ZEVs, such as battery electric and hydrogen fuel cell vehicles. (Please see nearby box for a more detailed description of the different types of ZEVs.) The emphasis on ZEVs is consistent with state policies, including Chapter 530 of 2014 (SB 1275, de León) and Executive Order B‑48‑18, which set targets of 1 million ZEVs on California roads by 2023 and 5 million ZEVs by 2030, respectively. There are currently about 400,000 ZEVs registered in California, which is just over 1 percent of total light‑duty vehicles in the state (and about half of all ZEVs nationally). We estimate that if the state reached the goal of 5 million ZEVs by 2030, their share of the total fleet would have to increase to about 15 percent.
Different Types of Low‑ and Zero‑Emission Vehicles
There are a number of different technologies used by automobile manufacturers to meet state requirements for low‑ and zero‑emission vehicles (ZEVs).
ZEVs. A full ZEV has no tailpipe exhaust of any criteria pollutant or greenhouse gas (GHG). The different types of ZEVs include:
- Battery Electric Vehicle—Relies solely on a battery to propel the vehicle and has to be recharged from an external power source.
- Fuel Cell Vehicle—Uses an electrochemical reaction to combine hydrogen fuel and oxygen to produce electricity to propel the vehicle, with water being the other byproduct of the reaction. (Also referred to as fuel cell electric vehicles.)
- Neighborhood Electric Vehicle—Low‑speed battery electric vehicles.
Other Types of Reduced Emission Vehicles. There are several categories of vehicles that have lower GHG and other air pollutant emissions compared to typical cars. Some of these categories are or have been qualifying vehicles for some of the state’s emission reduction programs.
- Extended Range Battery Electric Vehicle—Utilizes an electric battery as its main power source for propulsion, but also has an auxiliary power unit (fueled by gasoline, for example) that can be utilized when the main power source is depleted.
- Hybrid Electric Vehicle (HEV)—Combines a conventional internal combustion engine with an electric‑propulsion system. Consequently, HEVs are at times powered by gasoline and at other times by an electric battery.
- Hydrogen Internal Combustion Engine (HICE)—Uses hydrogen as the onboard fuel source for combustion, rather than gasoline.
- Plug‑in Hybrid Electric Vehicle (PHEV)—Uses a battery that can be recharged by plugging into an external power source—a type of HEV.
- Transitional ZEV—Is a category of vehicles with 90 percent fewer tailpipe emissions than average gasoline powered cars, as well as meets other requirements. Can include PHEVs and HICEs.
Overview of Light‑Duty Programs
Clean Vehicle Rebate Project (CVRP)
Provides Consumer Rebates. CVRP is intended to increase deployment of ZEVs by reducing the cost to consumers of obtaining these vehicles. Specifically, the program provides rebates for the purchase or lease of ZEVs by eligible individuals, businesses, nonprofits, and government agencies in California. As shown in Figure 5, the amount of the rebate ranges from $900 to $5,000, depending on the type of vehicle purchased. Vehicles that qualify for the rebate are plug‑in hybrid electric, battery electric, and hydrogen fuel cell cars and motorcycles. Since 2016, lower‑income households—those with incomes at or below 300 percent of the federal poverty level—can receive an additional $2,000 rebate. High‑income households—over $300,000 gross annual income for joint filers, for example—are ineligible to receive the rebate.
Figure 5
CVRP Rebate Amount Based on Type of Technology
|
Technology Type |
Examples |
Amounta |
|
Hydrogen fuel cell |
|
$5,000 |
|
||
|
Battery electric |
|
2,500 |
|
||
|
||
|
||
|
Plug‑in hybrid electric |
|
1,500 |
|
||
|
||
|
Zero‑emission motorcycles |
|
900 |
|
||
|
aApplicants from lower‑income households can receive an additional $2,000. High‑income households are ineligible to receive the rebate. CVRP = Clean Vehicle Rebate Project. |
||
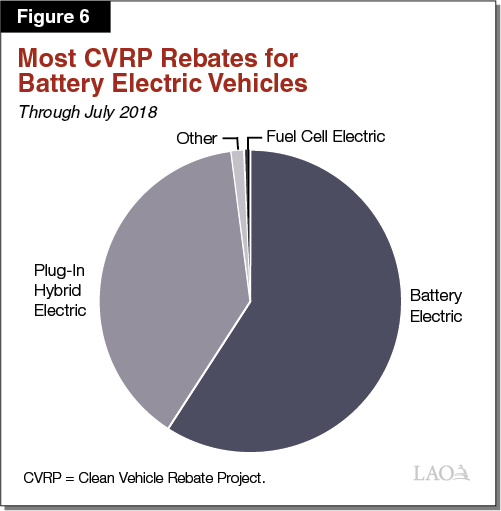
Rebates to Date. As of November 2018, the program had provided a total of $589 million in rebates to 264,000 consumers since it began in 2010. CVRP rebates are currently funded entirely from the Greenhouse Gas Reduction Fund (GGRF), which is supported by proceeds of the state’s cap‑and‑trade program on GHG emissions. As shown in Figure 6, most rebates have been for battery electric vehicles.
Clean Cars 4 All Program
Rebates to Replace Higher Polluting Vehicles. The Clean Cars 4 All Program offers rebates to certain consumers who retire their existing, older vehicles that have failed smog tests and purchase newer vehicles that meet specific requirements. Replacement vehicles eligible for the rebate include ZEVs as well as certain non‑ZEVs and can include used vehicles. The program also provides an additional incentive to consumers who reside in or near a disadvantaged community. (For purposes of state climate policies, disadvantaged communities are defined by the California Environmental Protection Agency (EPA) based on various measures of environmental and socioeconomic conditions within each census tract.)
Currently, the program operates in two of the air districts in the state that have not reached federal air quality standards—the San Joaquin Valley Air Pollution District and the South Coast Air Quality Management District—though CARB is considering whether to expand the program into other areas of the state. In total, the financial incentive ranges from $2,500 to $9,500 per vehicle. As shown in Figure 7, the specific amount a consumer is eligible to receive depends on household income, the choice of replacement vehicle, and whether the consumer lives in or near a disadvantaged community. Consumers can participate in both the Clean Cars 4 All Program and CVRP if they meet the eligibility requirements for both programs.
Figure 7
Clean Cars 4 All Program Incentive Based on Replacement Vehicle, Income, and Location
|
Income Levela |
Conventional |
Hybrid Electric |
Plug‑In Hybrid Electric |
Battery Electric |
Alternative Transportationb |
|
|
(20+MPG) |
(35+MPG) |
|||||
|
Residing in or Near Disadvantaged Community |
||||||
|
Above moderate |
— |
— |
— |
$5,500 |
$5,500 |
$2,500 |
|
Moderate |
— |
— |
$5,000 |
7,500 |
7,500 |
3,500 |
|
Low |
$4,000 |
$6,500 |
7,000 |
9,500 |
9,500 |
4,500 |
|
All Others |
||||||
|
Above moderate |
— |
— |
— |
$2,500 |
$2,500 |
$2,500 |
|
Moderate |
— |
— |
$3,500 |
3,500 |
3,500 |
3,500 |
|
Low |
$4,000 |
$4,000 |
4,500 |
4,500 |
4,500 |
4,500 |
|
aModerate‑income level is defined as from 226 percent through 300 percent of the federal poverty level. bIncludes transit passes and is available in lieu of a replacement vehicle. MPG = miles per gallon. |
||||||
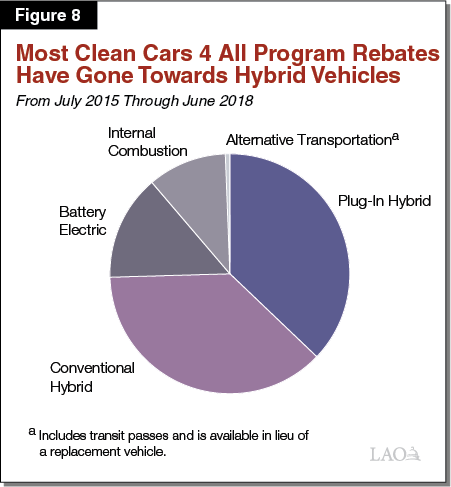
Over 3,000 Rebates to Date. In the first three years of the program—through June 2018—the program provided about 3,700 incentives totaling $28 million. Funding for the program comes through a combination of vehicle‑related fees and GGRF. As shown in Figure 8, over two‑thirds of the replacement vehicles have been standard hybrids or plug‑in electric hybrids.
Single‑Occupant Vehicle Decals
Allow Solo Drivers in Carpool Lanes. This program is designed to provide consumers a nonfinancial incentive to purchase and use ZEVs. State law allows qualifying electric, plug‑in hybrid, and hydrogen fuel cell vehicles to use high‑occupancy vehicle (HOV) lanes even when only a single occupant is in them. The Department of Motor Vehicles (DMV) issues decals for cars identified by CARB as meeting the definition of a ZEV. (Previously, conventional hybrid vehicles were also eligible for decals.) Higher‑income earners who purchase a hydrogen fuel cell vehicle are required to choose between receiving the decal or the rebate available through CVRP. (Higher‑income earners who purchase an electric or plug‑in electric vehicle are eligible for the decal but not the rebate.)
400,000 Decals Issued to Date. Since the program began in 2001, the state has issued about 400,000 clean air decals. Very few decals were issued in the early years of the program, and conventional hybrid vehicle owners received most of the decals in mid‑ and late‑2000s. In more recent years, the total number of decals issued has increased significantly with most of these being for electric and plug‑in electric vehicles.
Clean Car Standards
State and Federal Regulations to Reduce Fleet Emissions. The Legislature adopted Chapter 200 of 2002 (AB 1493, Pavley), which required CARB to develop regulations to reduce emissions from each auto manufacturer’s fleet of passenger cars and light‑duty trucks (sometimes referred to as the clean car standards or “Pavley Standards”). California’s standards, which first took effect in 2009, are currently aligned with emission standards set by the federal EPA and fuel economy standards set by the National Highway Traffic Safety Administration (NHTSA). United States EPA and CARB have established maximum average emission rates (grams of C02e per mile) that apply to each car manufacturer’s entire fleet of (1) cars and (2) light‑duty trucks. These emission standards are scaled based on the size of each car or truck so that larger vehicles face a less strict standards compared to smaller vehicles. The emission standards are scheduled to become more stringent each year through 2025.
To comply with the standard, manufacturers estimate the emissions for each vehicle model and compare it to the standard established for that vehicle size, generating credits for vehicles with lower emissions than the standard and deficits for vehicles with higher emissions than the standard. At the end of each year, each manufacturer is evaluated based on its entire fleet of new cars sold. If the average emissions rate is at or below the standard, the manufacturer is in compliance. The regulation also gives flexibility for auto manufacturers that do not comply in a given year. For example, they can buy credits from other manufacturers that overcomply with the regulation or use excess credits that were banked from previous years. If a manufacturer does not comply with the regulation in one of these ways, it faces a financial penalty.
Manufacturers have several options for how to modify their fleet over time in order to maintain compliance with the regulation. For example, they can modify individual vehicles in ways to reduce emissions. This can include making changes that increase the fuel economy of the vehicle, such as by making the vehicle lighter or more aerodynamic. It can also include other technological changes to the engine to make it more efficient or reduce leaks from air conditioning systems. In addition, manufacturers can change the mix of vehicles they sell by promoting and selling more low‑ and zero‑emission vehicles.
ZEV Mandate
Regulation Requires Increased ZEV Sales. This CARB regulation is designed to increase the number of ZEVs sold in California. CARB first established the program in 1990, and it has been modified several times in subsequent years. The current regulation, established in 2012, is intended to result in an increasingly higher number of ZEVs being sold in California by auto manufacturers. To implement the regulation, CARB assigns a different ZEV credit—ranging from zero points to 4 points—to each qualifying vehicle model sold in California based on its technology and distance range. For example, a fuel cell vehicle with a range of more than 350 miles would receive a full 4 points, while a plug‑in hybrid electric vehicle with an all‑electric range of more than 80 miles per charge would receive a maximum of 1.3 points. In addition, under the regulation manufacturers have other constraints on the amount of their compliance obligation that can be met through transitional ZEVs (generally, plug‑in hybrid electric vehicles).
The regulation includes an annual requirement that each medium and large manufacturer generates or acquires a certain number of credits (expressed as a percentage of total cars sold). Figure 9 shows how this annual compliance requirement increases over time. Manufacturers can bank credits generated in prior years, as well as buy excess credits generated by other manufacturers to ensure they have enough to meet the annual requirements. Manufacturers that do not meet their annual targets are required to make up the deficit in subsequent years or face a financial penalty.
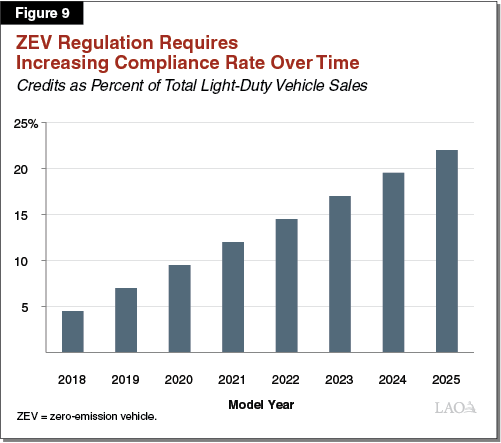
Manufacturers Have Generated Excess Credits to Date. Auto manufacturers have overcomplied with the mandate’s regulatory requirements to date. Through 2017, they have generated a net balance of 1.2 million unused credits, which can be used for future compliance. For context, we estimate manufacturers will need to have roughly 100,000 credits to meet the 4.5 percent regulatory requirement in 2018.
Public ZEV Infrastructure Funding
Increased Spending on Charging and Refueling Stations. The goal of this effort is to build more electric charging and hydrogen refueling stations for the public to use. In so doing, the expectation is that consumers will view the challenge of finding refueling opportunities as less of a barrier to owning and driving a ZEV. Various state entities are responsible for implementing or overseeing the implementation of vehicle charging stations and hydrogen refueling stations that can be accessed by different segments of the public (versus installing charging stations at individuals’ homes). This includes installation of ZEV infrastructure along major transportation routes (such as highways), as well as at apartment buildings, commercial locations, and publicly owned office buildings.
Over $1 Billion in Spending. The largest public light‑duty ZEV infrastructure efforts overseen by state agencies are summarized in Figure 10. As shown, there is over $1 billion already spent or planned to be spent on ZEV infrastructure over the next several years. This funding comes from a variety of sources, including electricity ratepayers, private corporations (in response to legal settlements), and state funds. This spending is estimated to result in tens of thousands of additional charging and refueling stations throughout the state.
Figure 10
Major State Zero‑Emission Vehicle (ZEV) Infrastructure Programs
|
Program |
Agency |
Funding |
Description |
|
|
Amount |
Source |
|||
|
Volkswagen (VW) settlement |
California Air Resources Board |
$800 million over ten years |
Volkswagen |
A 2016 settlement requires VW to invest $800 million in ZEV projects—mostly for ZEV fueling infrastructure—in California over ten years. The first two rounds of spending will invest about $270 million to construct over 3,000 charging stations. |
|
Alternative and Renewable Fuel and Vehicle Technology Program |
California Energy Commission |
$275 million through 2018‑19 |
Vehicle fees |
Spent about $40 million annually for public ZEV infrastructure in past years. Recent budget actions increased that amount to $114 million in 2018‑19. Has funded about 7,000 electric charging and hydrogen refueling stations funded to date, and increased spending could result in more than an additional 10,000. |
|
Investor‑owned utilities plans |
California Public Utilities Commission (CPUC) |
$230 million since 2016 |
Ratepayers |
Since 2016, CPUC has approved about $230 million for ZEV infrastructure pilot projects, primarily at multifamily residential, workplace, and other public locations. Estimated to result in over 12,000 charging stations. |
|
NRG settlement |
CPUC |
$100 million (one time) |
NRG Energy |
A 2012 settlement requires the energy company NRG to install at least 200 public fast‑charging stations and infrastructure for up to 10,000 privately owned charging stations at residences and workplaces. |
|
Vehicle charging at state buildings |
Department of General Services |
$90 million over four years |
State General Fund and special funds |
The department has a plan to install 6,200 charging stations at state buildings for employees and the state fleet. |
|
Vehicle charging on state highways |
Department of Transportation |
$20 million (one time) |
Fuel taxes |
The 2017‑18 budget included $20 million to install over 30 electric vehicle fast chargers along highway corridors. |
Assessment of Costs and Benefits: Light‑Duty Programs
Based on our review of the literature and discussions with academic and other experts in the field, it is impossible to draw definitive conclusions regarding the amount of costs and benefits associated with each of the light‑duty programs described above. Largely, this is because of two factors. First, program administrators have not been required to develop and update cost and benefit information for all of the individual programs. Second, even where some of these estimates have been developed, the various evaluation complexities described earlier in this report make it challenging to validate those estimates. Consequently, we find it difficult to compare the costs and benefits of each of these programs to each other or other GHG reduction programs. Despite these research challenges, we identify below some useful research findings about the potential effects of these programs.
GHG Emission Reductions
Estimated GHG Reductions for Consumer Rebate Programs Uncertain. A rebate can be expected to increase consumer demand for a ZEV because the rebate effectively reduces the price the consumer has to pay for the vehicle. There are a number of studies that find that rebates do increase ZEV (or other low‑emission vehicle) purchases in California and elsewhere. The amount of additional demand estimated varies across studies, and the effectiveness of different programs is likely affected by the structure of the program—including the size of the rebate and eligibility rules—and market demand, which can vary by location. While researchers find that rebates increase the number of ZEVs purchased, they also identify several reasons why the effectiveness of rebates to increase demand, as well as reduce net GHG emissions, can be limited. Most importantly, some individuals receiving a ZEV rebate would have purchased a ZEV even in the absence of the California rebate. These consumers are sometimes referred to as “free‑riders.” This might be because consumers believe that the long‑term operational savings of owning and operating a ZEV—such as from reduced fuel costs—outweigh the additional upfront costs to purchase the vehicle. In addition, certain consumers are less likely to depend on a rebate for their purchase decisions if they are relatively wealthy and/or if they want to be “early adopters” of a technology. In fact, survey data compiled by the Center for Sustainable Energy—which administers the CVRP for CARB—shows more than half of consumers who received a CVRP rebate reported that they would have purchased a ZEV even if the program did not exist.
In addition, the effectiveness of a ZEV rebate on GHG emissions could be further limited even in cases where a consumer would not have purchased a ZEV otherwise. Specifically, this could occur when a consumer would have purchased a non‑ZEV, highly fuel‑efficient vehicle instead of a ZEV. This might occur, for example, with a consumer that is specifically interested in reducing his/her “carbon footprint” but where the ZEV price is too high without the rebate. In such cases, the rebate does have the effect of encouraging a new ZEV purchase, but the net reductions associated with buying a ZEV rather than a highly fuel‑efficient vehicle might not be that significant.
For the two rebate programs—CVRP and Clean Cars 4 All Program—CARB has issued GHG reduction estimates. Specifically, CARB estimates that both programs would result in about six tons of GHG emission reductions over the lifetime of each vehicle. In reviewing the GHG estimates for these two programs, we note that they rely on certain assumptions that are subject to significant uncertainty that would offset each other to some degree. On the one hand, the GHG reduction benefits estimated may be understated because they assume that those benefits are achieved for only the first couple of years of the vehicle’s life, rather than for the full life of the vehicle. On the other hand, we find that the estimates include a significant methodological shortcoming that could overstate the GHG reduction benefits. Specifically, the department’s analytical approach to estimating benefits implicitly assumes that none of the participating consumers would have purchased a qualifying vehicle in the absence of the program. It is difficult to know exactly which participants were incentivized by the program to replace their old vehicle or to purchase a more efficient vehicle, making it difficult for us to estimate how overstated the department’s estimates for these programs are.
Consumer Surveys Suggest That Decals Incentivize ZEV Purchases. Regarding the single‑occupancy decals, we did not find any studies that estimate the emissions reduction benefits associated with the decal program. Thus, it is unclear what level of GHG emission reductions are being achieved by the program as a whole or by the specific vehicle types covered by the program. Despite no formal analysis of the state’s program, several surveys and studies suggest that the availability of HOV decals is a strong motivator for some consumers to purchase and use ZEVs. For example, a survey of approximately 19,000 CVRP recipients between 2012 and 2015 found that 17 percent said that having HOV lane access was their primary motivation for purchasing an electric vehicle. Other research has found consistent results, including that used cars with HOV decals sell for more than the same vehicle without an HOV decal, providing a monetary estimate of the value of the decals.
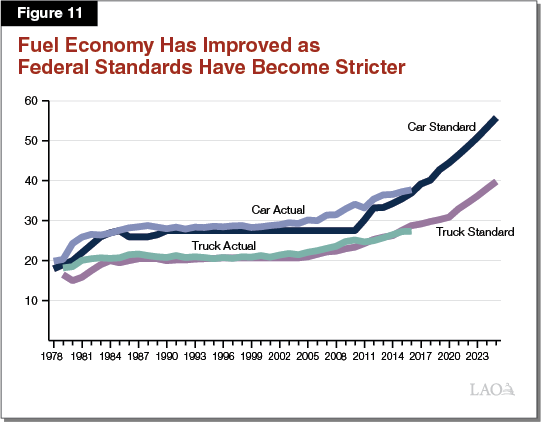
History of Fuel Efficiency Standards Show Positive Incremental Effects. The state’s clean car standards are currently aligned with the federal government’s standards to reduce emissions and increase fuel efficiency from light‑duty cars and trucks. These federal fuel efficiency standards were first established in the 1970s and have been made incrementally stricter over time. Most analysts find that these standards have had a real and significant effect on emissions. This effect is most clearly shown in Figure 11, which displays how average fuel economy has increased over time in very close relationship to the federal standards. The U.S. EPA and CARB estimate that under the current regulations, average GHG emissions will decrease to 175 grams per mile by 2025, which is less than one‑third of the average emission levels in 1975.
It is important to note that this correlational data is not conclusive. There could be other factors that contribute to improving fuel efficiency over time, especially consumer demand for fuel savings, such as when gas prices increase. In fact, researchers do find that consumer demand for more fuel‑efficient cars increases when gas prices rise. (Similarly, demand for less fuel‑efficient cars increase when gas prices fall.) However, gas prices can rise and fall unexpectedly, and researchers suggest that the standards can have an important longer‑term impact on auto manufacturers’ planning processes by setting clear expectations for future emissions levels. This is important for manufacturers because it can take several years to design and integrate new technologies into their vehicle models.
A 2017 analysis by CARB, U.S. EPA, and NHTSA estimated that the existing emission standards will reduce lifetime GHG emissions from all model year 2021 through 2025 vehicles sold in the nation by about 100 million metric tons per model year (540 million metric tons total). (In 2016, GHG emissions in the U.S. were over 6 billion metric tons.) We note that these estimates are subject to substantial uncertainty for several reasons. Importantly, they presume that the regulations will be implemented successfully. The federal government has proposed to repeal the current plan to make the standards stricter in out‑years. As we discuss in greater detail below, if implemented, this repeal likely would significantly reduce future emission reductions that could be achieved from both the federal and state standards.
Analytical Basis for ZEV Infrastructure Based on Potential Market Failure. Developing estimates for the GHG emissions reductions associated with spending on public ZEV infrastructure is challenging because the programs are intended to address the network effect that the demand for ZEVs and recharging and refueling stations is partially dependent on the availability of each other. In other words, consumers are less likely to buy and use ZEVs if they have concerns that there will not be sufficient infrastructure to support their driving patterns, often referred to as “range anxiety.” However, the market is less likely to invest in this infrastructure if it is not confident that a sufficient number of consumers will be driving ZEVs in the future to make the investment pay off. The spending on ZEV infrastructure overseen by state agencies is intended to address this problem by (1) reducing the costs of installing ZEV infrastructure and (2) increasing consumer demand for ZEVs by reducing range anxiety. We note that a report by National Renewable Energy Laboratory (NREL) analyzing several of the California Energy Commission’s (CEC’s) programs attempted to estimate the “market transformation” effects of spending on ZEV infrastructure. It estimated the emission reductions associated with this spending in a nascent market to be substantial. However, the report notes that these estimates “are based on data that is relatively more uncertain and the estimation approaches are inherently more theoretical.”
Currently, most of the state agencies overseeing these programs have not issued estimates of the GHG reductions they anticipate achieving. We note that the NREL analysis of the commission’s past spending of about $160 million on ZEV infrastructure estimated that this spending would result in direct emissions reductions of about 150,000 tons annually. We note, however, that this estimate assumed that none of the charging and refueling infrastructure funded by this program would have occurred in the absence of the program. In other words, the study assumed that without this funding, drivers would have driven gasoline‑powered vehicles instead of ZEVs.
Economic Costs
Consumer Financial Incentives Involve Opportunity Costs. Providing state funding for any program involves an “opportunity cost”—that is, the funding is not available for some other purpose. This is certainly true for the light‑duty programs receiving state funding. In fact, in economic terms, the opportunity cost is the primary cost associated with the two rebate programs. The CVRP and Clean Cars 4 All Programs are funded by cap‑and‑trade auction revenues and vehicle registration revenues. The state has historically used these two revenue sources to support a variety of activities, including other emission reduction programs. Therefore, to the extent that these programs do not encourage as many new ZEV and low‑emission vehicle purchases as hoped or expected, the main cost of the program is the opportunity cost to use these funds in other ways, such as (1) increased spending on other strategies that are more cost‑effective at reducing GHG emissions or (2) lower vehicle registration fees. Consequently, looking at the cost‑effectiveness of these programs is very important to ensure that the spending is targeted to the most effective programs possible. Based on CARB data, CVRP results in a state financial cost of over $400 per ton of GHGs reduced. Primarily because the rebate amounts are much higher on average, the Clean Cars 4 All Program costs about $900 per ton of GHGs reduced, according to CARB. As discussed above, these estimates are uncertain because they are based on assumptions that could both underestimate and overestimate emission reductions.
Clean Car Standards and ZEV Mandates Shift Costs to Purchasers of Higher Emission Vehicles. Improving fuel efficiency and developing technologies that can reduce GHG emissions results in additional costs for auto manufacturers. In order to remain profitable, they have to recover these costs in their vehicle sales. Increased prices, however, would have the effect of reducing consumer demand. Therefore, in order to ensure that they meet the minimum annual sales levels required under the Clean Cars Standards and ZEV regulations, manufacturers will (1) discount prices on the vehicles that help them meet the regulations and (2) make up those costs by increasing prices on other vehicles in their fleet. This has the effect of providing a financial subsidy for purchasers of the vehicles targeted by the regulations—lower‑emitting vehicles and ZEVs—while effectively taxing purchasers of higher‑emitting vehicles.
The analysis done by CARB and federal agencies for the Clean Car Standards and federal fuel efficiency standards estimates that the average per vehicle cost to meet the model year 2025 standards for light‑duty cars and trucks will be around $900. The actual costs will vary by vehicle and across manufacturers’ fleets, and each manufacturer could take different strategies to how they distribute those costs across their fleets.
ZEV Infrastructure Costs Partly Borne by Various Tax and Fee Payers. As described above, the costs to implement ZEV infrastructure programs are being paid from a variety of sources. In the case of the CEC and utility programs, these programs are funded through higher vehicle fees and utility rates, thereby increasing what individuals and businesses have to pay. For the CalTrans and DGS programs, the funding is coming from existing state taxes and fees. So, spending from these programs represent an opportunity cost of not being able to spend these funds on other allowable purposes or lower taxes and fees. In contrast, the spending by Volkswagon and NRG is coming from those corporations consistent with settlement agreements designed to offset the negative emission effects of their past actions.
Other Benefits and Costs
Other Air Pollutant Reductions. An important co‑benefit associated with consumers using more ZEVs and other types of fuel‑efficient vehicles is the reduction in other air pollutants that can be achieved. Unlike GHG emissions, which have an impact on global climate change, the effects of other air pollutants tend to be more local. Therefore, the air pollution reductions associated with these programs are particularly important in some areas of California with particularly poor air quality, such as the Central Valley and areas of Southern California which are not currently meeting federal clean air standards.
For example, CARB’s 2018‑19 Funding Plan provides estimated reductions for CVRP. Specifically, it estimates that each CVRP rebate reduces less than one one‑hundredth of a ton of criteria pollutants (NOx, PM 2.5, and ROG). In addition, the assessment done for the Clean Car Standards and federal fuel efficiency standards estimates that by 2030, those standards will result in a net reduction of almost 50,000 tons of criteria and toxic pollutants in the U.S. annually. In recent years, annual emissions of criteria pollutants has exceeded 100 million tons nationally.
Consumer Savings. Another benefit cited for consumers that drive more fuel‑efficient vehicles, including ZEVs, is that their ongoing costs of ownership will be lower, largely because of reduced fuel and maintenance costs. In some estimates, these future savings are estimated to outweigh the increased purchase costs of these vehicles. While there is consensus in the literature that these vehicles do have reduced fuel costs, the amount of savings is very dependent on the projected gasoline prices, as well as the specific vehicle being evaluated and individuals’ driving patterns.
Agencies have estimated operating savings for some light‑duty programs. For example, the 2018 Initial Statement of Reasons for the Clean Cars 4 All Program estimated annual operating savings to consumers of between about $800 and $2,000, largely from reduced fuel costs. The assessment completed for the Clean Cars Standard estimates savings in the same range—an average of $1,600 per 2025 vehicle model.
VMT. Researchers point to the potential that some of these programs could contribute to additional VMT and congestion. One example of this is the Clean Car Standards, which—by requiring cars to become more fuel efficient—have the effect of reducing the cost of driving. Consequently, it becomes less expensive to drive, and consumers will drive more. This “rebound effect” can contribute to increased congestion (as well as offset some of the GHG and other air pollutant reductions associated with the program). Studies over the years have estimated different sizes of the rebound effect, and the assessment completed for the Clean Car Standards and federal fuel economy standards assumes a 10 percent rebound effect. In other words, for every 10 percent improvement in fuel economy, the assessment assumes that drivers will increase VMT by 1 percent.
Safety. Some researchers have raised questions regarding whether an increase in the share of the fleet that is made up of ZEVs could have a negative effect on driver and passenger safety, including a risk of increased fatalities. The concern is that these vehicles tend to be smaller and lighter than other vehicles and, thus, might be more badly damaged in collisions. To date, the research on this issue is somewhat mixed. Researchers generally find that collisions between larger, heavier vehicles and smaller, lighter vehicles is more dangerous for the smaller vehicle and increases the probability of fatalities in the smaller vehicle. On the other hand, one of the potential effects of the Clean Car Standards and federal fuel economy standards could be to make larger vehicles—such as SUVs and light‑duty trucks—lighter than they would otherwise be, which could contribute to overall driver safety. Consistent with that, research suggests that the trend towards smaller, lighter vehicles (such as driven by federal fuel economy standards) has correlated with increased crash frequency but has not resulted in increased fatalities.
Other Issues for Consideration: Light‑Duty Programs
In this section, we highlight a few additional issues that are important in understanding the costs and benefits of light‑duty programs, as well as in considering how to shape future policies. Specifically, we discuss (1) the likelihood of programs becoming more costly in the future, (2) the potential effects of proposed changes to federal regulations, and (3) potential issues for future research.
State’s Ambitious Goals Mean Program Costs Likely to Increase Over Time
As discussed above, we generally do not have conclusive information on the costs and benefits of the state’s existing light‑duty programs. Importantly, the current costs and benefits are not static. That is, meeting the state’s ambitious GHG goals, including by significantly increasing the number of ZEVs, will most likely lead to higher costs in the future. These costs include the increased spending associated with providing more rebates for ZEV purchases, as well as more indirect costs such as more congestion in HOV lanes. In addition, as the state’s Clean Car Standards and ZEV mandate become stricter over time, this could lead to increasing manufacturer costs that are ultimately borne by consumers. The potential magnitude of these costs could vary widely depending on technology advancements and consumer demand.
While the magnitude of future costs is highly uncertain, the potential for high costs makes it important that administering agencies more consistently evaluate the costs and benefits of their programs. This should include the evaluation of programs in light of the state’s cap‑and‑trade program, which also incentivizes deployment of lower‑emission vehicles, including ZEV, by putting a price on carbon emissions. More consistent evaluation of programs’ costs and benefits would better assist the Legislature in its future policymaking decisions regarding how to allocate limited resources.
Proposed Federal Changes Could Undermine State Programs
Federal Administration Proposes to Freeze Current Auto Emission Standards. The U.S. EPA and NHTSA have proposed to freeze (at the 2020 levels) existing federal regulations that are scheduled to make automobile fuel economy and emission standards stricter for model years 2021 through 2025. The proposal would also revoke the federal waiver that allows California to set its own emission standards. California’s standards through 2025 currently align with the federal standards previously authorized. If the federal government continues to pursue its proposed changes, many analysts believe that there could be years of litigation before the issues are resolved.
Less Strict Federal Standards Could Undermine Effectiveness of State’s Program. If the federal proposal is ultimately implemented, it would mean that California could no longer implement its efforts to reduce emissions through the Clean Car Standards and ZEV mandate. Importantly—and not as intuitively—the effectiveness of the state’s Clean Car Standards could be jeopardized in a scenario where the federal standards were frozen but California was allowed to continue operating its program under the existing waiver. This is because California’s stricter standards would make it easier for auto manufacturers to comply with federal standards in other states. In other words, emissions reductions achieved in California would be at least partially offset by fewer emission reductions being made in other states. On net, this means that California’s stricter standards would not reduce total GHG emissions as much as otherwise estimated.
Potential Issues for Future Research
Identify Design Features to Make Rebate Programs Most Effective. Based on the findings above, we believe there are a couple of key research questions the Legislature and administration may want to pursue regarding the state’s rebate programs. For example, are there ways to reduce the free rider problem, such as by targeting rebates (or information campaigns) to consumers who are less likely to purchase ZEVs currently? There could be lessons learned on this question from upcoming studies on the Clean Cars 4 All Program, which is targeted to lower‑ and middle‑ income consumers. As discussed above, higher‑income individuals may be more likely to buy ZEVs even in the absence of rebates.
Another design feature of the Clean Cars 4 All Program worthy of further analysis is that the program permits the purchase of used vehicles and non‑ZEVs (conventional hybrids and internal combustion engine vehicles). On the one hand, both of these program characteristics mean that consumers can participate in the program even if they are not purchasing new ZEVs, which would seem to incentivize the purchase of a broader set of cleaner vehicles. On the other hand, these design features incentivize purchases where the per vehicle emission benefits are probably not as great as for ZEVs because (1) older cars will not have as long of a useful life on average as new cars and (2) even highly efficient gasoline powered and hybrid vehicles result in more GHG and other emissions in California than ZEVs. To the best of our knowledge, there is not yet any clear evidence about the net benefits of these different design characteristics.
Another potentially important design feature of Clean Cars 4 All Program is that it requires the retirement of an older vehicle. It might be worth evaluating the extent to which this requirement increases the emissions benefits of the program compared to a typical rebate program that allows existing vehicles to stay on the road.
Better Understanding the Interactions Among Different Programs. As discussed earlier in this report, a significant complication to evaluating the costs and benefits of climate change programs is having multiple programs targeting the same types of emission reductions. This is certainly true in the area of light‑duty vehicles, where there are multiple attempts to promote ZEVs by (1) providing financial incentives and nonfinancial incentives, (2) placing minimum sales requirements on manufacturers, and (3) increasing the convenience and reducing costs associated with recharging and refueling. Consequently, it is often very difficult to evaluate whether, for example, a particular consumer purchases a ZEV because they received a rebate, had access to an HOV lane, felt less range anxiety because of greater proximity to infrastructure, and/or the manufacturer lowered the sale price of the vehicle in order to meet regulatory requirements. In addition, as we discuss later in this report, the LCFS program provides additional incentives for ZEV purchases. In many cases, several or all of these factors could influence an individual consumer to purchase a ZEV, but it is difficult to disentangle which factors were most important. Consequently, it is more difficult for policymakers to determine which policies are likely to accomplish the greatest benefits at the lowest cost. Given the complicated way that these programs can interact, there would be value in research designed at disentangling those effects. In many cases, this likely requires designing programs with this sort of evaluation in mind. For example, piloting program changes in certain regions (rather than implementing them statewide) can make it easier to evaluate the effects of those changes.
One example of where there could be duplication across programs that we have not seen studied is between the CVRP rebates and ZEV mandate. The state’s ZEV mandate requires auto manufacturers to sell increasing numbers of ZEVs in California. One way for manufacturers to comply with this requirement is to lower prices on ZEVs to encourage greater consumer demand. However, the CVRP also reduces the vehicle price to encourage increased demand. So, to the extent that the CVRP increases demand, manufacturers do not have to reduce their prices. It is unclear which program—CVRP or the ZEV mandate—is more cost‑effective at increasing ZEV sales and reducing emissions. In addition, an important implication of this potential duplication is how the reduction in ZEV prices is paid for, whether from cap‑and‑trade auction revenues (the fund source for CVRP) or by purchasers of non‑ZEVs.
Address Potential Information Barriers to ZEV Deployment. Research indicates that a significant share of the population is not familiar with the current state of ZEV capabilities or many of the specific ZEV models available. In addition, there is debate in the literature regarding the degree to which consumers underestimate the longer‑term fuel savings associated with driving a ZEV. Some researchers have pointed to these information issues as important challenges to ZEV deployment and have suggested that more efforts should be made to educate consumers. This might be an area ripe for additional research to better test how public outreach and education campaigns might be effective (and potentially lower cost) ways to better inform consumers about the benefits of ZEVs, particularly for individuals or targeted groups who would not otherwise purchase one of these vehicles.
Determine How Infrastructure Spending Is Best Targeted. Researchers seem to agree that there are market failure‑based reasons for some public spending on ZEV infrastructure. However, it would be valuable to have more definitive research into a couple of key questions around how much and where to place that infrastructure.
- First, how can public subsidies for infrastructure be best targeted given different driving patterns in different communities. For example, most research to date suggests that the vast majority of charging will happen at people’s homes and workplaces. To what extent should those locations be targeted for public subsidies versus other locations—such as highway corridors, travel destinations, gas stations, and commercial centers—to better spur utilization?
- Second, how will ongoing advancements in rapid charging technology—both in the infrastructure and vehicles—affect how consumers are most likely to utilize chargers?
- Third, in the longer term, at what point will ZEV deployment be sufficient and ZEV infrastructure profitable enough that public subsidies are no longer necessary?
Heavy‑Duty Vehicles
There are a wide variety of types of medium‑ and heavy‑duty vehicles and equipment. On‑road vehicles—such as trucks, delivery vans, and buses—account for 9 percent of overall GHG emissions and 22 percent of emissions from the transportation sector. Other equipment used for freight (such as cranes), agriculture (such as tractors), construction (such as excavators), certain railroad activities (such as switch locomotives), and ships account for another 3 percent of statewide emissions. Hereafter, we refer to the combined emissions from the above different types of equipment—both on‑road and off‑road—as heavy‑duty vehicle emissions. The vast majority of these vehicles use diesel fuel.
The Legislature has not adopted statewide goals for the number of zero‑emission heavy‑duty vehicles deployed by a certain year. We note, however, that the 2016 Governor’s Sustainable Freight Action Plan establishes targets of improving freight system efficiency by 25 percent and deploying over 100,000 vehicles and equipment capable of zero‑emission operation by 2030. There are currently over 500,000 total heavy‑duty freight vehicles in California and over 10,000 are capable of zero‑emission operations. In addition, Chapter 524 of 2014 (SB 1204, Lara) requires CARB, in consultation with CEC, to develop a strategy for financial incentives for heavy‑duty vehicles with a goal of supporting new technologies through the commercialization process.
The state has several different programs to reduce heavy‑duty vehicle emissions. In this section, we focus on state programs that provide financial incentives for new or upgraded heavy‑duty vehicles. Although CARB is also implementing (or developing) regulations that target heavy‑duty emissions, we do not discuss these regulations in this report for various reasons. In particular, the regulations are driven primarily by federal policy, have a relatively small effect on statewide GHG emissions, and/or are primarily focused on reducing local and regional air pollutants.
Overview of Heavy‑Duty Incentive Programs
The state has a wide range of heavy‑duty incentive programs. Most of these programs target multiple pollutants—including GHGs, as well as NOx and PM—making it difficult to know which programs would have otherwise been implemented if the Legislature had not adopted GHG limits. Below, we discuss the major incentive programs where: (1) GHG reductions are a primary goal and/or (2) funding comes from the GGRF, which receives revenue through a state GHG reduction program (cap‑and‑trade). We exclude several other programs that are primarily focused on NOx and/or PM emissions, including the Carl Moyer Program (non‑GGRF), Proposition 1B (2006), and the Volkswagen Settlement Mitigation Trust Fund. We also exclude funding that is allocated primarily for transit, which we discuss in a later section of this report.
Figure 12 summarizes the major heavy‑duty incentive programs. The programs are administered by CARB, CEC, and the California Public Utilities Commission (CPUC). Total funding authorized for these programs over the last several years exceeds $2 billion, with over $1 billion authorized in 2018‑19. Each program generally falls into one of four categories: (1) demonstrations and pilots, (2) early commercial deployment of new technologies, (3) programs focused on reducing local pollution through fleet turnover, and (4) installing fueling or charging infrastructure.
Figure 12
Major GHG Heavy‑Duty Vehicle Incentive Programs
(In Millions)
|
Agency |
2018‑19 |
Totala |
|
|
Demonstrations and Pilots |
$88 |
$522 |
|
|
Freight Demonstrations |
CARB |
55 |
238 |
|
Advanced Freight and Fleet Technologies |
CEC |
18 |
144 |
|
Zero‑Emission Truck and Bus Pilots |
CARB |
— |
85 |
|
Rural School Bus Pilots |
CARB |
15 |
55 |
|
Early Commercial Deployment |
125 |
553 |
|
|
Clean Truck and Bus Vouchers (HVIP and Low‑NOx Engines) |
CARB |
125 |
366 |
|
School Bus Replacement Program |
CEC |
— |
75 |
|
Natural Gas and Propane Vehicle Deployment |
CEC |
— |
72 |
|
Zero‑Emission Off‑Road Freight Vouchers |
CARB |
— |
40 |
|
Local Pollution Reductions |
377 |
762 |
|
|
AB 617 local programs to reduce emissions |
CARB |
245 |
495 |
|
Agricultural equipment replacements |
CARB |
132 |
267 |
|
Fueling Infrastructure |
592 |
614 |
|
|
IOU Electric Vehicle Charging |
CPUC |
592b |
592 |
|
Natural Gas Fueling |
CEC |
— |
22 |
|
Totals |
$1,182 |
$2,451 |
|
|
aTotal funding for CARB programs since 2012‑13 and funding for CEC programs since 2009‑10. bFunding approved by CPUC in 2018 will be spent over next several years. GHG = greenhouse gas; CARB = California Air Resources Board; CEC = California Energy Commission; HVIP = Hybrid and Zero‑Emission Truck and Bus Voucher Incentive Program; IOU = investor owned utility; and CPUC = California Public Utilities Commission. |
|||
Demonstrations and Pilots
Several programs focus primarily on demonstrations and pilots for technologies and equipment that are not yet commercially available. They are part of CARB’s overall strategy for using financial incentives to support new heavy‑duty technologies over the next few years. (Please see the nearby box for additional information regarding CARB’s strategy.) Some examples of projects that have received funding through these pilots and demonstrations include:
- Battery electric, plug‑in hybrid electric, and low‑NOx freight equipment used at various ports and goods distribution centers.
- Electric tractors in the Central Valley, with an accompanying electric truck outfitted with an ability to charge the tractors at remote locations.
- A hydrogen fuel cell ferry providing passenger service in the Bay Area.
State’s Strategy to Support New Vehicle Technologies
The state’s primary strategy for using financial incentives to support new technologies is described in the California Air Resources Board’s (CARB’s) annual Three‑Year Investment Strategy for Heavy‑Duty Vehicles and Off‑Road Equipment. (The strategy is developed in consultation with the California Energy Commission.) Senate Bill 1204 requires CARB to, among other things, establish an overarching vision for how the state can move technologies through the commercialization process. The figure below summarizes the priority projects identified in the 2018‑19 investment strategy. The funding amounts are for planning purposes only and actual amounts will depend on future legislative appropriations. According to CARB, the amounts included in the plan would help support the development of the identified technologies, but would not meet the overall level of funding (both public and private) needed to meet California’s air quality and greenhouse gas (GHG) goals. The plan is based on three concepts:
- Technology Pathways. The plan focuses on technology pathways seen as necessary to meet the state’s 2030 GHG goals and air quality goals. These are zero‑emission technologies (battery electric, fuel cell, and hybrid), low NOx engines, and more efficient engines and operations.
- Stages of Commercialization. The plan provides incentives to technologies across different “stages of commercialization.” These stages are (1) technology design and development and early stage demonstrations, (2) advanced stage demonstrations and pilots, and (3) early market entry. CARB assesses the status of different technologies and applications, and where they might fall into one of these categories.
- Expansion of “Beachhead Markets.” The plan prioritizes funding toward beachhead markets—which are successful applications of new technologies that can then be transferred to other market applications. For example, supporting the development and deployment of electric buses, which are showing some early signs of market acceptance, could eventually help transfer to other electric heavy‑duty vehicles.
Summary of CARB’s Three‑Year, Heavy‑Duty Strategy Investment Plan
|
Program |
Funding (In Millions) |
Project Examples |
||
|
2019‑20 |
2020‑21 |
2021‑22 |
||
|
Demonstrations |
$65 to $100 |
$60 to $85 |
$50 to $90 |
ZE/PHEV delivery trucks, longer range heavy‑duty goods movement, construction equipment |
|
ZE/hybrid heavier cargo handling equipment |
||||
|
ZE regional delivery |
||||
|
Pilots |
$170 to $310 |
$185 to $310 |
$200 to $325 |
ZE/PHEV drayage, regional delivery, heavy‑duty trucks, advanced power trains, and |
|
ZE/hybrid heavier cargo handling equipment |
||||
|
Fuel cell transit |
||||
|
Commercial Deployment |
$215 to $325 |
$365 to $545 |
$420 to $580 |
ZE/PHEV drayage and regional delivery ZE/hybrid heavier cargo handling equipment |
|
Low NOx Linehaul trucks |
||||
|
ZE delivery trucks and transit |
||||
|
Total Funding |
$450 to $735 |
$610 to $940 |
$670 to $995 |
|
|
CARB = California Air Resources Board; ZE = zero‑emission, such as battery electric; and PHEV = plug‑in hybrid electric vehicle. |
||||
Early Commercial Deployment of New Technologies
Some programs provide incentives for technologies that have passed the demonstration and pilot stage, and commercial models are starting to become available. These early commercial models are often still more expensive than conventional equipment. The main state program that is used to support technologies through this phase is CARB’s Hybrid and Zero‑Emission Truck and Bus Voucher Incentive Program (HVIP). This program provides incentives for low‑emission equipment that is commercially available, including up to $300,000 for zero‑emission trucks and buses and $30,000 for eligible hybrid trucks and buses. Funds are also available for low‑NOx engines that use renewable fuel, such as natural gas trucks or buses that use renewable natural gas. The incentives are provided on a first‑come, first‑serve basis for qualifying vehicles and technologies.
Programs Focused on Local Pollution Reductions
Some programs are primarily focused on reducing near‑term NOx and PM emissions, rather than promoting new or innovative technologies. Generally, these programs aim to accelerate fleet turnover—or the rate at which old equipment is replaced by newer or upgraded equipment. In many cases, this newer equipment might still use diesel fuel, but the emissions are much lower than the old equipment. (We discuss these programs here because they are primarily supported by revenue from the state’s cap‑and‑trade program.) These programs are:
- AB 617 Local Programs to Reduce Emissions. Since 2017‑18, the Legislature has allocated $495 million GGRF for projects that promote the goals of Chapter 136 of 2017 (C. Garcia, AB 617), which establishes a framework and process for improving air quality in communities with the highest levels of pollution. Funding is allocated to local air districts to reduce diesel emissions, largely through the structure of the existing Carl Moyer Program (which provides incentives for diesel equipment upgrades and has been operating since 1998). In 2018‑19, some of this funding will also go to emission reduction projects at stationary sources.
- Agricultural Equipment Replacement. Since 2017‑18, the Legislature has allocated $247 million—primarily from the GGRF—for agricultural equipment upgrades and replacements. This includes harvesting equipment, heavy‑duty trucks, agricultural pump engines, and tractors. The program is known as the Funding Agricultural Replacement Measures for Emission Reductions program. In 2017‑18, 80 percent of the funding was allocated to the San Joaquin Valley Air Pollution Control District. This program also largely relies on the guidance from the Carl Moyer Program to determine what projects qualify for funding.
Fueling Infrastructure
Some of the programs mentioned above fund infrastructure for fueling or charging heavy‑duty vehicles, but they primarily focus on new vehicles. Other programs focus exclusively on the infrastructure. Most notable, as mentioned above, in 2018 the CPUC approved a significant amount of IOU ratepayer funding for electric vehicle charging infrastructure. Most of this funding is for heavy‑duty vehicle charging infrastructure. Southern California Edison and Pacific Gas and Electric are authorized to spend almost $600 million for infrastructure at 1,500 sites to support electrification of more than 15,000 medium‑ and heavy‑duty vehicles. This includes infrastructure for buses, forklifts, and equipment for ports and warehouses.
Assessment of Costs and Benefits: Heavy‑Duty Vehicle Incentives
Compared to light‑duty vehicle policies, there appears to be relatively little academic research on the economic effects of heavy‑duty vehicle incentive programs. For example, we found very few academic studies estimating program effects retrospectively. Most of the available information is from CARB and CEC reports and planning documents. Below, we summarize and assess the information contained in these reports.
Agencies Have Estimated GHG Reductions for Some Programs . . . Estimates of GHG emission reductions are available for some, but not all, of the heavy‑duty vehicle programs identified in Figure 12. For example, CPUC does not estimate emission reductions from all IOU infrastructure programs. In other cases, agencies have not projected future emission reductions because they do not know which types of vehicles are likely to receive the funding. For the programs where estimates are available, those estimates are generally based on departments’ technological assessments of the emissions and costs of different technologies and equipment compared to a conventional vehicle (typically diesel). Outcomes are then measured based on the number of vehicles that receive funding.
For example, CARB estimates that $170 million (GGRF) for various heavy‑duty demonstrations, pilots, and commercial deployment projects implemented through 2017 reduced 247,000 tons of GHG emissions. It also estimates that $195 million allocated to heavy‑duty projects in 2018‑19 will reduce 724,000 tons of GHGs. In addition, as part of a 2017 CEC report, the NREL estimated that about $185 million in CEC funding for heavy‑duty demonstrations and deployment projects through June 2017 will directly reduce emissions by about 15 to 25 thousand tons annually through 2025. As discussed above, NREL also estimates reductions related to market transformation but these estimates are subject to substantial uncertainty.
. . . But Emissions Reductions Likely Somewhat Overstated. Similar to light‑duty incentive programs, estimates of emission reductions assume all equipment receiving an incentive would not have been purchased otherwise. By not adjusting for free‑riders, the estimates of direct emission reductions for some programs are likely somewhat overstated. For example, an evaluation of the CEC’s Alternative and Renewable Fuel and Vehicle Technology Program (ARFVTP)—which funds advanced freight and fleet technologies, among other things—found that roughly half of the projects would have likely been implemented even without the program funding. However, the extent to which this finding applies to heavy‑duty projects versus other types of ARFVTP projects that receive funding through the programs is unclear.
Furthermore, the GHG reduction estimates do not account for overlaps with other state policies that affect heavy‑duty vehicle emissions. For example, if a transit agency receives an HVIP incentive to buy a new electric bus, CARB attributes all estimated emission reductions to the HVIP. However, the agency buying the new bus might also receive revenue from LCFS credits for the electricity used as a fuel and IOU support for installing the infrastructure (as well as federal and local funding). As a result, CARB’s estimates likely overstate the GHG reductions directly attributable to the program. (As we discuss below, an alternate way to describe this concern is that the estimates understate the overall costs of the reductions.)
Near‑Term GHG Reductions Generally More Costly Than Alternative Approaches . . . The primary cost associated with these programs is the opportunity cost associated with the use of funds—generally either GGRF, vehicle‑related fees, or IOU ratepayer funds. These funds could otherwise be returned back to households—through rebates, lower fees, or lower electricity rates—or used on other state programs. Based on the available estimates, GHG reductions per dollar of state spending on heavy‑duty vehicle incentives is relatively high. For example, CARB estimates that its heavy‑duty GGRF programs reduce emissions at a state cost of $600 per ton. Estimated costs for each program range from about $250 per ton to over $3,000 per ton. Further, as described above, there are likely some assumptions that overstate the emission reductions attributable to the program, which suggests the state cost per ton could be even higher.
. . . But Supporting Early Stage Technologies Could Have Significant Long‑Term Benefits . . . The primary goal of some of the programs is to support new technologies that are in the early stages of development or deployment, when they tend to be relatively expensive. For example, demonstrations and pilots are one way to help businesses and governments learn about new technologies. This knowledge can then spillover to other businesses who could then potentially use this information to further develop the technology. In the short‑run, this likely leads to relatively high near‑term costs for GHG reductions from these programs. In the long run, however, these knowledge spillovers might provide social benefits by supporting the development of new technologies that lower emissions.
. . . And Programs Have Benefits for Local Air Quality. The primary benefit of some of these programs are the reductions in local air pollutants, such as NOx or PM. Heavy‑duty vehicles are the largest source of NOx in both the South Coast and San Joaquin Valley. In addition, CARB estimates that about 70 percent of total known cancer risk related to air toxics in California is attributable to diesel PM. The total co‑pollutant reductions from these programs is unclear. However, CARB estimates that 2018‑19 funding for heavy‑duty incentive programs will potentially reduce 1,300 tons of NOx and 34 tons of PM2.5 over the life of the vehicles. In addition, NREL estimated that the CEC programs funded through June 2017 will reduce annual NOx and PM2.5 by more than 3 tons and about 0.3 tons, respectively. (For context, total 2016 NOx and PM2.5 emissions from mobile sources were about 400,000 tons and 21,000 tons, respectively.) These estimates are subject to similar uncertainties and limitations we described for the GHG estimates above.
Other Issues for Consideration: Heavy‑Duty Vehicles
Impacts of Other Innovation and/or Co‑Pollutant Reductions. Heavy‑duty vehicle incentive programs appear to be a relatively costly way to reduce near‑term GHG emissions. Still, these programs likely produce other benefits, such as supporting new technologies or reducing co‑pollutants. When considering funding these heavy‑duty programs, the Legislature might want to consider which programs (1) are likely to encourage technological innovation and/or (2) which programs are likely to achieve the greatest reductions in co‑pollutants. In both cases, the Legislature will want to consider whether these other benefits are worth the costs.
Potential Issues for Future Research. Based on our review, it is not clear which heavy‑duty programs support new technologies or reduce co‑pollutants most effectively. As a result, the Legislature might want to take steps to ensure there is additional research in this area. For example, the Legislature might want to fund research that evaluates what types of heavy‑duty programs—research and development, pilots, demonstrations, or incentives for deployment—do the most to promote innovation. In addition, the state could fund research to evaluate the optimal structure of incentives, such as how large the incentives should be and when they should be phased‑out. This would help the state prioritize limited state funding to ensure it is used most effectively.
Program Coordination or Consolidation. Many of the state’s heavy‑duty vehicle programs support similar types of technologies and equipment, some of which are new or recently expanded. For example, both CEC and CARB fund heavy‑duty vehicle demonstration projects and school bus replacement programs. In addition, several program that support heavy‑duty charging infrastructure, even though CPUC recently approved a significant amount of IOU funding for these activities. The Legislature might want to consider whether it is necessary to have multiple programs funding similar types of activities and whether there are opportunities to consolidate these programs at one department. This might ensure funding is better coordinated and help improve accountability.
Low Carbon Fuels
The previous two program categories—light‑duty and heavy‑duty vehicle programs—are intended to promote vehicles that use less fuel or alternative types of fuel that have fewer emissions. The state also has policies to reduce the GHG emissions from the fuels that are used to power those vehicles. The largest state program in this area is the LCFS. Below, we (1) describe the LCFS, (2) assess the available information on the economic costs and benefits of the program, and (3) identify issues for the Legislature to consider as it makes future policy decisions about the program.
Overview of LCFS
Program Developed Through CARB Regulations. The primary purpose of LCFS is to reduce GHG emissions by reducing the carbon intensity (CI) of fuels used in California and to diversify the fuel mix to enable long‑term decarbonization of the transportation sector. CARB adopted the LCFS regulation in 2009 and began implementing it in 2010. The regulation was adopted under the broad authority given to CARB by AB 32. There is limited statutory direction on the LCFS. As a result, the details of the program have been developed almost entirely through CARB regulations.
Establishes Statewide CI Standard for Transportation Fuels. The program establishes statewide “carbon intensity” standards for transportation fuels supplied in California. Figure 13 provides an overview of the major types of transportation fuels. Carbon intensity is measured as GHGs per unit of energy (technically, grams of carbon dioxide equivalent per megajoule). The program establishes two major CI standards. One standard is for gasoline and gasoline substitutes, such as ethanol, electricity, and hydrogen. The other standard is for diesel and diesel substitutes, including biodiesel, renewable diesel, fossil natural gas, and renewable natural gas (biomethane). Both standards are set relative to a 2010 benchmark carbon intensity—roughly 100 gCO2e/MJ for both gasoline and diesel. As shown in Figure 14, the standards becomes more stringent annually through 2030, thereby requiring a reduction in average statewide fuel CI. (The CI reduction goals reflect recent CARB changes, as discussed in more detail below.)
Figure 13
Overview of Different Types of Transportation Fuel
In Millions of Gallons
|
Fuel Type |
Description |
2017 Volume Solda |
|
Gasoline |
Liquid fuel made from refined petroleum used to power light‑duty vehicles. |
14,062 |
|
Diesel |
Liquid fuel made from refined petroleum used to power heavy‑duty vehicles and equipment. |
3,342 |
|
Ethanol |
Liquid fuel made from biogenic materials—such as corn—that is typically blended into gasoline. |
1,575 |
|
Renewable diesel |
Liquid fuel made from biogenicmaterials—such as used cooking oil—that can be blended into regular diesel without limit. |
335 |
|
Biodiesel |
Liquid fuel made from biogenic materials—such as used cooking oil or corn oil—that is subject to limits on the amount that can be blended into regular diesel. |
170 |
|
Renewable natural gas |
Gas consisting largely of methane emissions captured from biogenic sources—such as landfills or dairies—that can power natural gas vehicles. |
107 |
|
Electricity |
Electricity used to power battery electric and plug‑in hybrid vehicles and certain heavy‑duty equipment |
75 |
|
Fossil natural gas |
Gas consisting largely of methane extracted from underground (often in association with petroleum) that is sometime used to power natural gas vehicles. |
52 |
|
Hydrogen |
Gas that can be burned with oxygen to power hydrogen fuel cell vehicles. |
0.3 |
|
aCertain fuels expressed in gasoline or diesel gallon equivalents. |
||
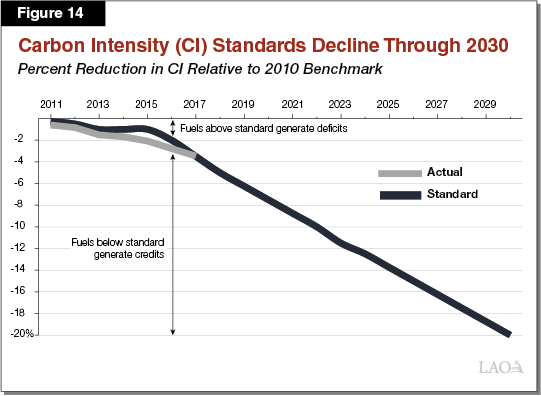
Emissions Measured on A “Lifecycle” Basis. Unlike most other state climate regulations, the LCFS measures GHG emissions on a lifecycle basis. This includes direct emissions related to combusting the fuels (tailpipe emissions), as well as producing and transporting the fuels (upstream emissions). It also includes indirect emissions associated with changes in land use from producing crop‑based biofuels, such as ethanol from sugarcane or corn. In contrast, CARB’s GHG inventory does not include carbon dioxide emissions related to biofuels or upstream emissions from fuels that are imported from out‑of‑state.
CARB has approved hundreds of different fuel “pathways,” which assign an estimated CI to different fuels based on where they come from and how they are was produced. Figure 15 shows the average CI for the major types of fuels.
Figure 15
Average 2017 Carbon Intensities (CI) for Different Fuels
In Grams of Carbon Dioxide Equivalent Per Megajoule
|
Fuel |
Average CI |
|
Diesel |
102 |
|
Gasoline |
100 |
|
Diesel standard |
98 |
|
Gasoline standard |
95 |
|
Fossil natural gasa |
89 |
|
Ethanol |
70 |
|
Renewable natural gasa |
44 |
|
Biodiesel |
34 |
|
Renewable diesel |
30 |
|
Electricity |
29 |
|
aCompressed natural gas. |
|
System of Tradeable Credits Used to Demonstrate Compliance. The LCFS uses a system of tradeable credits to determine compliance. Entities that supply fuels with a CI above the standard (“regulated parties”) accrue deficits. Entities that supply fuels with a CI below the standard generate credits. The number of credits or deficits depends on how much the CI differs from the standard. Each credit reflects one metric ton of carbon dioxide equivalent. Regulated parties must comply by obtaining enough credits to cover their deficits each year. Other entities (“opt‑in parties”) can voluntarily participate in the program by supplying lower CI fuels and generating credits that can then be sold to regulated parties. Gasoline suppliers can use credits that are generated from suppliers of diesel substitutes to comply with the regulation, and vice versa.
This system is intended to be fuel‑neutral, meaning it does not require businesses to use any particular fuel to meet the standard. Instead, market forces determine what mix of fuels (and emission reduction projects) is the least costly way to comply with the CI requirements. The main ways a regulated party can comply with the LCFS are:
- Blend Low Carbon Liquid Fuels. This includes blending ethanol, biodiesel, and/or renewable diesel into traditional fossil‑based fuels. In some cases, state or federal law limit the amount of liquid fuels that can be blended. For example, under California law, a gallon of gasoline can generally only contain up to 10 percent ethanol. Similarly, state law limits the amount of biodiesel that can be blended into diesel.
- Purchase Credits From Alternative Fuel Suppliers. Credits can be purchased from other entities that generate credits, such as businesses that supply low carbon liquid fuels, waste facilities that produce biomethane, or utilities that provide electricity to electric vehicle owners. In addition, credits can be generated through certain projects that reduce emissions during the process of producing transportation fuels. For example, credits can be generated by switching from natural gas to solar power for oil extraction or implementing carbon capture and storage projects.
- Use Credits Carried Over From Previous Years. Credits that are not used to comply in a given year can be “banked” and used in future years.
Program Has Been Modified Several Times. The program originally established a declining annual CI reduction standard that reached 10 percent by 2020. Since then, the program has been modified several times by CARB or the courts. For example, in 2013, the California Court of Appeal froze both the gasoline and diesel standards and required CARB to address issues related to the California Environmental Quality Act (CEQA)and the Administrative Procedures Act. To address the court ruling, CARB adopted a revised LCFS in 2015, which included an updated CI compliance schedule through 2020. Subsequently, in 2017, the Fresno County Superior Court froze the diesel CI standard again and required CARB to reassess the environmental effects of certain aspects of the regulation. Most recently, in 2018 CARB adopted a variety of changes to the regulation and the court unfroze the diesel standard. The CARB changes include less stringent near‑term CI standards (7.5 percent reduction by 2020), but extending the CI reduction standards to 20 percent in 2030. (At the time of this report, the changes are still awaiting formal approval by the Office of Administrative Law.)
Annual Credits Exceeded Deficits in Early Years, but This Has Changed. Figure 16 shows the annual number of deficits and credits generated since the program began. In the first several years, the annual number of credits exceeded deficits. This was caused, in part, by the court freezing the CI standard in 2014 and 2015. This allowed lower carbon fuels to continue to expand and generate credits, while the number of deficits remained relatively constant. It also created a “bank” of credits that regulated parties can use to comply with the regulation in future years. More recently, as the CI standards have decreased, the number of annual deficits has increased substantially. In 2017, annual deficits started to exceed credits. As a result, instead of banking excess credits each year, regulated parties are now starting to use some of the banked credits to comply with the regulation.
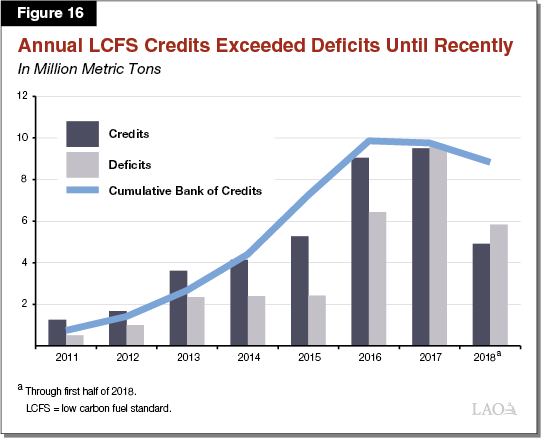
Assessment of Costs and Benefits: LCFS
Below, we provide information on the economic costs and benefits of the LCFS program. Our assessment is based on our review of data available on CARB’s website, regulatory documents, discussions with CARB and other stakeholders, and academic papers. We note that a significant amount of LCFS data and information are easily accessible on CARB’s website. The information gives researchers, stakeholders, and policymakers better information about the program.
Economic Costs
Program Effectively Taxes High Carbon Fuels and Subsidizes Low Carbon Fuels. From an economic perspective, the LCFS has two primary effects: (1) an implicit tax on fuels with CI above the standard and (2) an implicit subsidy for fuels with CI below the standard (or any other project that generates credits under the program). These incentives can be observed through the market for credits. High carbon fuel suppliers have to pay for credits to cover the deficits created by each unit of fuel they sell (similar to paying tax). Low carbon fuel suppliers receive money by selling the credits generated from their fuel (similar to getting a subsidy).
The amount of the tax and subsidy depends on: (1) the difference between the fuel CI and the standard during that year and (2) the market price for credits. As discussed below, a wide variety of regulatory, legal, and economic factors affect the market prices for credits. Figure 17 shows the amount of the implicit tax or subsidy for a gallon of different types of fuels, assuming credit prices remain at current levels. Notably, as the CI standard decreases over time, the costs per gallon of high carbon fuels increases (because it generate more deficits) and the subsidy per gallon of low carbon fuel decreases (because it generates fewer credits). For example, at $185 credit prices, the program increases the cost of supplying gasoline (without any ethanol blended) by about 13 cents per gallon in 2018. These costs would increase to roughly 46 cents per gallon in 2030. Conversely, the subsidy for renewable natural gas from landfills decreases from to $1.34 cents per gallon to 89 cents in 2030.
Figure 17
Effect of Low Carbon Fuel Standard (LCFS) on Different Fuels Changes Over Timea
In Real (2018) Dollars Per Gallon of Gasoline or Diesel Equivalent
|
Fuel |
Assumed Carbon Intensity |
Cost (Benefit) of LCFS Credits |
|||
|
2018 |
2020 |
2025 |
2030 |
||
|
Gasoline (without ethanol) |
100 |
$0.13 |
$0.19 |
$0.32 |
$0.46 |
|
Diesel (without biodiesel) |
102 |
0.09 |
0.19 |
0.34 |
0.50 |
|
Corn ethanol |
70 |
‑0.50 |
‑0.47 |
‑0.34 |
‑0.20 |
|
Landfill biomethane |
40 |
‑1.34 |
‑1.21 |
‑1.05 |
‑0.89 |
|
Biodiesel |
30 |
‑1.70 |
‑1.57 |
‑1.41 |
‑1.25 |
|
Dairy biomethane |
‑255 |
‑9.50 |
‑9.36 |
‑9.20 |
‑9.05 |
|
aAssumes credit prices remain at $185 per ton. |
|||||
Credit Prices Reflect Market Expectations About Marginal Costs. In concept, market prices for credits adjust to the level needed to ensure there are enough credits to cover deficits. If regulated parties expect that they will not have enough credits to cover their deficits, higher demand for credits will raise prices until they are high enough to encourage the last (most expensive) unit of alternative fuel needed to meet the standard. This is also known as the marginal cost of abatement. Since credits can be banked, current prices reflect, to some extent, expectations about future costs to comply with the program.
Credit Prices Have Been Volatile. As shown in Figure 18, credit prices have been volatile since the program began. This is due to a wide variety of different economic, regulatory, and legal factors. For example, after credit prices rose to roughly $80 at the end of 2013, they subsequently dropped to below $30 in 2014. This is likely a result of the 2013 court ruling that temporarily froze the CI standard. In 2015, prices began to rise again as CARB readopted the regulation with a new CI reduction schedule through 2020. In 2018, prices have increased to roughly $185, in large part because: (1) the number of quarterly deficits generated started to exceed the number of credits, thereby creating demand for banked credits and expectations of potential future credit shortages, and (2) CARB extended the program and established longer‑term CI reduction targets declining to 20 percent in 2030.
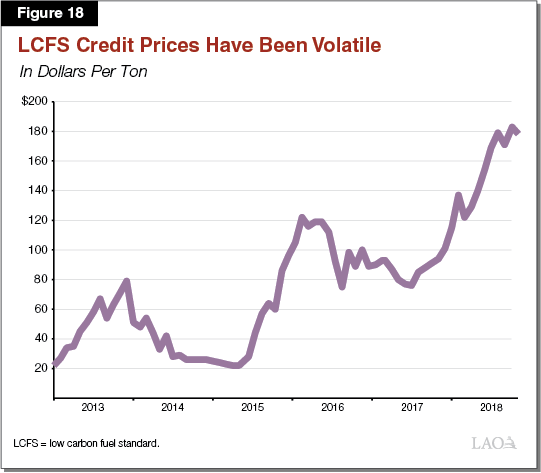
Credit Prices Indicate Program Is a Relatively Costly GHG Reduction Strategy. At the time of this report, market prices for credits were about $185 per ton. As discussed above, credit prices reflects market expectations about the marginal costs to meet the CI standard. Notably, the marginal costs are more than ten times higher than the state’s cap‑and‑trade program, where the market price for allowances is currently about $15 per ton. It is also worth noting that credit prices are about three times higher than the level of CARB’s recently adopted 2021 allowance price ceiling ($65) for the cap‑and‑trade program, which AB 398 directed CARB to implement as a way to limit program costs.
The difference in marginal costs between the programs is likely due to two main factors. First, economy‑wide carbon pricing, such as cap‑and‑trade, is generally considered to be a more economically efficient method for reducing emissions than carbon intensity standards. Second, the LCFS program appears to be more stringent than cap‑and‑trade, at least over the next few years, which means higher cost reductions are needed to comply. For example, as mentioned above, regulated parties are starting to use banked credits that from previous years because CI standards have dropped below actual fuel CI. Over the next few years, significant CI reductions might be needed to ensure there are enough credits to comply. On the other hand, emissions under cap‑and‑trade are still below program caps and are likely continue to be so over the next few years. (For more details on allowance oversupply in cap‑and‑trade, see our 2017 report Cap‑and‑Trade Extension: Issues for Legislative Oversight.) Please see the nearby box for more detailed information about the various key differences between LCFS and cap‑and‑trade.
LCFS and Cap‑and‑Trade Have Key Differences
Both the Low Carbon Fuel Standard (LCFS) and cap‑and‑trade rely on market incentives, rather than technology mandates, to reduce emissions. However, the programs differ in several key ways. Some of these key differences include (1) the emission sources that are regulated, (2) how incentives for reducing emissions are created, and (3) the process for how money is transferred between the affected parties.
Regulate Different Sources of Emissions. Within transportation fuels, the LCFS covers a broader set of emissions because it covers upstream emissions from imported fuels and indirect emissions related to biofuels. However, overall, cap‑and‑trade covers a much broader scope of emissions sources, including electricity, natural gas heating for homes and commercial buildings, and industrial manufacturing facilities. Market‑based policies that cover a broader set of emissions are more efficient because they encourage the lowest cost reductions in all different parts of the economy, not just in transportation fuels.
Create Incentives for Reducing Emissions in Different Ways. Cap‑and‑trade is known as a carbon pricing policy. In economic terms, the allowance price acts like an implicit tax on greenhouse gases (GHGs) that is meant to discourage activities that produce emissions. In contrast, the LCFS is an intensity standard. Intensity standards have two effects: (1) an implicit tax on high carbon fuel suppliers who have to purchase credits and (2) an implicit subsidy for low carbon fuel suppliers who can sell their credits.
Economists generally consider carbon pricing a more efficient way to reduce GHG emissions than intensity standards. This is largely because intensity standards provide relatively little incentive to reduce emissions by reducing consumption of GHG‑intensive goods. For example, the LCFS subsidizes fuels that generate a significant amount of GHGs (such as certain types of ethanol), which actually encourages more consumption of these fuels. In contrast, carbon pricing can encourage emissions reductions in a variety of ways—including reducing the carbon intensity of fuels and reducing the amount of fuels that are consumed. (It is worth noting that the current cap‑and‑trade program encourages a switch from fossil fuels to biofuels, but it does not differentiate between low‑ and high‑carbon intensity [CI] biofuels.)
Different Process for Transferring Money. Gasoline and diesel fuel suppliers have to pay for both LCFS credits and cap‑and‑trade allowances. Most or all of the costs of purchasing credits and allowances are likely passed on to fuel consumers in the form of higher retail prices. Currently, the costs of purchasing allowances is similar to the costs of purchasing credits (roughly 13 cents per gallon), even though LCFS credit prices are more than ten times higher than allowances. This is because gasoline suppliers have to buy more cap‑and‑trade allowances than LCFS credits for each unit of fuel. Fuel suppliers must buy enough allowances to cover all the GHGs associated with combusting the fuel, but only enough credits to cover the difference in GHGs between the fuel CI and the CI standard.
One major difference between the programs is how the money from purchasing allowances and credits is transferred. LCFS transfers occur through private entities (and some government entities) buying and selling credits. This process automatically transfers funds from higher carbon fuel suppliers—or ultimately their consumers—to low carbon fuel suppliers. CARB partially determines what projects benefit from this process by determining what types of fuels (or projects) generate credits. In contrast, transfers in cap‑and‑trade occur through the allocation and auction of allowances. Generally, the Legislature determines where the money raised from selling allowances to transportation fuels suppliers is allocated through the state budget process.
GHG Emission Reductions
A Mix of Alternative Fuels Have Been Used to Comply. In 2017, fuel CI was 3.5 percent below the 2010 benchmark. Roughly 12 percent of the total volume of fuels were from alternative (not gasoline and diesel) fuels—up from 9 percent in 2011. A variety of lower carbon fuels have generated credits, as shown in Figure 19. Nearly 90 percent of the credits were generated from biofuels. In 2017, most of the deficits (about 80 percent) were generated through gasoline sales, but most of the credits (50 percent) were generated by diesel substitutes.
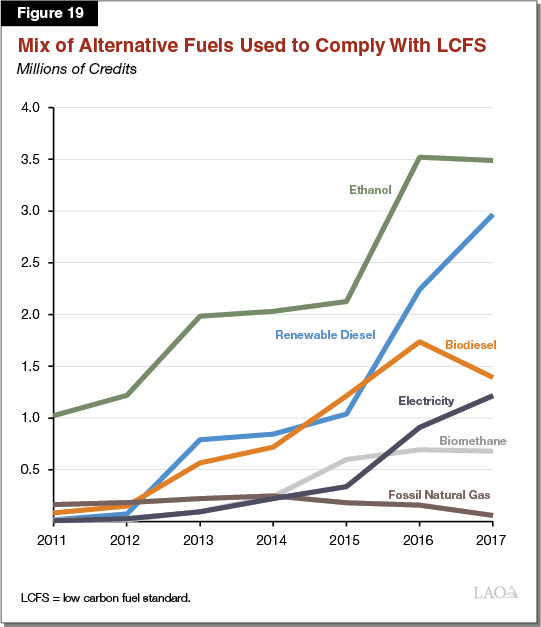
Program Reduces GHG Emissions, but Magnitude of Effect Is Unclear. CARB estimates that the LCFS reduced 2016 emissions by 2.4 million metric tons. It also estimates that the program will reduce a total of 97 million metric tons from 2019 through 2030. However, these estimates are subject to substantial uncertainty because there are a wide variety of factors that make it difficult to estimate the magnitude of GHG reductions attributable to the LCFS. For example, it is unclear how biofuels would have otherwise changed under the federal Renewable Fuel Standard (RFS) and how the two programs interact. The RFS is a federal program that requires fuel suppliers to blend a specified amount of biofuels, including specific categories of biofuels (such as a cellulosic biofuel and biomass‑based diesel). If a large share of some biofuels are supplied to California in order to comply with the LCFS, then less would need to be supplied in other states. As a result, some of the effects of the LCFS might be to simply change the location of where biofuels fuels are supplied—but not the overall type and amount. This is known as fuel “reshuffling.” In addition, by reducing transportation emissions that are subject to the cap‑and‑trade regulation, some of the emission reductions achieved by the LCFS might be offset by increases in emissions from other entities that are subject to the cap‑and‑trade regulation. (For more details on how complementary programs that reduce emissions from capped sources interact with the cap‑and‑trade regulation, see our 2016 report Cap‑and‑Trade Revenues: Strategies to Promote Legislative Priorities.)
Other Effects
Effect on Innovation Unclear. One major rationale for the LCFS is to encourage innovation for alternative fuels, which can help diversify the overall fuel mix. The degree to which the LCFS promotes innovation is unclear. Perhaps the most important factor that would suggest that LCFS drives some innovation is the magnitude of the incentive provided by current credit prices. These relatively high prices provide a substantial incentive for businesses to develop new lower carbon fuels and invest in newer technologies.
On the other hand, certain aspects of the program work to limit the degree to which the LCFS promotes innovation. These include:
- Incremental Improvements in Relatively Mature Technologies. For example, the program has subsidized a significant amount of ethanol production, much of which is a relatively mature technological process that provides only incremental CI improvements compared to gasoline.
- Volatile Credit Prices. Credit price volatility reduces the likelihood of businesses making long‑term investments to develop and produce new low carbon fuels. This is because the returns to such investments—which can be substantially affected by LCFS credit prices—are highly uncertain.
- Fuel Reshuffling. Although there has been a reduction in the carbon intensity of fuels supplied in California, it is difficult to know what portion of these changes is due to additional production of those fuels, and what portion might be related to fuel reshuffling.
Other Environmental Effects. The program has some additional benefits related to reductions in co‑pollutants, such as NOx and PM. CARB estimates that LCFS will decrease annual NOx emissions by over 1,500 tons and PM2.5 emissions by more than 200 tons. (This amount is less than 1 percent of statewide NOx emissions and less than 2 percent of statewide PM2.5 emissions.) On the other hand, there may be some adverse environmental effects—such as erosion and habitat loss—associated with expanding the amount of land used to produce biofuels.
Other Issues for Consideration: LCFS
Do Other Benefits Outweigh Higher Costs? As discussed above, the LCFS reduces GHG emissions at much higher economic costs than the state’s cap‑and‑trade program. These higher costs have real adverse effects on households. As a result, we recommend the Legislature ensure that: (1) the LCFS achieves some other significant benefits—beyond California GHG reductions—that cap‑and‑trade does not and (2) these additional benefits outweigh the much higher program costs. If not, the Legislature could consider eliminating or substantially modifying the program.
For example, as previously indicated, one of the stated goals of the LCFS is to promote innovation in low carbon fuels. However, it is unclear whether the LCFS is driving major innovation. Even if the program provides significant innovation benefits, we recommend the Legislature weigh these additional benefits against the much higher program costs. In addition, the Legislature could consider whether alternative policies, or changes to the existing LCFS, more effectively promote innovation. Such alternatives could include:
- Higher Carbon Prices. As discussed above, the current LCFS credit prices ($185) likely encourage more innovation than the current cap‑and‑trade allowance prices ($15) because the financial incentives are much greater. Alternatively, the Legislature could eliminate the LCFS and, instead, rely on higher economy‑wide carbon prices. This could be done through the state’s cap‑and‑trade program or a carbon tax. Higher carbon prices could also encourage substantial innovation. This approach would likely lead to less innovation in transportation fuels because they would no longer have the incentive from the high LCFS credit prices, but would create greater incentives for innovation in other sectors of the economy because they would face higher carbon prices. Under such an approach, the state might also want to consider using a lifecycle accounting approach to determine cap‑and‑trade compliance obligations for transportation fuels to ensure the program encourages reductions from upstream emissions and biofuels.
- Grants for Research and Development. The Legislature could allocate more funding for research and development activities related to low carbon fuels. For example, the state could expand funding for low carbon fuel grants through the existing Alternative and Renewable Fuel and Vehicle Technology Program administered by CEC. This program funds, among other things, research and demonstrations for low carbon fuels.
- Change LCFS to Prioritize Innovative Technologies. The Legislature could consider directing CARB to make design changes to the LCFS that better target the program toward innovative technologies. For example, a fuel producer could generate credits only if CARB determines that the activities are related to a new or innovative technology that produces fuels that are substantially below the CI standard.
Role of LCFS in Promoting Electric Vehicles. The structure of the LCFS treats electricity somewhat differently than other fuels, such as biofuels. First, residential EV charging credits are awarded to utilities based on the estimated amount of charging that occurs in their service territory. Currently, CARB requires utilities to use the revenue from selling these credits to promote EVs, such as providing rebates to their customers that buy or own EVs. The recent CARB amendments to the program requires utilities to use some of their LCFS revenue for a new statewide program that provides point‑of‑purchase rebates for EVs. (This change is subject to CPUC approval.) A working group of utilities and automakers estimate that the rebate could be up to $2,000 per vehicle.
Furthermore, in response to an Executive Order from Governor Brown, the recent regulatory amendments provide credits for new EV fast charging stations (and hydrogen fueling stations) based on their charging capacity, rather than the amount of electricity they provide. This change was meant to encourage more investment in EV charging infrastructure. However, it is a significant change because, historically, the program only provides credits for the fuel that is actually supplied. As a result, some see this new policy as a contrary to the “fuel‑neutral” design of the program.
Although both the above design features are generally consistent with the state’s overall goals of promoting ZEV adoption, they raise several potential concerns. The two primary concerns are:
- Coordination and Interaction With Other State ZEV Policies Unclear. As discussed above, the LCFS is one of many different policies that encourage ZEV purchases and charging infrastructure. It is unclear whether these policies are well‑coordinated, why this approach is more effective than other programs at promoting ZEVs, and how this program interacts with other state and federal policies.
- No Legislative Input. Unlike most other state ZEV policies—which have explicit statutory direction or funding allocations—the Legislature has provided no statutory direction for the rebates and infrastructure incentives provided through the LCFS. The decisions to provide these incentives, and how the funding is allocated, has been determined through CARB and CPUC regulations. The Legislature might want to consider providing specific direction about the role of the LCFS in its overall approach to promoting ZEVs.
Potential Program Changes to Ensure Effective Cost Containment. CARB currently uses a couple of different strategies to limit current or future LCFS program costs. First, CARB has established a Credit Clearance Market (CCM) that acts as a type of “soft” cap on prices ($211 in 2018 and increasing annually at the rate of inflation), meaning market prices could still exceed cap under certain conditions. However, this mechanism is not structured in a way that places a “hard” cap on long‑run market prices. Second, if CARB determines that prices might become too high, it can make regulatory changes that affect the supply of credits (and deficits). For example, the recent regulatory amendments reduced near‑term CI standards and included new fuels that are eligible to generate credits (such as alternative jet fuels and EV infrastructure capacity)—both of which can put downward pressure on credit prices.
In our view, neither approach is an optimal way to limit program costs. If there is a long‑run shortage of allowances, market prices could still exceed the CCM price. Furthermore, relying on future regulatory adjustments creates uncertainty in the program, which tends to reduce long‑term investments in alternative fuels. In response to these concerns, the Legislature might want to consider directing CARB to establish a hard price ceiling, similar to the cap‑and‑trade allowance price ceiling that the Legislature directed CARB to establish in AB 398. A hard price ceiling helps limit program costs and, relative to existing strategies, provides greater market certainty.
Vehicle Miles Traveled
Another way in which the state is seeking to reduce GHG emissions from the transportation sector is by reducing driving, as measured by VMT. The centerpiece of the state’s efforts in this area comes from Chapter 728 of 2008 (SB 375, Steinberg), which established a new requirement for regional transportation agencies to create “sustainable communities strategies” (SCS) plans as part of their long‑range transportation plans. Below, we provide an overview of SB 375’s requirements and several related state grant programs, assess their economic impacts and benefits, and identify issues for legislative consideration.
Overview of SB 375
Cities and Counties Have Authority Over Land Use Planning in California. The State Constitution grants cities and counties broad authority over ordinances and regulations involving land use planning, so long as they do not conflict with state law. Typically, cities and counties designate certain areas within their jurisdiction as “zones” that have specified land use restrictions. For example, zones often limit the density and types of buildings (such as residential or commercial). These land use limitations, in turn, have major implications for the area’s transportation network. Less dense, single‑use zones tend to require roads to transport people and goods, while denser, mixed‑use zones often can also support transit and other alternatives to driving.
Regional Agencies Are Responsible for Developing Long‑Range Transportation Plans. Metropolitan Planning Organizations (MPOs) are federally required regional transportation planning bodies located in urbanized areas with a population greater than 50,000. Their governing boards are made up of officials from local governments and transportation agencies located in the region. They are required, every five years, to prepare regional transportation plans covering the next 20 years. They also are responsible for allocating certain state and federal transportation funds—generally for projects having a regional impact. California has 18 MPOs that together cover areas accounting for the vast majority of the state’s population. Most MPOs consist of a single county or a group of counties.
SB 375 Requires MPOs to Plan to Meet GHG Emission Reduction Targets. Specifically, the legislation requires each MPO, as part of their long‑range plans, to create a SCS plan to reduce GHG emissions from light‑duty vehicles only. SB 375 tasks CARB with setting emission reduction targets for each MPO to reach by 2020 and 2035, and to update the targets every eight years. CARB also must review each plan to determine whether the plan would meet the targets. Additionally, the legislation coordinates the state’s regional housing planning process with its regional transportation planning process, and provides CEQA exemptions for certain projects that are consistent with a SCS plan. (In the nearby box, we discuss another piece of legislation that was recently enacted related to CEQA and VMT.) Senate Bill 375 took effect in January 2009 and, by September 2010, CARB had established the required targets.
Senate Bill 743: Vehicle Miles Traveled to Be Considered Under the California Environmental Quality Act
The California Environmental Quality Act (CEQA) requires that state and local government agencies evaluate the potential environmental impacts of proposed projects, including transportation and housing projects. Historically, government agencies have evaluated the transportation impacts of a project under CEQA by assessing the project’s effect on traffic congestion. This can sometimes lead to outcomes that run counter to the state’s goals to reduce vehicle miles traveled (VMT) and, consequently, greenhouse gas emissions. For instance, certain transit and bicycling projects can be found to increase congestion and therefore have a negative environmental impact. This is because the conversion of a car lane to a bike lane might increase vehicular congestion. Moreover, housing development projects often address potential congestion impacts by widening the streets, which in turn encourages more driving.
To address these issues, Chapter 386 of 2013 (SB 743, Steinberg) directed the Office of Planning and Research (OPR) to create a new metric for the review of transportation impacts under CEQA that aligns with the state’s GHG emissions reduction goals. In early 2018, OPR submitted proposed guidelines to the California Natural Resources Agency that generally would require government agencies to assess projects for transportation impacts based on VMT (except for roadway capacity projects). (At the time of this report, the guidelines have been approved by California Natural Resources Agency but are still awaiting formal approval by the Office of Administrative Law.)
MPOs Generally Planning to Meet Emissions Targets by Reducing VMT. Senate Bill 375 allows MPOs (subject to CARB review) to determine how to meet their GHG emission reduction targets in their SCS plans. In practice, MPOs mainly are trying to meet their targets by reducing VMT, which in turn reduces light‑duty GHG emissions. The main way MPOs can try to reduce VMT is by changing the criteria they use to allocate regional transportation funds, such as by dedicating more funding to transit and biking projects. To forecast the associated expected changes in VMT, they use “travel demand models” that take into consideration projects to be funded as well as various underlying factors that affect VMT, such as changes in population and land use patterns. Notably, however, SB 375 preserves control over land use decisions for cities and counties, not MPOs.
Several State Grant Programs Available to Support SCS Plan Implementation In the years following the passage of SB 375, the state created several transportation grant programs aimed at reducing GHGs, generally by providing funding for transit, pedestrian, and bicycling projects. Some of these programs have statutory goals that cite SB 375 while others just share the objective of reducing GHGs. Most are funded in whole or in part through the GGRF. Figure 20 summarizes these programs. (In addition to the programs identified in the figure, the state has several other transit and housing grant programs that either pre‑date SB 375 or do not have GHG emissions reduction as an explicit policy goal.)
Figure 20
State Has Several Grant Programs to Support SCS Plan Implementation
|
Program |
Year Established |
Program Goals |
Projects Funded |
Funding (2018‑19)a |
|
Affordable Housing and Sustainable Communities Program |
2014 |
Reduce GHGs and air pollution; improve disadvantaged communities, public health, and connectivity; increase options for mobility and transit ridership; preserve and develop affordable housing, and protect agricultural lands. |
Housing and various transportation projects (such as transit projects). |
$497 million |
|
Transit and Intercity Rail Capital Program |
2014 |
Reduce GHGs, increase transit ridership, integrate rail service, and improve transit safety. |
Transit and rail projects. |
$493 million |
|
Active Transportation Program |
2013b |
Reduce GHGs; increase biking and walking; improve safety and public health; and benefit disadvantaged communities and different active transportation users. |
Bicycle, pedestrian, and other non‑motorized transportation projects. |
$254 million |
|
Low Carbon Transit Operators Program |
2014 |
Reduce GHGs and improve mobility, with a priority on serving disadvantage communities. |
Transit projects and transit operating expenses. |
$124 million |
|
Transformative Climate Communities Program |
2017 |
Reduce GHGs and provide local economic, environmental, and health benefits to disadvantaged communities. |
Various types of neighborhood‑level projects. |
$40 million |
|
Sustainable Transportation Planning Grant Program |
2017 |
Reduce GHGs; preserve transportation systems; increase mobility and safety; promote innovation; support economic vitality; improve health; and prioritize social equity. |
Various types of transportation and land use planning projects. |
$34 million |
|
aFrom all fund sources (including federal funds). bEstablished through the consolidation of three existing grant progarms. SCS = sustainable communities strategies and GHG = greenhouse gas. |
||||
Assessment of Costs and Benefits: SB 375
In short, SB 375 does not yet appear to be having a significant effect on statewide VMT. Below, we review the available evidence on the actual impacts to date on driving behavior of SB 375 and related programs, and examine possible reasons for why they are not having the desired effect. Following this discussion, we review the potential environmental, economic and other impacts of policies focused on reducing VMT.
No Evidence of Any Major Impact to Date
Driving Is Not Decreasing as Planned. Based on our review of available information, it appears that SB 375 likely has not had a major impact on VMT (and, consequently, GHG emissions). In a November 2018 legislatively required report on progress toward meeting SB 375’s goals, CARB found that VMT per capita statewide decreased by nearly 10 percent from 2005 through 2010, before CARB’s initial adoption of GHG emission reduction targets for each MPO. Experts suggest the decrease likely was due to increased gas prices followed by the most recent recession, which discouraged discretionary driving trips. In subsequent years since 2010, as MPOs began developing their SCS plans, VMT per capita increased to a few percentage points higher in 2016 than it had been in 2005. Though much of the increase likely was fueled by factors outside the control of MPOs (such as an improving economy), the overall trajectory suggests that SB 375 did little to blunt the general trend. Moreover, CARB found little evidence in other performance indicators that large‑scale transportation and land use changes were underway in California. For example, the percentage of commuters driving alone either increased or stayed level in most regions.
Several Possible Reasons Why SB 375 Is Not Reducing Driving. Driving might not be decreasing as envisioned under SB 375 because:
- SCS Plans Might Not Be Getting Implemented at the Local Level. Because cities and counties retain authority over land use decisions under SB 375, they are not obligated to make decisions that are consistent with their regional SCS plan. For example, they might have zoning requirements that limit housing density or require minimum amounts of parking for new housing developments that are at odds with the travel demand model assumptions used by their MPO in the regional SCS plan. A recent survey by the University of California (UC), Davis researchers of local governments found that, on average, respondents had adopted only about half of the eight most common land use assumptions found in SCS plans. Moreover, over one‑quarter of respondents were unaware of the state grant programs available to support SB 375 implementation.
- Not Enough Time Has Passed. Even if cities and counties were to modify their land use policies and make land use decisions in accordance with their regional SCS plans, transportation policy experts suggest that it could take many years or even decades to see a corresponding large scale transformation in land use and infrastructure that would notably alter driving behavior. This is because new land use policies generally would only affect new development, which occurs incrementally over time. Moreover, modifying existing land use (such as through infill development) can be a slow process.
- Some Strategies Included in SCS Plans Might Not Actually Reduce VMT. In 2010 and 2014, researchers from UC Davis reviewed the academic literature on the relative effectiveness of various strategies to reduce VMT. Though they found evidence suggesting that many strategies are associated with lower VMT, the effects varied somewhat and, in a few cases, were nonexistent. For example, the researchers found that increasing residential density, employment density, and land use mix by 1 percent is associated with a decrease in VMT of up to 0.2 percent, but they were unable to find evidence that increased transit service or bicycling infrastructure is associated with lower VMT. The researchers also identified several uncertainties and caveats. For example, they noted that the effectiveness of a strategy might vary by context (such as in urban versus rural areas). Additionally, they noted that the existing research generally focused on correlations between strategies and VMT, not causal relationships. For instance, rather than mixed use, compact developments causing residents to drive less, it could be that these development only attract residents whose preference is to drive less regardless of where they live.
Potential Future Impacts and Benefits
This section provides a general description of some of the potential effects if more VMT reduction strategies were implemented in the future.
GHG Emissions. All else constant, decreases in VMT generally reduce GHGs emissions. However, actual emission reductions would depend on a variety of factors, including what types of vehicles are driven less. For example, VMT reductions from ZEVs would not result in any reductions in tailpipe GHG emissions. In addition, reducing VMT from vehicles moving at very fast and very slow speeds would result in greater GHG emission reductions than reducing VMT from vehicles moving at medium speeds (when vehicles consume fuel at maximum efficiency).
Economic Costs and Benefits. If California were to fundamentally change its land use patterns and transportation systems in the future in order to reduce VMT, research suggests there could be a number of associated economic costs and benefits for governments and households. For example, governments could incur costs to develop alternative transportation systems, such as for transit operations and infrastructure. However, these costs could be offset by lower costs for road infrastructure and other public infrastructure, such as from requiring fewer utility and sewer lines for more compact developments. Households located in denser developments could have lower transportation costs if they are able to able to drive less and save on fuel and vehicle maintenance costs, as well as lower utility costs if they occupy smaller dwellings. Some households, however, might be adversely affected if they have less personal space and privacy than they otherwise would if housing was available in less dense developments.
Health and Safety. If VMT is decreased in California in the future, then this would generally decrease other air pollutants emitted by vehicles besides just GHGs. Research shows this can improve certain health conditions, such as asthma, particularly in neighborhoods surrounded by a lot of vehicular traffic. In addition, reducing VMT likely would decrease vehicle‑related injuries and deaths.
Traffic Congestion. Certain strategies to reduce VMT—such as by expanding transit or bicycling infrastructure—can alleviate road congestion in the short term if they attract drivers to use these alternative modes of transportation. In the longer term, however, congestion likely would rebound over time because, as traffic conditions improve, more drivers would be attracted to the use the road who otherwise would have not made the trip—commonly referred to as “latent demand” among transportation policy experts. Even if congestion did not improve in the long run, however, individuals would have more alternatives to driving.
Other Issues for Consideration: SB 375
How Should VMT Polices Fit Within the Overall Framework for Reducing GHG Emissions? CARB assumes in its Scoping Plan that VMT reductions through SB 375 are necessary to meet the state’s main GHG emission reduction goals. However, in the very long term, if the state transitioned to an all ZEV fleet, then reducing VMT to reduce GHGs would essentially become moot. Thus, the importance of VMT reduction in reducing GHG emission depends heavily on the progress the state makes toward adopting cleaner vehicles and fuels. Nonetheless, reducing VMT almost certainly results in downstream benefits in the areas of health and safety. Currently, however, SB 375 does not identify these other benefits as program goals.
How Can the State Actually Achieve VMT Reductions? Senate Bill 375 does not contain any specific state consequences for MPOs and local governments for failing to achieve regional GHG emission reduction targets. Moreover, evidence is lacking on the effectiveness of SB 375’s CEQA‑streamlining incentive to encourage developments consistent with SCS plans. Thus, the Legislature might want to consider other policy options to help achieve these state goals. For example, the Legislature could add more incentives for MPOs and local governments to achieve their targets or it could create consequences for failing to do so. Additionally, the Legislature could consider changing state law to remove some discretion over certain local land use decisions that act as a barrier to developments that tend to reduce overall VMT. (We note that the Legislature recently has considered such legislation.) The Legislature also could consider VMT reduction policy options that have not yet been implemented on a widespread basis, such as road pricing. Each of these options has significant tradeoffs that would need to be carefully weighed.
How Could Research on the Effects of VMT Reduction Be Improved? The research on the effects of policies to reduce VMT on various economic outcomes is limited. This is because much of the research simply compares VMT across areas with different land use and transportation characteristics. Thus, it does not control for the possibility that individuals with certain driving behaviors “self‑select” into the different areas. One way to address this issue is through more “natural experiment” studies that examine travel behavior changes after the environment changes (for example, after a new metro line opens). With improved research to this effect, the state would have better information to use to prioritize funding across various strategies and grant programs that aim to reduce VMT.
Conclusion
The state’s climate policies in the transportation sector are complex and have a wide range of effects—both positive and negative. Based on our review, some of our main findings include: (1) the overall effects of these policies are, in many cases, not well understood; (2) the large number of different policies creates several different challenges (such as potential for poor coordination and difficulties evaluating programs); and (3) the policies are generally more costly than cap‑and‑trade, but there might be some limited circumstances when they could play a complementary role or achieve other significant non‑GHG benefits. In light of these findings, we identify a variety of potential issues for future research and legislative action.