The 2020-21 Budget:
California's Fiscal Outlook
See a list of this year's fiscal outlook material, including a fuller discussion of Proposition 98, on our fiscal outlook budget page.

November 20, 2019
The 2020-21 Budget
California's Fiscal Outlook
- Introduction
- Chapter 1
- Economy
- Updates to the 2019‑20 Budget
- The 2020‑21 Budget
- LAO Comments
- Chapter 2
- Economic Growth Scenario
- Recession Scenario
- LAO Comments
- Appendix
Executive Summary
Does the State Have Enough Resources to Pay for Next Year’s Commitments?
The first aim of the Fiscal Outlook is to answer whether the state will have sufficient resources to pay for its existing commitments in the upcoming budget year (in this case, 2020‑21). As has been the case in recent years, the answer to this question is yes. Moreover, we find that the budget has an estimated, additional $7 billion surplus available in 2020‑21. (We use the term “surplus” to mean the amount of revenues that exceeds spending under current law and policy.) In the upcoming budget season, the Legislature will allocate this amount between making new budget commitments (like spending increases or tax reductions), paying down debts, and building more reserves.
Does the State Have Capacity to Take on New, Ongoing Commitments?
Second, the report addresses what share of the $7 billion surplus in 2020‑21 is available to be allocated to ongoing purposes (meaning amounts that occur annually) versus one‑time purposes (meaning amounts that are spent or saved only in 2020‑21). To address this question, we look at two different expenditure scenarios. We find the state has:
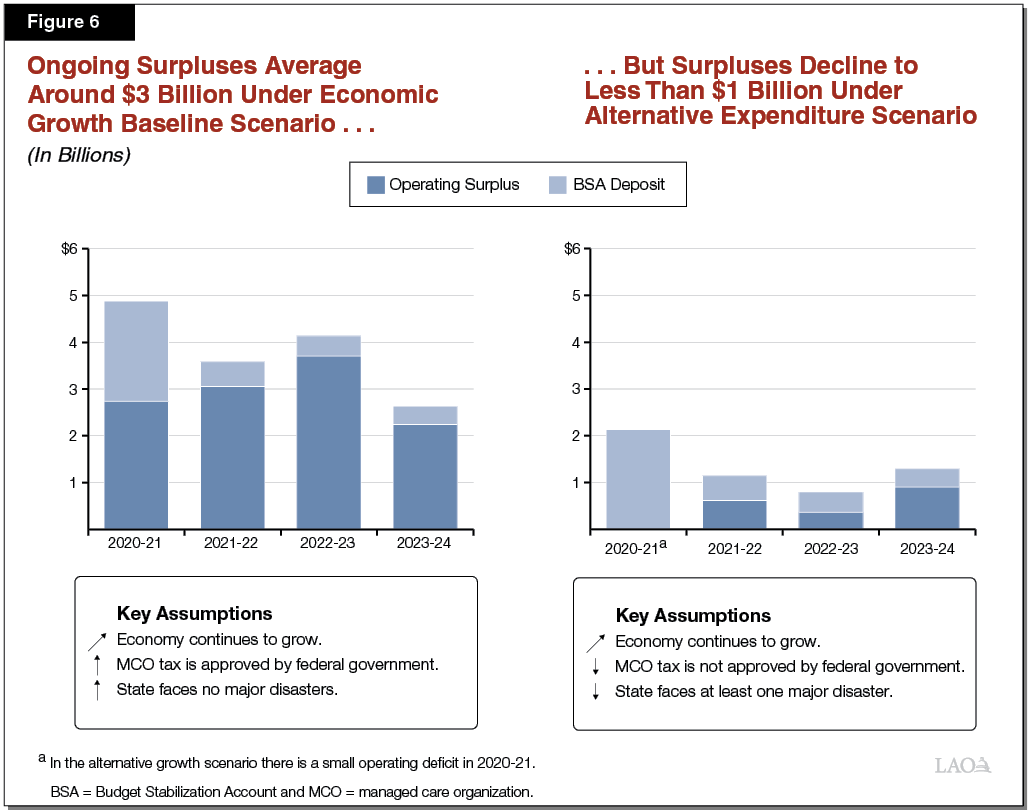
- Ongoing Surplus of $3 Billion Under Baseline Expenditure Scenario. In our baseline expenditure scenario, we find the state has an ongoing surplus of around $3 billion. Importantly, this scenario assumes the federal government approves the managed care organization (MCO) tax and the state faces no major disasters over the next few years. (The MCO tax offsets General Fund costs in Medi‑Cal but it requires federal approval.)
- Ongoing Surplus Drops Below $1 Billion in Alternative Expenditure Scenario. There are a number of risks to the baseline expenditure scenario—including, for example, that the federal government might not approve the MCO tax. In our alternative expenditure scenario, where this and other similarly plausible events—outside the Legislature’s control—occur, we find the state has an ongoing surplus of less than $1 billion.
Consequently, assuming the economy continues to grow, the state has capacity to take on new, ongoing commitments. The extent of that capacity depends on how the Legislature views possible risks to the budget like those in our alternative expenditure scenario.
If a Recession Begins, Does the State Have Enough Reserves to Cover Revenue Shortfalls?
Finally, the Fiscal Outlook assesses whether the state has enough savings—or budget reserves—to cover revenue shortfalls in a recession. We find that the state now is in good shape to weather a recession typical of the post‑World War II era. This shows the significant progress California has made in preparing for a downturn. It does not mean, however, that the state is prepared to weather any possible recession. In fact, many of the nation’s post‑war recessions were milder than more recent recessions have been. Moreover, a recession of similar economic size but with more significant stock market drops would have much larger impacts on the state budget.
Comments and Recommendations
Budget Is in Good Condition. California’s budget continues to be in a good position. We estimate the Legislature will have a $7 billion surplus available to allocate in the upcoming budget process, and in addition, will build an $18.3 billion balance in the state’s rainy day fund by the end of 2020‑21. With more than a decade of economic expansion, coupled with deliberate legislative action to put the budget on better footing, the California budget is in good condition.
Suggest Caution in Allocating Available Surplus. We think there are reasons for the Legislature to be cautious in allocating the estimated $7 billion surplus. Given the findings of our alternative expenditure scenario—which reflects possible costs to the budget outside of the Legislature’s control—we recommend the Legislature initially plan to dedicate no more than $1 billion of the estimated $7 billion surplus to ongoing purposes in 2020‑21. Moreover, because there are signals suggesting the potential for weaker economic performance than our outlook currently assumes, we suggest the Legislature allocate a significant portion of the surplus toward building reserves and paying down debt. For the remaining surplus, we recommend the Legislature focus on one‑time, flexible commitments that can be changed mid‑year if economic conditions change.
Introduction
Each year, our office publishes the Fiscal Outlook in anticipation of the upcoming state budget process. In this report, we aim to answer three questions for lawmakers:
- Does the budget have enough resources available to fund its current commitments in the upcoming fiscal year? In recent years, with an expanding economy and growing revenues, the answer to this question has been yes.
- Over the longer term, does the budget have capacity to take on new commitments, such as spending increases or tax reductions (and if so, how much)? Similarly, in general, our recent Fiscal Outlooks have identified some capacity for new commitments.
- In the event of a recession, would reserves be sufficient to cover revenue shortfalls? Increasingly, we have found the state to be more prepared as it has increased reserve levels.
Our answers to these questions rely on specific assumptions about the future of the state economy, its revenues, and its expenditures. Consequently, our answers are not definitive, but rather reflect our best guidance to the Legislature based on our professional assessments.
Near‑Term Outlook. “Chapter 1” of this report provides our assessment of the budget in the near term (through 2020‑21). In this chapter, we give our assessment of the current condition of the state’s economy and provide our estimates of the budget’s condition under these economic projections. We find that the Legislature would have a nearly $7 billion surplus to allocate in 2020‑21 under our economic and revenue assumptions. However, we also have concluded that budgetary risks—from both economic and other sources—are higher this year compared to the recent past. As such, we think there are reasons for the Legislature to be cautious in allocating these funds.
Longer‑Term Outlook. “Chapter 2” gives our longer‑term outlook (through 2023‑24) for the state budget. In this chapter, we address trends in revenues and expenditures over this multiyear period and give our assessment of the budget’s condition under alternative revenue and expenditure scenarios. We find that, in an economic growth scenario, the state has capacity to cover its current commitments and is in good shape to weather a recession typical of the post World War II era. Based on this analysis, we recommend the Legislature plan to dedicate a sizable portion of the $7 billion surplus toward building more reserves and paying down debts, no more than $1 billion to ongoing commitments, and focus the remainder on one‑time flexible commitments that can be changed midyear if needed.
Chapter 1
This chapter mainly focuses on answering the first question posed in the Introduction: “Does the budget have capacity to fund its current commitments?” The chapter has three parts. First, we describe the economic assumptions that underpin our revenue projections through 2020‑21. Next, we describe new budgetary developments for the current fiscal year (2019‑20) that have occurred since the Legislature passed the budget in June. Finally, we show our estimate of the condition of the 2020‑21 budget, including various near‑term revenue and expenditure trends.
Economy
Economists Anticipate Continued Growth . . . The consensus among professional economists (according to a collection of forecasts compiled by Moody’s Analytics) is that the U.S. economy will continue to grow in the coming years, although at a somewhat slower pace than in recent years. Based on these expectations, we project continued modestly paced growth of the California economy. California is expected to continue to add jobs, but more slowly than in recent years. After slumping through much of 2019, California’s housing markets are expected to rebound somewhat, largely in response to falling mortgage interest rates. Figure 1 displays key assumptions of our economic outlook.
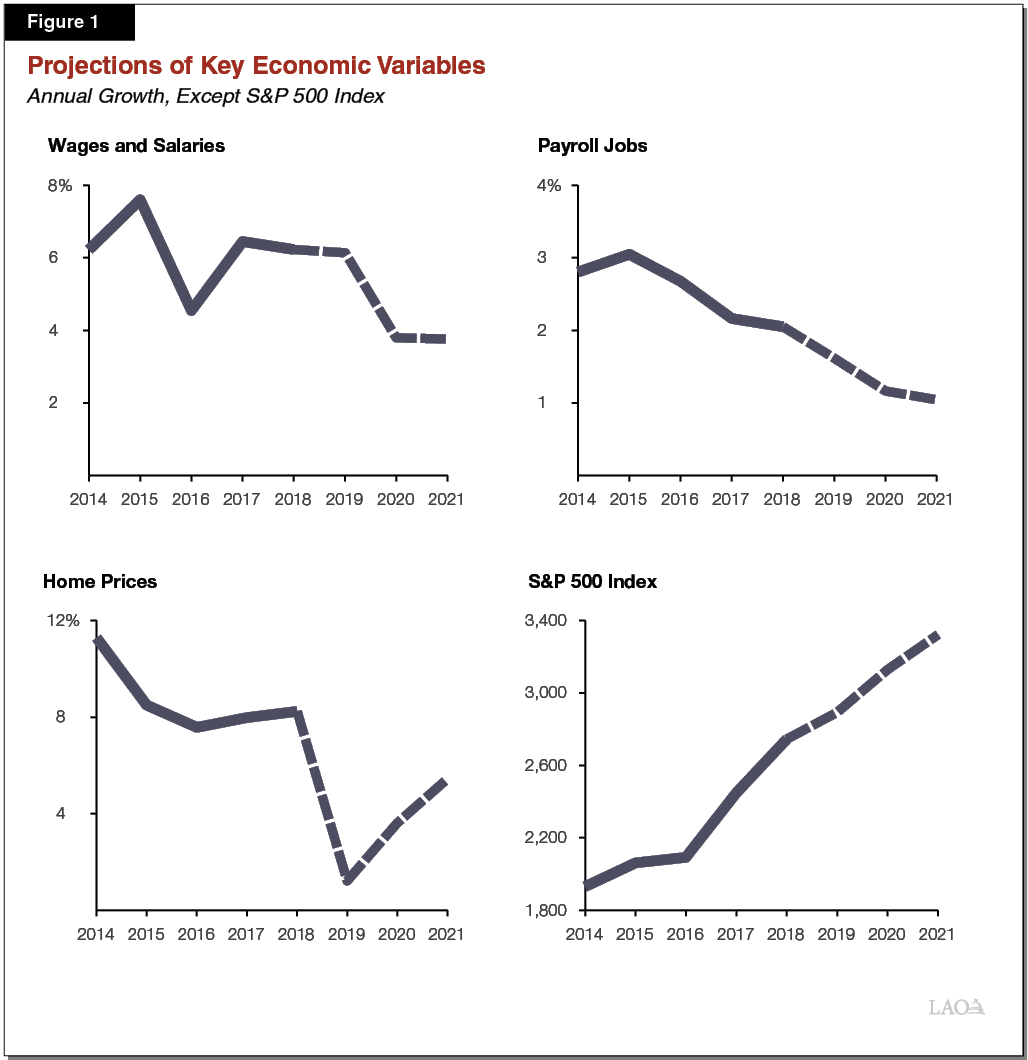
. . . But Risks of a Slowdown Are Higher Than Normal. Uncertainty is inherent to every economic forecast. The state’s economy is complex and major events that shift the economy—such as drops in stock market and real estate prices or changes in relations with trade partners—can be difficult to foresee. That being said, risk to this year’s economic outlook has increased compared to other recent years. Certain economic data points that previously have been key indicators of the state’s economic health have weakened in 2019. Specifically—as discussed in the nearby box—weakening can be seen in data on housing markets, trade activity, new car sales, and business startup funding. This does not necessarily mean a broader economic slowdown is imminent in the near term. The Federal Reserve recently took actions to stimulate the economy by reducing borrowing costs for consumers and businesses. These actions could help improve the trajectory of the economy. Nonetheless, there likely is greater risk in the economic outlook for 2020‑21 than in previous budget cycles.
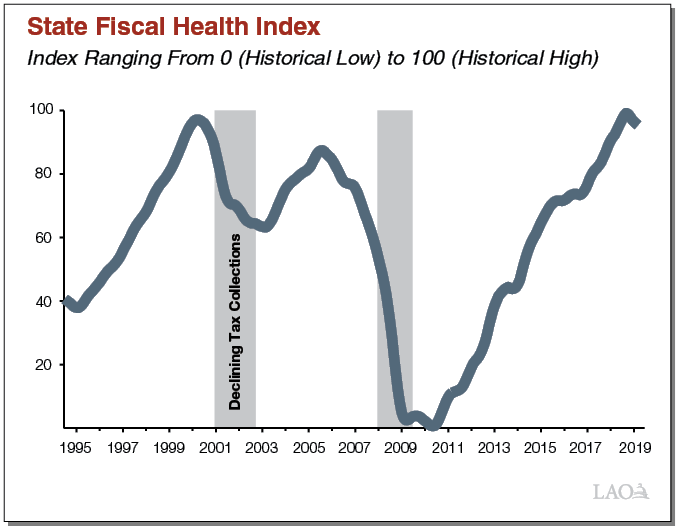
State Fiscal Health Index
We created the State Fiscal Health Index to track the strength of economic conditions relevant to the state’s fiscal health. The index combines ten key data points: home prices, home sales, residential and commercial building permits, the S&P 500 stock market index, venture capital funding, unemployment insurance claims, CalFresh claims, port traffic, and new car sales. The index ranges from 0 (representing the lowest level in the last 25 years) to 100 (representing the highest level in the last 25 years). Both the level of the index and changes in the index from month to month offer information about the state’s fiscal health. When the index is high, revenues tend to be high compared to historical norms. Similarly, when the index is increasing, state revenues are likely to increase over the next 6 to 12 months. On the flipside, a consistent decline in the index over a few months has typically signaled that the state is entering an extended period of revenue weakness.
The figure shows the index through September 2019. The index remained relatively high in September, above 95 percent of months in our historical record. Although the index remains high, it has declined for six straight months. Declines of this duration and magnitude have not been observed since the last recession. Weakening has occurred in housing, trade activity (port traffic), consumer spending (new car sales), and business startup funding (venture capital). Most other indicators, while not outright declining, have stagnated.
More information about the index, as well as monthly updates, can be found on our California Economy & Taxes blog (https://lao.ca.gov/LAOEconTax).
Updates to the 2019‑20 Budget
This report focuses on the 2020‑21 budget, which the Legislature will pass in June of 2020. To assess the condition of the 2020‑21 budget, however, we first examine budgetary changes for 2018‑19 and 2019‑20 that have occurred since the Legislature passed the 2019‑20 Budget Act. As of this writing, we are now nearly halfway through the 2019‑20 budget. With new information about revenue and expenditure developments, this section provides an update on the budget situation for the current year.
Somewhat Higher Revenues. Relative to the budget act, we estimate revenues are $1.6 billion higher across 2018‑19 and 2019‑20 after accounting for mandatory Budget Stabilization Account (BSA) reserve deposits (under the rules of Proposition 2 [2014]). These increased revenues largely are due to higher personal income tax (PIT) collections. (In addition, our estimates of required BSA deposits are lower than those assumed at the budget act due to lower estimates of capital gains revenues.) Of this amount, roughly $250 million is required to be spent on schools and community colleges (under the rules of Proposition 98 [1988]). On net, these factors mean the Legislature has $1.3 billion more in discretionary General Fund resources to allocate.
Assume That Reauthorization of the Managed Care Organization (MCO) Tax Provides Nearly $900 Million in General Fund Benefit. After enacting the 2019‑20 budget in June, the Legislature reauthorized the MCO tax in September. The MCO tax generates General Fund benefit by taxing enrollment in managed care organizations and using that revenue to offset General Fund costs in Medi‑Cal. MCOs are reimbursed—in large part—for this higher tax liability by both the federal and state governments. This mechanism only works, however, with federal approval. Our outlook assumes the federal government does approve the MCO tax, improving the budget’s bottom line condition in 2019‑20 by an additional nearly $900 million. While the federal government recently released draft guidance that would disallow California’s MCO tax, the proposed tax could still gain approval under the existing regulations. We expect a federal decision on this matter is likely in the coming months.
A Few Programs Are Projected to Exhibit Lower Caseload Than Initially Anticipated. Costs associated with some state programs are driven at least in part by caseload (program participants). For these programs, the June budget includes an assumption of how many people will participate in the coming year. If actual caseload turns out to be higher (or lower) than initially anticipated, state costs will be higher (or lower). Using recent information from state departments, our Fiscal Outlook examines trends in caseload for various programs relative to budget assumptions. In the case of three programs, updated data indicate lower annual caseload than the budget anticipated. These programs—Medi‑Cal (the state’s Medicaid program), Cal Grants (financial aid to certain eligible students), and California Work Opportunity and Responsibility to Kids (CalWORKs, cash assistance for low‑income families)—together represent just over $24 billion in General Fund spending in 2019‑20. Across these three programs, we estimate that if current trends continue, costs would be lower by around $450 million in 2019‑20 relative to the June budget assumptions.
Net Improvement of $2.6 Billion in Budget Bottom Line Condition. On net, the factors described in this section (coupled with some other smaller changes) result in an improved budgetary condition of roughly $2.6 billion in 2019‑20 relative to what was assumed in the June budget package.
The 2020‑21 Budget
This section summarizes our projections of revenue and expenditure trends from 2019‑20 to 2020‑21. We then discuss the budget’s overall condition in 2020‑21 under these estimates. As is always the case for all of our estimates in this chapter, actual conditions could differ significantly from what we show here.
Major Revenue and Expenditure Trends
Continued, but Slower, Growth in General Fund Revenues. We are projecting revenues to continue to grow from 2019‑20 to 2020‑21, but we expect growth in revenues to slow compared to recent years. Year over year, we expect growth in the state’s three major General Fund revenue sources—PIT, corporation tax, and sales and use tax—to be $5 billion, representing a growth rate of 3.5 percent. This is somewhat slower than growth from these revenues in other recent years, largely as a result of slowing growth in the PIT—consistent with our projections of slower growth in the state economy in 2020‑21. Figure 2 shows our near‑term outlook for state revenues.
Figure 2
LAO Near‑Term Revenue Outlook
General Fund (In Millions)
|
2018‑19 |
2019‑20 |
2020‑21 |
|
|
Personal income tax |
$99,048 |
$102,288 |
$105,902 |
|
Sales and use tax |
26,127 |
27,108 |
27,961 |
|
Corporation tax |
13,938 |
13,550 |
14,134 |
|
Subtotals, “Big Three” Revenues |
($139,113) |
($142,946) |
($147,997) |
|
Insurance tax |
$2,721 |
$2,955 |
$3,051 |
|
Other revenues |
2,092 |
2,159 |
2,534 |
|
BSA transfer |
‑3,329 |
‑2,050 |
‑2,137 |
|
Other transfers |
‑1,315 |
‑1,851 |
‑78 |
|
Totals, Revenues and Transfers |
$139,281 |
$144,158 |
$151,367 |
|
BSA = Budget Stabilization Account. |
|||
Moderate Growth in General Fund Spending on Schools and Community Colleges. General Fund spending on schools and community colleges is determined mainly by a set of constitutional formulas outlined in Proposition 98. These formulas establish a minimum funding requirement for K‑14 education, commonly known as the minimum guarantee. The state meets the guarantee through a combination of General Fund and local property tax revenue. Under our outlook, the state would allocate about 40 percent of General Fund revenue toward meeting the guarantee each year of the period. With General Fund tax revenue estimated to increase nearly $5.3 billion from 2019‑20 to 2020‑21, our estimate of required General Fund spending on schools and community colleges correspondingly increases by $2 billion. In the nearby box, we provide more information on changes in the minimum guarantee and the implications for K‑14 funding.
School and Community College Spending in 2020‑21
Under Near‑Term Outlook, Proposition 98 Guarantee Grows $3.4 Billion. Our estimate of the minimum guarantee in 2020‑21 is $84.3 billion, an increase of $3.4 billion (4.2 percent) over the revised 2019‑20 level (see figure below). The majority of this increase is attributable to growth in General Fund revenue, with the remainder attributable to growth in local property tax revenue.
Proposition 98 Minimum Guarantee Grows Steadily Under LAO Outlook Estimates
(Dollars in Millions)
|
2018‑19 |
2019‑20 |
2020‑21 |
Change From 2019‑20 |
||
|
Amount |
Percent |
||||
|
General Fund |
$54,617 |
$55,985 |
$57,963 |
$1,978 |
3.5% |
|
Local property tax |
23,723 |
24,886 |
26,306 |
1,420 |
5.7 |
|
Total Guarantee |
$78,340 |
$80,871 |
$84,269 |
$3,398 |
4.2% |
$2.1 Billion Available After Covering Cost‑of‑Living Adjustment (COLA) and Reserve Deposit. When the minimum guarantee is growing, the state typically funds a statutory COLA for certain school and community college programs. Providing the COLA (estimated at 1.79 percent) and adjusting for changes in enrollment would cost $1.1 billion. Under our outlook, formulas in the California Constitution also would require the state to deposit $350 million into the Proposition 98 (1988) reserve. After accounting for these actions and backing out various one‑time costs and savings related to 2019‑20, $2.1 billion would remain for other spending priorities in the upcoming budget.
Additional $500 Million Available From One‑Time Funds. Separate from the increase in the 2020‑21 guarantee, we estimate the state has about $500 million available in one‑time funds. These funds result from revisions to 2018‑19 and 2019‑20 that require the state to provide additional one‑time payments to meet the guarantee in those years. The Legislature could allocate these funds for any of its one‑time K‑14 priorities.
Overall Budget Condition
We Currently Estimate a Nearly $7 Billion Surplus Will Be Available in 2020‑21. Our analysis of trends in revenues and expenditures suggests that the Legislature will have a nearly $7 billion General Fund surplus available to allocate in the 2020‑21 budget process. (The nearby box describes what we mean when we use the term “surplus” in the Fiscal Outlook.) This surplus largely is the result of a number of factors: (1) the reauthorization—and assumed approval—of the MCO tax; (2) continued moderate growth in revenues offset only partially by higher required spending on schools and community colleges; and (3) low growth in overall expenditures, resulting from roughly $5 billion in one‑time programmatic spending amounts in 2019‑20 that do not continue in 2020‑21. If the federal government did not approve the MCO tax, we estimate the available surplus in 2020‑21 would be about $4 billion. Figure 3 shows the General Fund near‑term condition under our assumptions and estimates.
What Do We Mean by “Surplus” in the Fiscal Outlook?
One of the goals of the November Fiscal Outlook is to assess how much capacity the budget has to pay for existing and—potentially—new commitments. To answer this question, we compare our projections of revenues to spending under current law and policy. When projected revenues exceed these baseline expenditures, we use the term surplus to describe the difference. (If, instead, we found spending under current law was higher than projected revenues, we would use the phrase “deficit” or “budget problem” to describe the difference.) This surplus is reflected in the 2020‑21 ending balance in the Special Fund for Economic Uncertainties (SFEU), shown in figure 3. (Balances in other state reserves are not included in the surplus because the Legislature—and State Constitution—have already dedicated those funds to that purpose.) Importantly, this balance does not assume how the Legislature might allocate any surplus among other reserve accounts, new one‑time or ongoing program commitments, or tax reductions. Once the Legislature does make these allocations, the SFEU balance will change.
Figure 3
LAO Estimate of Near‑Term Budget Condition
General Fund (In Millions)
|
2018‑19 |
2019‑20 |
2020‑21 |
|
|
Prior‑year fund balance |
$11,155 |
$7,748 |
$5,378 |
|
Revenues and transfers |
139,281 |
144,158 |
151,367 |
|
Expenditures |
142,688 |
146,529 |
148,628 |
|
Ending fund balance |
$7,748 |
$5,378 |
$8,116 |
|
Encumbrances |
$1,385 |
$1,385 |
$1,385 |
|
SFEU balance |
$6,363 |
$3,993 |
$6,731 |
|
Reserves |
|||
|
BSA |
$14,136 |
$16,186 |
$18,323 |
|
SFEU |
6,363 |
3,993 |
6,731 |
|
Safety net |
900 |
900 |
900 |
|
Total Reserves |
$21,399 |
$21,079 |
$25,954 |
|
Note: Amounts in this table reflect current law and policy. SFEU = Special Fund for Economic Uncertainties and BSA = Budget Stabilization Account. |
|||
BSA Balance Reaches $18.3 Billion in 2020‑21. The state’s largest reserve account is the BSA. It is governed by the rules of Proposition 2. When revenues are growing, the state must annually set aside funds in the BSA until those deposits reach a threshold of 10 percent of General Fund taxes. In addition to these required deposits, in recent years, the Legislature has deposited funds into the BSA on an optional basis. We estimate that, under our revenue estimates and current policy, the BSA would reach $18.3 billion by the end of 2020‑21 (see Figure 3). Of this total, we estimate $15.2 billion is the “mandatory” portion, deposited subject to the rules of Proposition 2, and $3.1 billion is the “optional” balance, over which the Legislature has more control. Under our estimates, in 2020‑21, the mandatory portion of the BSA is very close to reaching the 10 percent threshold referenced earlier.
LAO Comments
Budget Is in Good Condition. Under our estimates of the condition of the budget for 2020‑21, the state has sufficient resources to fund its current commitments. In fact, these estimates suggest the budget has a nearly $7 billion surplus for the Legislature to allocate in the upcoming budget process. While this is not insignificant, it is smaller than the surpluses allocated by the two most recent budgets. (For comparison, our office estimated the 2018‑19 budget allocated a surplus of $10 billion and the 2019‑20 budget allocated a surplus of nearly $22 billion). In addition, under our estimates, the state would build an $18.3 billion balance in the BSA by the end of 2020‑21. With more than a decade of economic expansion, coupled with deliberate legislative action to put the budget on better footing, the California budget is in good condition.
Suggest Caution in Allocating Surplus. The Legislature will soon begin deliberating about how to allocate the state’s surplus between building more reserves and one‑time and ongoing budgetary commitments. Our estimates currently suggest there will be a $7 billion surplus available for these purposes. (This amount will change in January with the Governor’s budget proposal and more available information.) A cautious approach to allocating this surplus would be to dedicate most—or all—of it to reserve deposits and one‑time purposes. We think there are reasons to be more cautious this year. There are signals suggesting the economy could be weaker than our 2020‑21 outlook currently assumes. Moreover, as we will discuss in “Chapter 2,” the budget’s capacity for more ongoing commitments depends—in large part—on a number of factors that are outside of the Legislature’s control.
Chapter 2
This chapter focuses on answering two questions posed in the introduction: “What capacity does the state have to take on new budgetary commitments?” and “Does the state have sufficient reserves to weather a recession?” We answer these questions by assessing the budget’s condition through 2023‑24 under economic growth and recession scenarios. We examine two economic scenarios because California’s revenue performance depends, in large part, on how the economy and stock market are performing. Yet anticipating the health of the state’s economy (and the level of the stock market) is increasingly difficult the further into the future we look. Revenues can be higher or lower by tens of billions of dollars depending on these factors. This report reflects our best guidance to the Legislature at this time, but the state economy and budget could be very different by 2023‑24 than what we have presented here.
Economic Growth Scenario
Assumes Continued, Though Slower, Economic Growth. In our economic growth scenario, we assume job growth continues but at a somewhat slower pace than in recent years. Wage growth overall also slows, but remains above average in some high‑wage industries, such as professional and technical services (for example, lawyers, engineers, and computer programmers) and in the technology sector (for example, software development and data processing). This scenario assumes a relatively flat stock market.
Two Expenditure Scenarios Displayed in This Section. Economic changes and their ensuing revenue implications are not the only source of uncertainty for the Legislature as it considers the longer‑term condition of the state budget. Other sources of uncertainty include decisions by the voters and federal government, which could leave the budget in better or worse condition by billions of dollars over the multiyear period. To illustrate some of this uncertainty within our economic growth scenario, we show two different expenditure scenarios: (1) our typical baseline expenditure projections and (2) an alternative scenario that quantifies some risks to state expenditures outside of the Legislature’s control.
Organization of This Section. In the remainder of this section we describe: (1) our revenue estimates under this economic growth scenario, (2) our baseline expenditure scenario, (3) our alternative expenditure scenario, and (4) the budget’s bottom line condition under these different estimates.
Revenues
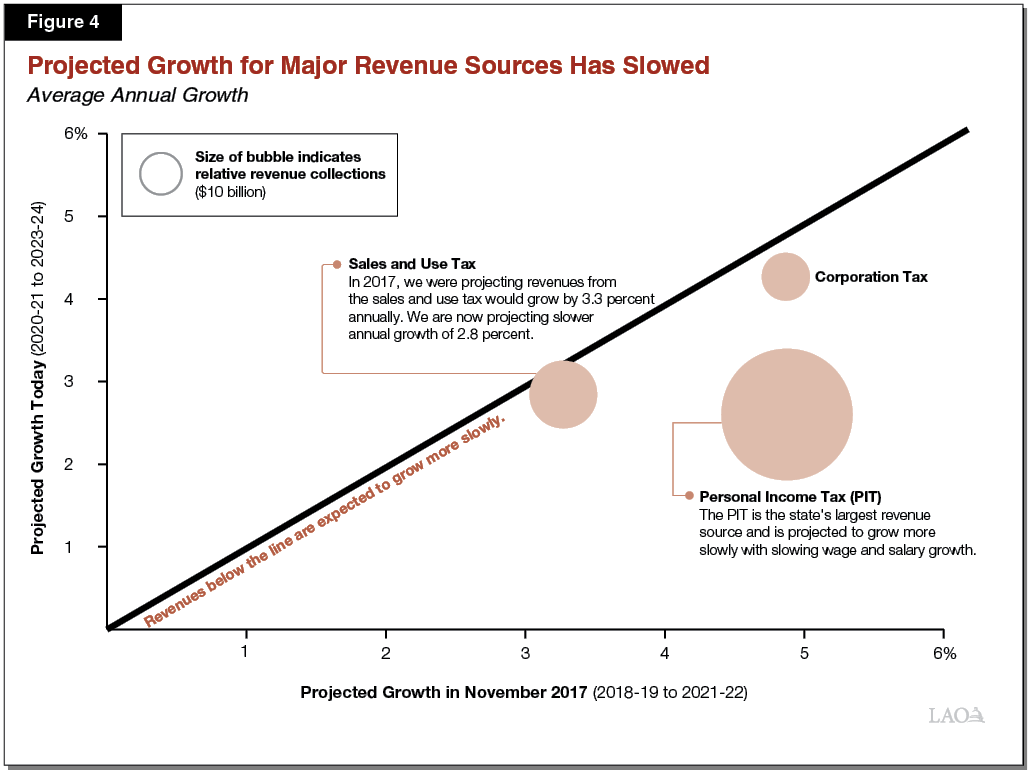
Revenue Growth Averages 3.4 Percent Over the Period. Under our growth scenario, General Fund revenues (excluding constitutionally required transfers into the state’s reserves) grow from $146 billion in 2019‑20 to $167 billion in 2023‑24. This represents a modest 3.4 percent average annual growth rate over the period. The state’s three largest tax revenue sources—the PIT, sales and use tax, and corporation tax—collectively are responsible for the vast majority of the overall growth.
Our Projections of Revenue Growth—Particularly in PIT—Have Declined. Figure 4 compares our projected growth of the three largest taxes from this outlook to our projections from the Fiscal Outlook published in November 2017. (In both cases, the growth rates reflect our projections for the upcoming budget year and two subsequent years.) All three revenue sources in the figure are below the line—meaning that we are now projecting those revenues to grow more slowly than we did two years ago. Growth in PIT, the state’s largest General Fund revenue source, has declined most noticeably. This decline largely reflects our assumptions of lower growth in wages and salaries. However, in November 2017, we reflected stock market growth of 1 percent from 2018 through 2022. We now assume stock market growth of 3 percent from 2020 to 2024.
Baseline Expenditure Scenario
In the baseline expenditure scenario, we make assumptions typical to our Fiscal Outlook historically. In particular, this scenario assumes that current state and federal laws and policies remain in place. Our expenditure projections also provide adjustments to address the impact of inflation with the aim of maintaining the purchasing power of current legislative commitments. Finally, this scenario does not include any potential—but unpredictable—events with significant costs to the state, such as an extraordinarily bad wildfire season (similar to ones the state has experienced in recent years).
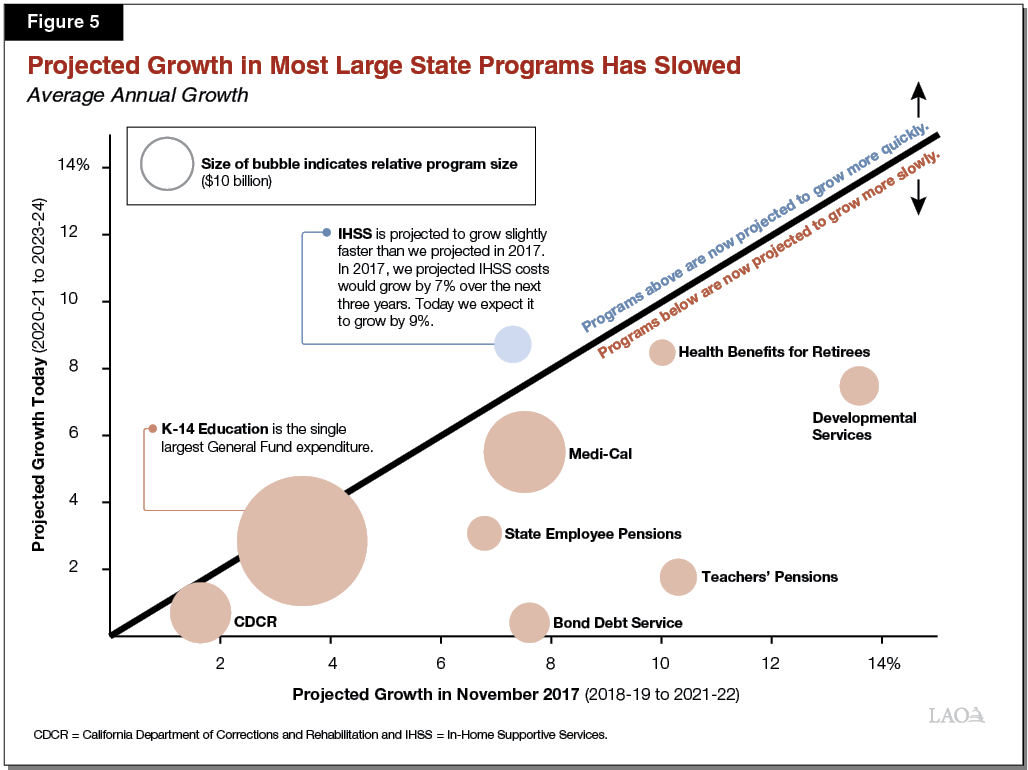
Overall General Fund Spending Grows Nearly $18 Billion (2.9 Percent) Over the Period. If current law and policies were to stay in place, we project General Fund spending would increase $18 billion from 2019‑20 to 2023‑24 (representing average annual growth of 2.9 percent). The largest single contributor to this increase is constitutionally required spending on schools and community colleges (under the formulas set forth in Proposition 98). In total, K‑14 education accounts for $7.1 billion of the increase.
Our Projections of Annual Spending Growth Also Have Declined Noticeably. Similar to Figure 4, Figure 5 shows how our projections of growth in major state programs has changed in the last two years. Circles below the line have lower projected growth now relative to 2017. (The figure includes programs with more than $2 billion in General Fund expenditures, but excludes those large programs with increases driven mostly by discretionary choices, like the University of California and the California State University.) As the figure shows, in nearly all cases, our projections of spending growth in these areas has slowed. This is not the result of one single trend, but rather a variety of demographic, economic, and policy factors. The nearby box describes these trends in greater detail for each of the areas shown in the figure.
Trends in Projected Cost Growth of Major General Fund Programs
School and Community College General Fund Spending Growth Declines Slightly. General Fund spending on schools and community colleges mainly is determined by a set of constitutional formulas established by Proposition 98 (1988). These formulas have a number of inputs, including changes in General Fund revenue, per capita personal income, and student attendance. Compared to November 2017, our projection of out‑year annual General Fund cost growth for schools and community colleges has slowed from 3.5 percent to 2.8 percent. This decrease mainly reflects our lower General Fund revenue projections. While these changes might not seem substantial, even relatively small shifts in these growth rates can have noticeable implications for the state budget because K‑14 education represents a significant share of General Fund spending.
Medi‑Cal Growth Declines Somewhat. Our projection of annual growth in costs for Medi‑Cal, the state’s Medicaid program, slowed from 7.5 percent in 2017 to 5.5 percent today. This largely results from three factors. First, pursuant to federal law, the state’s share of cost for major Medi‑Cal populations was scheduled to gradually increase before reaching stable levels 2021‑22. Because the vast majority of this increase in state costs has already taken place, remaining associated cost growth in Medi‑Cal is lower going forward. Second, our previous projections did not assume reauthorization of the state’s managed care organization (MCO) tax (consistent with then current law), whereas our current projections do. (As explained in “Chapter 1,” the MCO tax reduces General Fund costs for Medi‑Cal.) Third, our previous projections assumed significantly higher Medi‑Cal caseload than our current projections, which capture recent downward trends in the caseload.
CDCR Cost Growth Has Declined Slightly. Cost growth for the California Department of Corrections and Rehabilitation (CDCR) is primarily the net result of two opposing factors. On the one hand, a decline in the inmate population as a result of sentencing changes is lowering state costs by reducing the number of inmates that must be housed in contract prisons. On the other hand, employee compensation costs are growing as the state has approved new labor agreements that increase CDCR employees’ salaries and other elements of compensation.
Bond Debt Service Cost Growth Has Declined Substantially. Our projections of growth in General Fund costs for bond debt service has slowed substantially compared to recent projections. One key reason is that we now are assuming a lower interest rate than we have in the last few years on recently issued debt. Facing a consistently low interest rate environment for many years, the State Treasurer has been able to refinance much of the state’s bond debt. Consequently, much of the state’s outstanding debt now carries a lower interest rate resulting in lower annual costs.
Developmental Services Growth Has Declined Somewhat. The Department of Developmental Services (DDS) provides individuals with qualifying developmental disabilities with services to meet their needs. For a few years, a major driver of our projected cost growth for DDS has been scheduled increases in minimum wage under state law, which affect a large segment of direct service providers. Because minimum wage increases are scheduled to slow significantly after 2022, annual cost growth in DDS also slows.
In‑Home Supportive Services (IHSS) Growth Has Increased Slightly. The IHSS program provides personal care and domestic services to low‑income individuals to help them remain safely in their own homes and communities. The increase in average annual growth in state IHSS costs between our 2017 and 2019 estimates is largely attributed to policy changes enacted in the 2019‑20 budget. For example, the 2019‑20 budget continues to fund a restoration of IHSS service hours, which in 2017 we assumed would end in 2019‑20 consistent with state law. Additionally, the 2019‑20 budget shifted what we assumed to be county costs in 2017 to the state General Fund.
California State Teachers’ Retirement System Growth Has Declined Substantially. We expect slower growth in state costs associated with teachers’ pensions for two reasons. One, compensation grew more slowly than we expected over the past few years, consequently, we lowered our estimate for salary growth. Two, the supplemental payments provided by the 2019‑20 budget package reduce what the state is required to pay over the next few years.
CalPERS Growth Has Declined Substantially. In our prior forecasts, there were two significant factors resulting in substantial increases to state pension contribution rates: (1) in some recent years, actual investment returns were lower than assumed, and (2) the California Public Employees’ Retirement System (CalPERS) board adopted new actuarial assumptions about future investment returns and mortality rates. Both of these factors increased state costs in the near term. Because these factors have been phased in, increases in CalPERS’ projections of state contributions have slowed. Additionally, the state’s supplemental payments—payments above what is required by CalPERS—approved in recent budgets have lowered the state’s contribution rates from what they otherwise were projected to be.
Costs of Health Benefits for Retirees Largely Similar. The amount of money the state pays each year toward retired state employees’ health benefits depends on (1) CalPERS health premiums and (2) the number of people receiving the benefit. Because the year‑to‑year growth in health premiums and enrollment cannot be easily predicted, we rely on past average growth of premiums and enrollment to project costs in the outlook. Our assumptions of future growth have not changed substantially in the past few years.
Slowing Expenditure Growth Improves Budget’s Condition. Relative to our estimates in 2017, our projections of future annual General Fund cost growth have slowed from 4.6 percent to 3.4 percent. Comparing our current projections to prior projections allows us to identify changes in the underlying trends in program growth. This allows us to isolate different causes of changes in the budget’s condition. In this case, slower projected growth in General Fund expenditures means the budget’s condition is significantly improved over the multiyear period despite slowing revenue growth.
Alternative Expenditure Scenario
The alternative expenditure scenario described in this section begins with the same estimates regarding program cost growth as the baseline scenario, but makes four different assumptions as described below. Importantly, these four assumptions reflect possible costs to the state outside of the Legislature’s control. While this scenario is meant to be illustrative, we believe it is plausible.
MCO Tax Not Approved by Federal Government. Our baseline expenditure scenario assumes the federal government approves the MCO tax, as described earlier in “Chapter 1”. Under recently released draft regulations, California’s MCO tax would not be approved, although the state could still get approval before the regulations are finalized. This would mean the state would get some or even all of the General Fund benefit assumed in our baseline expenditure scenario. If the federal government does not approve the tax, however, General Fund Medi‑Cal costs would be higher by nearly $7 billion across the entire outlook period. As such, lack of approval of the tax presents a significant risk to the state’s budget condition.
State Faces at Least One Major Natural Disaster. In recent years, the state has experienced major wildfires that have caused historically significant losses of life and property damage. Our baseline scenario accounts for higher costs associated with fighting forest fires as the state’s fire season has become longer and more severe. However, the baseline scenario does not attempt to predict the occurrence of more major fires, for example, ones involving significant destruction of many buildings and other structures. To address the uncertainty associated with these unforeseen, but plausible, events, this alternative scenario assumes the state faces at least one major natural disaster—like a significant wildfire—during the outlook period.
Education Bond Approved by Voters. In September, the Legislature passed a measure to place a $15 billion education facilities bond on the 2020 primary ballot. Our baseline expenditure scenario does not include the out‑year General Fund costs to pay debt service on any bond debt issued under this measure because it still requires voter approval. If approved, the bond would result in increased General Fund costs of around $500 million in the last year of our outlook.
Federal Government Delays Cut to Hospitals Serving Higher Shares of Medi‑Cal and Uninsured Patients. Currently, hospitals that serve a disproportionate share of Medi‑Cal and uninsured patients receive supplemental payments funded from dedicated federal funding that is matched by state and local funds. Under current federal law, the amount of federal funding for these payments is scheduled to be reduced, triggering reductions in the required amount of state and local matching funds. Our baseline scenario reflects this current law. However, if Congress delays the federal reductions—as it has already done in the recent past—state costs would remain higher. As such, our alternative scenario assumes the scheduled federal reductions do not occur in the multiyear period, leading to around $200 million per year in additional state costs.
Alternative Scenario Excludes Risks That Involve Legislative Decisions. This alternative scenario excludes changes in the state budget that would require a new law or policy by the Legislature. We also exclude higher or lower costs resulting from the Legislature addressing the current issues faced by the state. For example, this alternative scenario excludes any potential changes in state policy related to the state’s energy grid or PG&E bankruptcy proceedings.
General Fund Condition
Surpluses Average Around $3 Billion Under Baseline Expenditure Scenario. Figure 6 displays our estimates of the budget’s capacity for new commitments, assuming the economy continues to grow. As the left side of the figure shows, under our baseline expenditure scenario, the state has operating surpluses averaging around $3 billion over the period. (The nearby box describes what we mean by the term “operating surplus” in the Fiscal Outlook.) The key reason the state has relatively substantial operating surpluses under this scenario—despite the fact that projected revenue growth has slowed compared to recent outlooks—is that we are also projecting slower expenditure growth in a variety of programs (as discussed earlier).
What Do We Mean by “Operating Surplus” and “Operating Deficit” in the Fiscal Outlook?
In contrast to the term “surplus” we described in “Chapter 1”, which is the amount available to allocate in the budget year (2020‑21), an operating surplus reflects resources available over time. An operating surplus occurs when annual revenues exceed expenditures under current law and policy, resulting in an increase to the Special Fund for Economic Uncertainties (SFEU). An operating deficit occurs when the reverse is true and annual expenditures exceed revenues, causing a decline in the SFEU. When we show operating surpluses under our economic growth scenario it suggests the budget has capacity to take on new ongoing commitments, such as multiyear program expansions or tax reductions. By contrast, our recession scenarios typically display operating deficits. When an operating deficit appears in a recession scenario, the key test of the budget’s fiscal health is whether the state has sufficient reserves to cover these deficits. If not, the Legislature would need to make difficult choices—such as raising taxes; reducing spending; or shifting costs, for instance, to local governments—to balance the budget.
Surpluses Decline Below $1 Billion Under Alternative Expenditure Scenario. The right side of Figure 6 shows how the budget’s condition would change under the alternative expenditure scenario described earlier. This scenario is the same as our baseline scenario, but assumes: (1) the MCO tax is not approved by the federal government, (2) the state faces at least one major natural disaster over the multiyear period, (3) the education bond is approved by voters, and (4) the federal government delays the cut to hospitals serving higher shares of Medi‑Cal and uninsured patients. As the figure shows, operating surpluses would still be positive, but would decline below $1 billion over the multiyear period.
Recession Scenario
Scenario Assumes California Enters Recession in January 2021. This section examines whether there would be sufficient reserves to address revenue shortfalls if the state experienced a typical post World War II (WWII)recession starting in January 2021. If this occurred, the Legislature likely would have passed the 2020‑21 budget (in June 2020) without realizing a recession was coming. In this case, the $7 billion surplus anticipated in our growth scenario would fail to materialize. Consequently, beginning in early 2021, the Legislature would be revising the 2020‑21 budget and trying to anticipate the emerging shortfall for 2021‑22.
Organization of this Section. The remainder of this section describes how such a scenario would play out over the multiyear period. First, we describe the economic conditions assumed in our recession scenario and our estimates of its revenue implications. Second, we describe how constitutionally driven expenditure programs would be affected by those revenue changes. Finally, we show the budget’s bottom line condition under these assumptions.
Economy and Revenues
Recession Scenario Represents an Average of Post‑WWII Recessions. The recession scenario displayed in this section roughly averages the severity of the historical changes in the economic conditions that occurred in the dozen recessions following WWII. (These recessions varied substantially in length and severity.) Our recession scenario assumes that the unemployment rate in California begins to rise in January 2021, eventually peaking at 8 percent, and begins to decline in 2022. Over the course of the recession, the lowest rate of growth in gross domestic product (GDP) is ‑0.6 percent and the S&P 500 loses about 30 percent of its value, dropping to a low of 2200.
Recession Scenario Results in a Roughly $50 Billion Revenue Loss. Under the recession scenario, revenue growth would slow in 2020‑21 and then decline year over year by close to $8 billion in 2021‑22. Compared to the economic growth scenario, the total revenue loss would be just over $50 billion over the outlook period. Much of these reductions would be driven by declines in the PIT. Under our assumption that the economy starts to recover in 2022, revenues grow slowly in 2022‑23 and more robustly in 2023‑24.
Unique Conditions of Future Recession Will Result in Different Revenue Implications. In general, more severe recessions have greater fiscal implications for the state, but this relationship is not perfect. Recessions with similar job losses and GDP declines can have different effects on the state budget depending on their underlying causes and the sectors of the economy that are impacted. For example, our recession scenario generally is similar in severity to the early 2000s recession. The early 2000s recession, however, was especially bad for stock prices, which dropped by about one‑half compared to about 30 percent in our recession scenario. Stock price fluctuations have an outsized impact on state revenues because a large portion of PIT is collected from higher‑income earners who tend to earn significant income from these sources. As a result, the early 2000s recession had a greater impact on state revenue than what we show in our recession scenario.
Expenditures
Lower Spending on Schools and Community Colleges Offsets $20 Billion of Revenue Losses. The formulas determining school and community college funding tend to result in lower spending when revenues and personal income are declining and higher spending when the opposite is true. In our recession scenario, in which revenues decline, the minimum funding level for K‑14 education also declines. We assume the Legislature funds schools and community colleges at this lower level (as has occurred in past recessions). As a result, General Fund spending on K‑14 education declines by a few billions of dollars year over year in 2021‑22. Over the course of the recession, required spending on schools and community colleges is lower—relative to the growth scenario—by $20 billion, offsetting revenue losses by a corresponding amount.
Lower Debt and Infrastructure Spending Requirements Offset Additional $7 Billion of Revenue Losses. Proposition 2 (2014) requires the state to make annual deposits into reserves, additional payments toward certain state debts, and—under certain conditions—spend more funds on infrastructure. In the recession scenario, we assume the state suspends required deposits into reserves and stops making infrastructure payments (under the Constitution’s budget emergency rules). We also assume the state’s required debt payments decline consistent with the constitutional formulas. As a result, relative to the growth scenario, the state’s revenue losses are offset by nearly $7 billion in lower Proposition 2 requirements over the period.
General Fund Condition
In the Recession Scenario, Reserves Are Sufficient to Cover Deficits. Figure 7 displays the budget’s condition under our recession scenario. These estimates assume a number of automatic program expenditure suspensions are not operative. (These suspensions are discussed more later.) The left side of the figure shows the annual operating deficits in the recession scenario. (Refer to the above box for more information on how we use the term “operating deficit.”) The right side of the figure shows how much in total reserves remain at the end of each year in the scenario. As the figure shows, the state enters the recession with nearly $23 billion in reserves and uses most of the balance to cover billions of dollars of operating deficits. At the end of 2023‑24, the state still could have about $5 billion in reserves remaining.
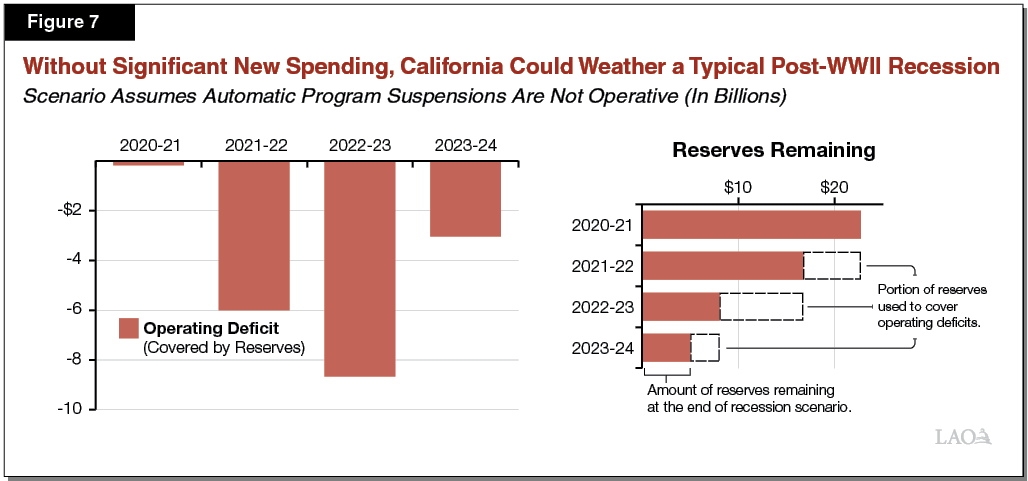
Reserves Would Be Nearly Sufficient to Hold School and Community College General Fund Spending Flat. In our Fiscal Outlook publications, we assume the state funds schools and community colleges at their constitutional minimum level. More explicitly, this means, under our assumptions, General Fund spending on K‑14 education declines even as the state maintains other programmatic spending using reserves. This assumption is consistent with the publication’s aim to show spending under current law and policies, which generally has been to fund schools and community colleges at the minimum required funding level. If instead the Legislature wanted to mitigate the impact on schools and spend above the minimum level, the state’s operating deficits would be larger. In this recession scenario, however, there would be nearly enough reserves to hold spending on schools and community colleges flat from 2020‑21 to 2022‑23. In 2023‑24, General Fund spending on schools and community colleges would begin to grow again under the constitutional funding formulas.
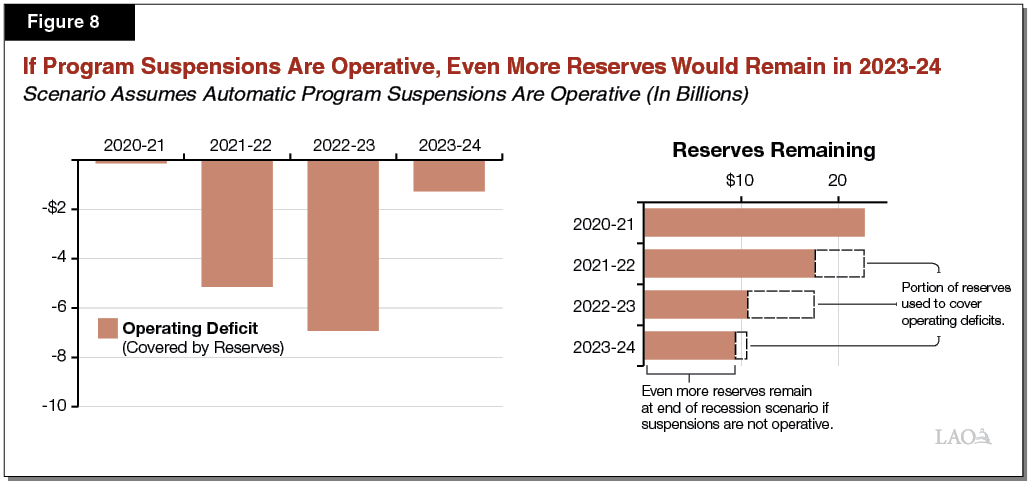
More Reserves Available With Suspensions. The 2019‑20 budget package made a number of ongoing program augmentations subject to suspension on December 31, 2021 if the budget is not projected to collect sufficient revenues to fund them. (These suspensions are described in more detail in the nearby box.) Under current law, the suspensions would be operative in our recession scenario, meaning expenditures would be lower by nearly $1 billion in 2021‑22 and nearly $2 billion in 2022‑23. (We assume the same language is operative for 2023‑24, although the law does not state this.) Figure 8 shows the implications for the budget: operating deficits would be lower than we showed in Figure 7 and the state would have over $9 billion in reserves remaining at the end of 2023‑24.
Some Expenditure Amounts Are Subject to Suspension
Suspension Language in State Law. The 2019‑20 budget package made a number of ongoing expenditures subject to suspension on December 31, 2021. In these cases, statute directs the Department of Finance (DOF) to calculate whether General Fund revenues will exceed General Fund expenditures—without suspensions—in 2021‑22 and 2022‑23. If DOF determines revenues do exceed expenditures, then the programs’ ongoing expenses will continue. If not, expenditures across nearly a dozen different programs are automatically suspended. The cost of not suspending these augmentations is $850 million in 2021‑22 (a half‑year effect) and $1.7 billion in 2022‑23.
Suspensions Cannot Be Partially Operative Under Current Law. Under the statute, if the budget does not have sufficient resources to pay for all expenditures without suspensions, the suspensions become operative for all affected programs. This means that, even if the budget has the capacity to pay for some of the affected programs, under current law, none of those expenditures would continue.
Calculation Excludes Entering Fund Balance. In some cases, the budget might have sufficient resources to pay for the expenditures subject to suspension (without using dedicated reserves), but the suspensions would still be operative. That is because the calculation considers only projected revenues from each individual fiscal year and not resources carried over from prior years (in the entering fund balance).
LAO Comments
California Is in Good Shape to Weather a Recession Typical of Post‑WWII Era. This report assess whether the budget has sufficient reserves to cover revenue shortfalls in the event of a typical post‑WWII recession. We found the state has sufficient reserves to cover operating deficits under such a recession, even assuming the downturn began midway through the budget year. This is an important marker of budgetary strength and shows the significant progress California has made in preparing for a recession. The state now is in good shape to weather a recession typical of the post‑WWII era. This does not mean, however, that the state is prepared to weather any possible recession. In fact, many of the nation’s post‑WWII recessions were milder than more recent recessions have been. Moreover, a recession of similar economic size but with more significant stock market drops would have much larger impacts on the state budget.
Economic Growth Scenario Shows State Has Capacity for New Commitments . . . In “Chapter 1” we estimated that the budget has $7 billion to allocate in 2020‑21, indicative of a good budget condition. In “Chapter 2,” we assessed how much of that $7 billion surplus would be available for ongoing purposes under two expenditure scenarios. In our baseline expenditure scenario, the state has $3 billion for new ongoing commitments. Importantly, this scenario assumes the federal government approves the MCO tax and the state faces no major disasters over the next few years. In a plausible alternative expenditure scenario, where these conditions do not hold, the state has less than $1 billion for new ongoing commitments.
. . . But Recommend Caution in Allocating Surplus. Given the findings of our alternative expenditure scenario—which reflects possible costs to the budget outside of the Legislature’s control—we recommend the Legislature initially plan to dedicate no more than $1 billion of the estimated $7 billion surplus to ongoing purposes in 2020‑21. (Later in the budget season, when there is additional information about federal and voter decisions, there could be more ongoing capacity available.) Moreover, because there are signals suggesting the potential for weaker economic performance than our outlook currently assumes, we suggest the Legislature allocate a significant portion of the surplus toward building reserves and paying down debt. For the remaining surplus, we recommend the Legislature focus on one‑time, flexible commitments that can be changed midyear if economic conditions change for the worse.
Appendix
Appendix Figure 1
LAO November 2019 Revenue Outlook
General Fund (In Millions)
|
Growth Scenario |
2018‑19 |
2019‑20 |
2020‑21 |
2021‑22 |
2022‑23 |
2023‑24 |
|
Personal income tax |
$99,048 |
$102,288 |
$105,902 |
$109,378 |
$112,031 |
$114,383 |
|
Sales and use tax |
26,127 |
27,108 |
27,961 |
28,849 |
29,714 |
30,414 |
|
Corporation tax |
13,938 |
13,550 |
14,134 |
14,660 |
15,292 |
16,022 |
|
Subtotals, “Big Three” Revenues |
($139,113) |
($142,946) |
($147,997) |
($152,886) |
($157,038) |
($160,819) |
|
Insurance tax |
$2,721 |
$2,955 |
$3,051 |
$3,152 |
$3,251 |
$3,330 |
|
Other revenues |
2,092 |
2,159 |
2,534 |
2,601 |
2,642 |
2,678 |
|
BSA transfer |
‑3,329 |
‑2,050 |
‑2,137 |
‑531 |
‑429 |
‑389 |
|
Other transfers |
‑1,315 |
‑1,851 |
‑78 |
276 |
288 |
291 |
|
Totals, Revenues and Transfers |
$139,281 |
$144,158 |
$151,367 |
$158,385 |
$162,790 |
$166,730 |
|
Recession Scenario |
2018‑19 |
2019‑20 |
2020‑21 |
2021‑22 |
2022‑23 |
2023‑24 |
|
Personal income tax |
$99,048 |
$102,288 |
$101,840 |
$94,139 |
$95,300 |
$106,267 |
|
Sales and use tax |
26,127 |
27,108 |
27,805 |
27,360 |
27,846 |
29,657 |
|
Corporation tax |
13,938 |
13,550 |
13,899 |
13,619 |
13,089 |
15,111 |
|
Subtotals, “Big Three” Revenues |
($139,113) |
($142,946) |
($143,544) |
($135,119) |
($136,235) |
($151,035) |
|
Insurance tax |
$2,721 |
$2,955 |
$3,051 |
$3,152 |
$3,251 |
$3,330 |
|
Other revenues |
2,092 |
2,159 |
2,534 |
2,601 |
2,642 |
2,678 |
|
BSA Transfer |
‑3,329 |
‑2,050 |
‑1,641 |
— |
— |
— |
|
Other transfers |
‑1,315 |
‑1,851 |
‑78 |
276 |
288 |
291 |
|
Totals, Revenues and Transfers |
$139,281 |
$144,158 |
$147,410 |
$141,148 |
$142,417 |
$157,334 |
|
BSA = Budget Stabilization Account. |
||||||
Appendix Figure 2
Spending Through 2020‑21
LAO Baseline Expenditure Estimates (In Millions)
|
Estimates |
Outlook |
||||
|
2018‑19 |
2019‑20 |
2020‑21 |
Change From |
||
|
Major Education Programs |
|||||
|
Schools and community collegesa |
$54,617 |
$55,985 |
$57,963 |
3.5% |
|
|
University of California |
3,743 |
3,938 |
3,955 |
0.4 |
|
|
California State University |
3,811 |
4,302 |
4,188 |
‑2.7 |
|
|
Financial aid |
1,198 |
1,602 |
1,535 |
‑4.2 |
|
|
Child care |
1,370 |
2,042 |
1,997 |
‑2.2 |
|
|
Major Health and Human Services Programs |
|||||
|
Medi‑Cal |
$19,680 |
$22,015 |
$23,532 |
6.9% |
|
|
Department of Developmental Services |
4,487 |
5,031 |
5,561 |
10.5 |
|
|
In‑Home Supportive Services |
3,777 |
4,493 |
5,116 |
13.9 |
|
|
SSI/SSP |
2,760 |
2,733 |
2,730 |
‑0.1 |
|
|
Department of State Hospitals |
1,727 |
1,770 |
1,808 |
2.1 |
|
|
CalWORKs |
298 |
453 |
577 |
27.4 |
|
|
Major Criminal Justice Programs |
|||||
|
Corrections and Rehabilitation |
$11,821 |
$12,223 |
$12,147 |
‑0.6% |
|
|
Judiciary |
1,928 |
2,161 |
2,183 |
1.0 |
|
|
Debt service on state bonds |
$5,358 |
$5,313 |
$5,742 |
8.1 |
|
|
Other programs |
$26,111 |
$22,466 |
$19,593 |
‑12.8 |
|
|
Totals |
$142,688 |
$146,529 |
$148,628 |
1.4% |
|
|
aReflects the General Fund component of the Proposition 98 minimum guarantee. SSI/SSP = Supplemental Security Income/State Supplementary Payment. |
|||||
Appendix Figure 3
Spending by Major Area Through 2023‑24
LAO Growth Scenario, Baseline Expenditure Estimates (In Millions)
|
Estimates |
Outlook |
Average |
||||||
|
2018‑19 |
2019‑20 |
2020‑21 |
2021‑22 |
2022‑23 |
2023‑24 |
|||
|
Education Programs |
||||||||
|
Schools and community collegesb |
$54.6 |
$56.0 |
$58.0 |
$59.9 |
$61.5 |
$63.1 |
3.0% |
|
|
Other major education programs |
10.1 |
11.9 |
11.7 |
12.4 |
13.0 |
13.7 |
3.5 |
|
|
Health and Human Services |
32.7 |
36.5 |
39.3 |
40.9 |
43.1 |
46.0 |
6.0 |
|
|
Criminal Justice |
13.7 |
14.4 |
14.3 |
14.4 |
14.6 |
14.9 |
0.8 |
|
|
Debt service on state bonds |
5.4 |
5.3 |
5.7 |
6.0 |
5.7 |
5.8 |
2.4 |
|
|
Other programs |
26.1 |
22.5 |
19.6 |
21.8 |
21.1 |
21.0 |
‑1.6 |
|
|
Totals |
$142.7 |
$146.5 |
$148.6 |
$155.3 |
$159.1 |
$164.5 |
2.9% |
|
|
Percent Change |
2.7% |
1.4% |
4.5% |
2.4% |
3.4% |
|||
|
aFrom 2019‑20 to 2023‑24. bReflects General Fund component of the Proposition 98 minimum guarantee. Note: Program groups are defined to include departments listed in Appendix Figure 2. |
||||||||